Luxor Hashrate Lookback Series – June 2026
June 2026’s hashrate and hashprice trends, forward market participation, trading activity and contract performance.




Luxor’s Monthly Lookback Series is a deep dive into Bitcoin hashrate market activity. In this post, we cover June 2026’s hashrate market and hashprice trends, forward market participation, trading activity and contract performance.
Summary
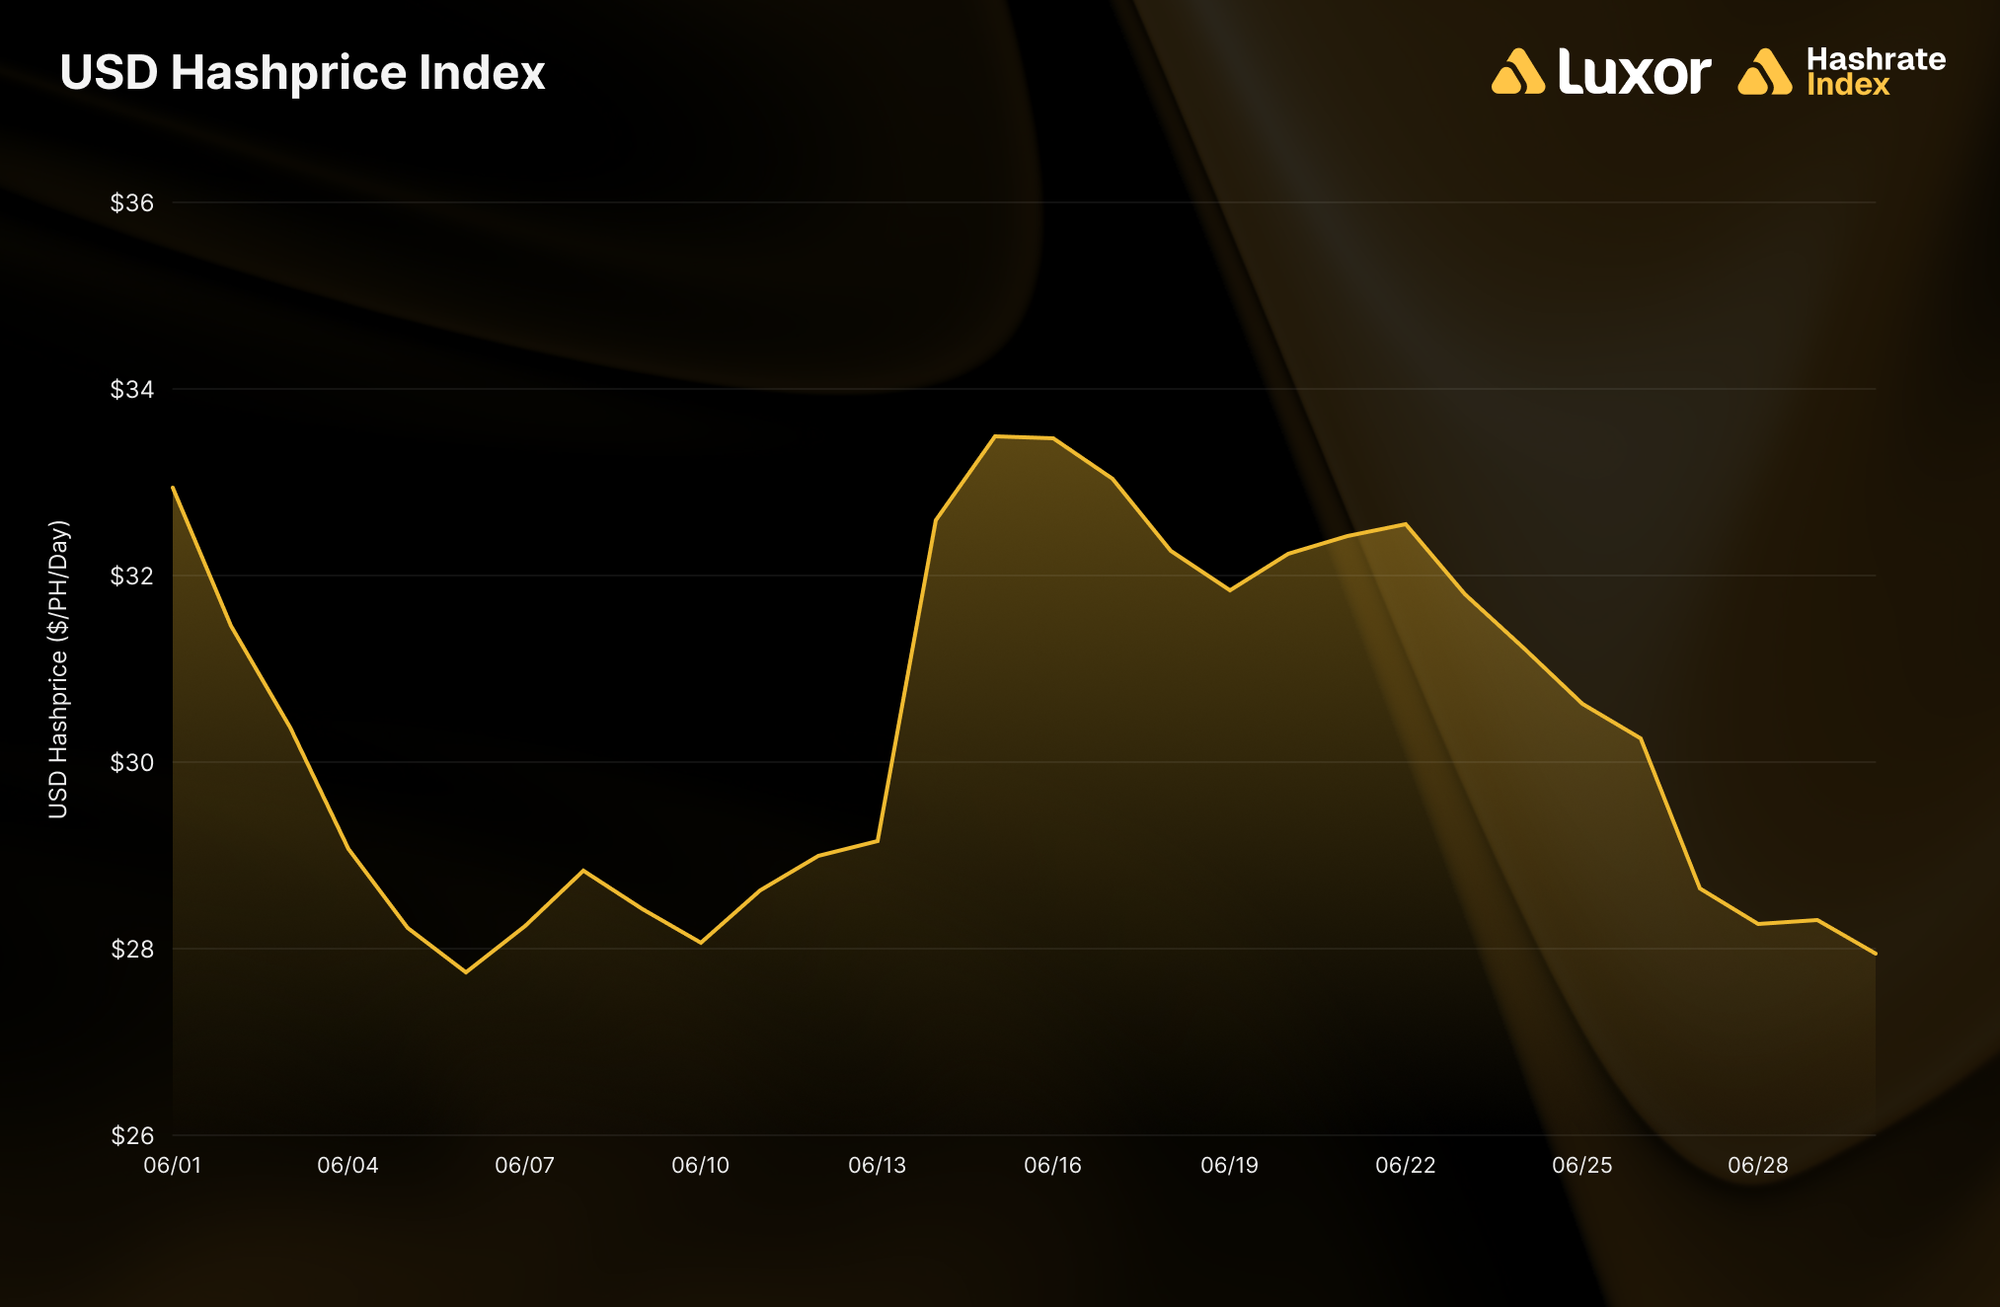
- New Hashprice Lows: USD hashprice set a fresh daily all-time low of $27.74 per PH/s/day on June 6, undercutting February 24’s $27.89, and a record-low monthly average of $30.37 (-17.0%), below March’s prior of $31.27.
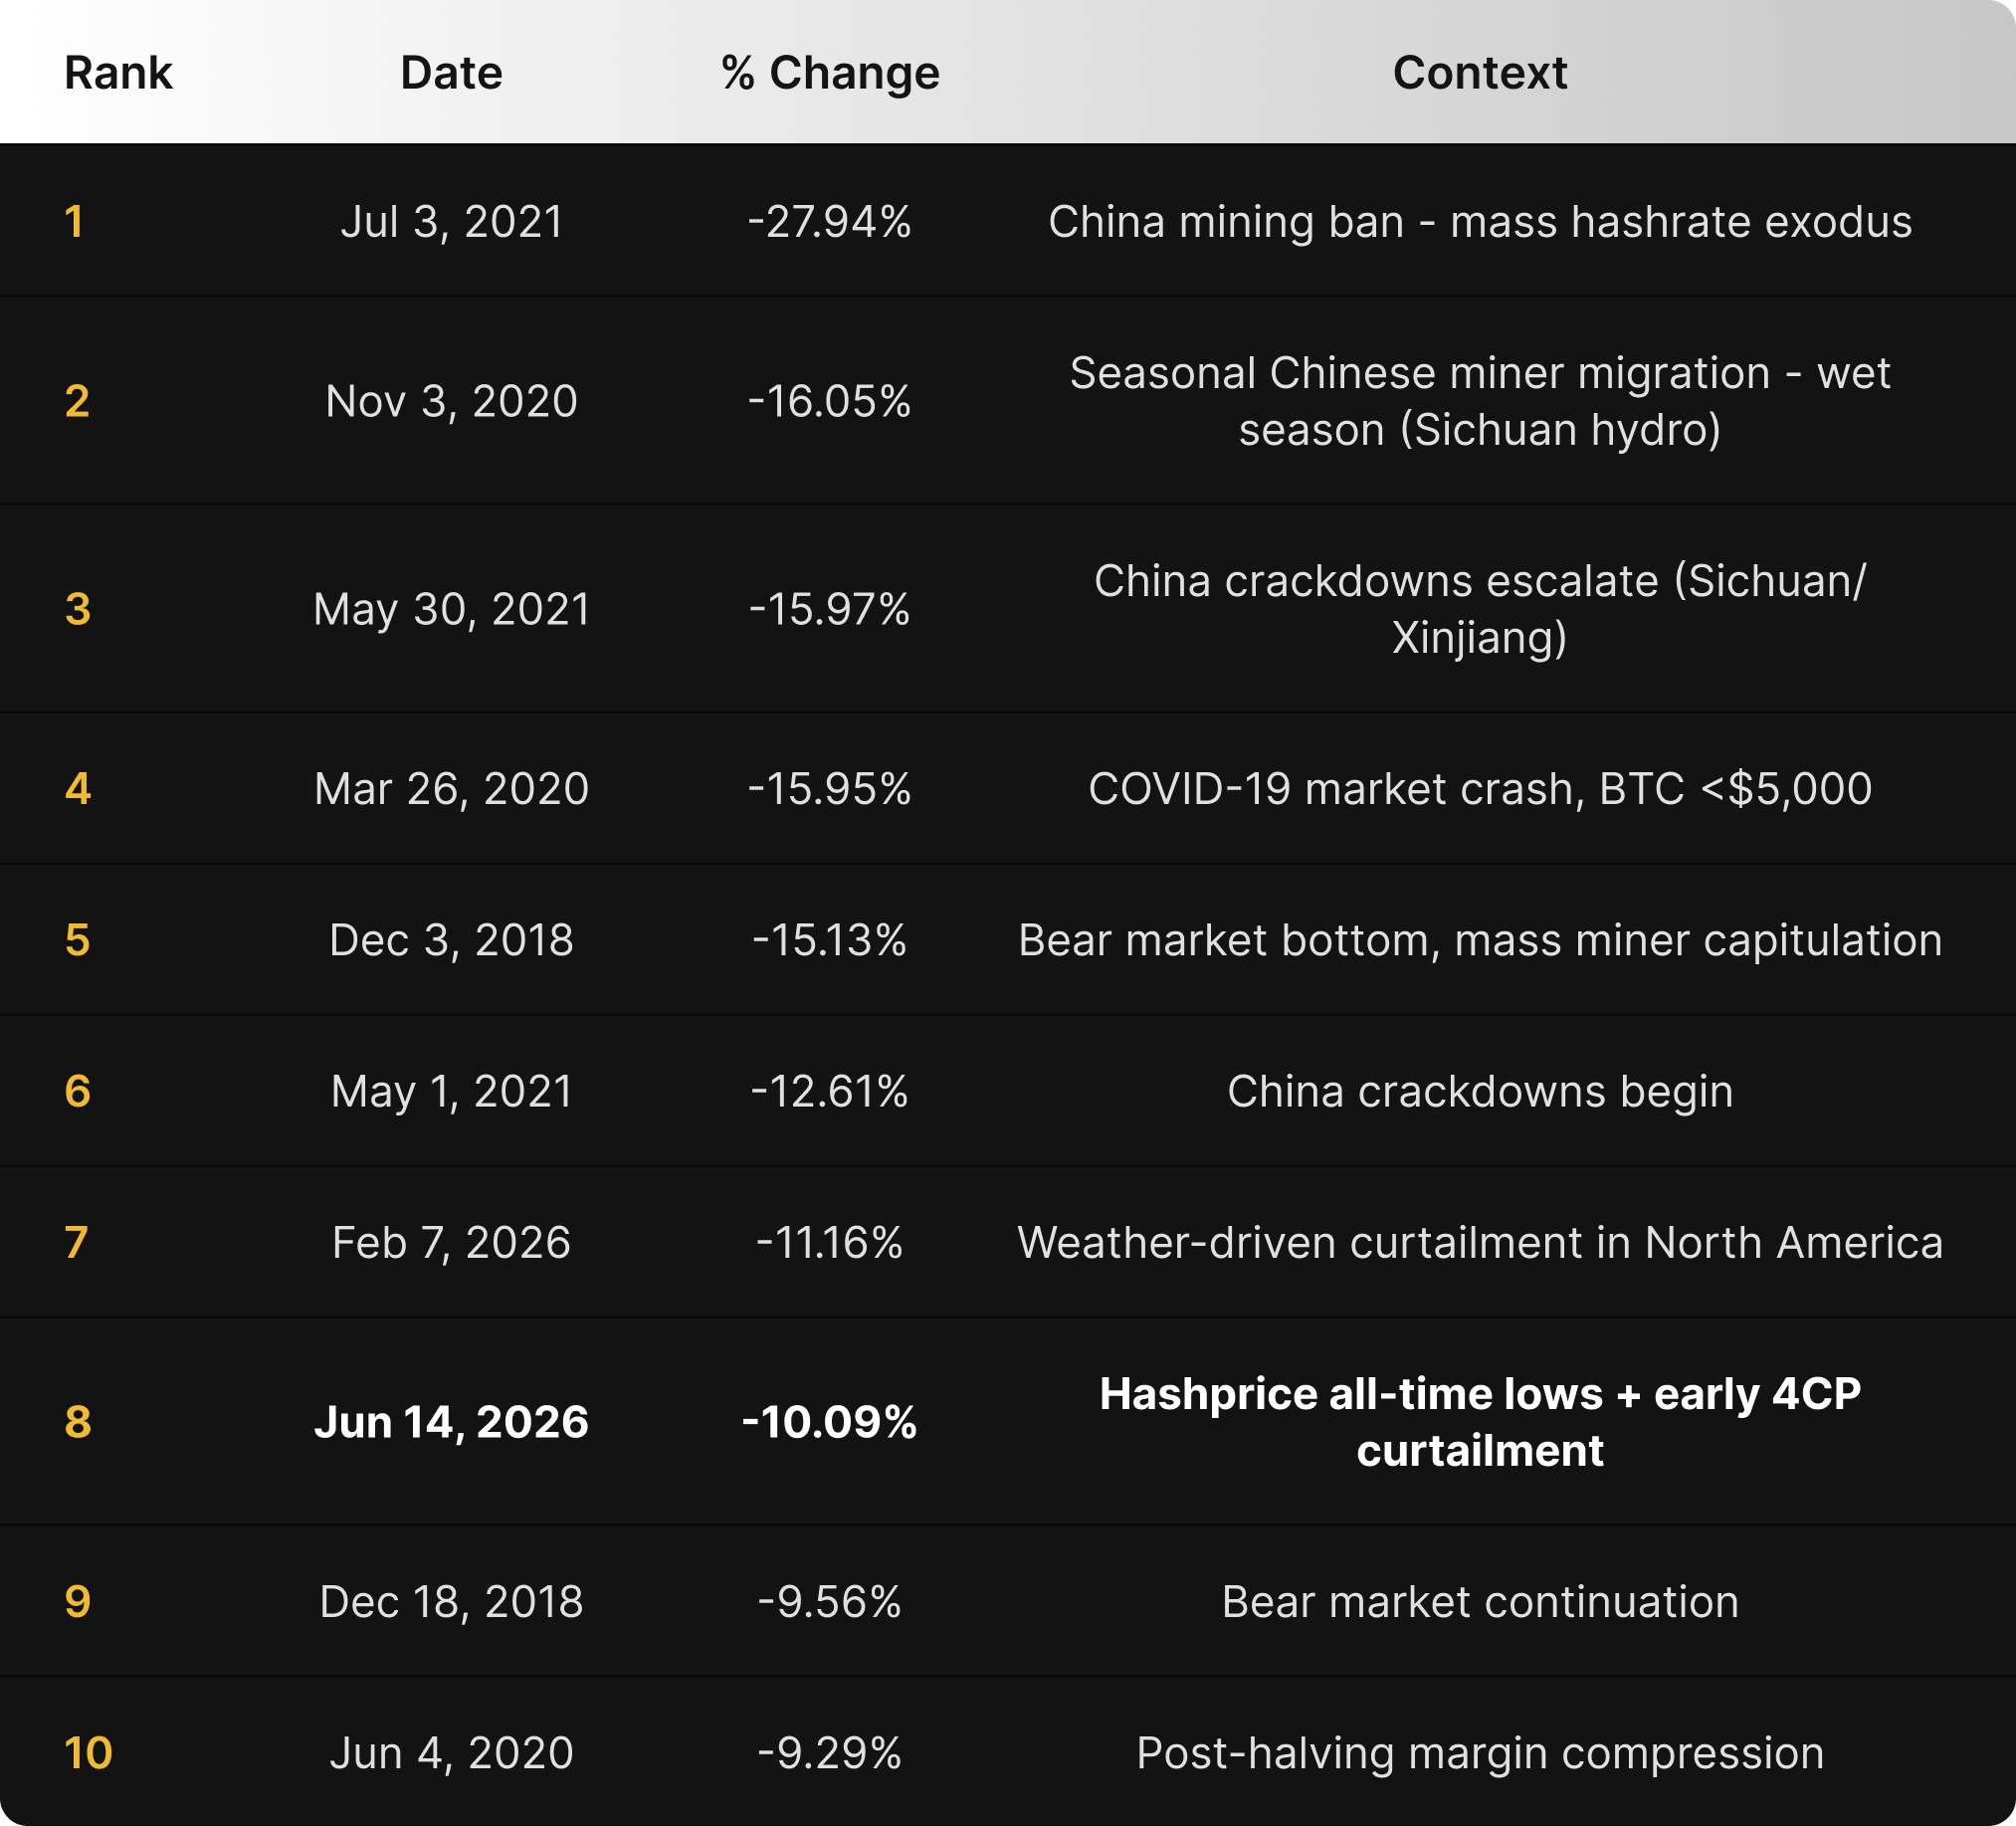
- Difficulty Whipsaw (8th-Largest ASIC-Era Drop): The June 14 adjustment dropped difficulty by -10.09% from 138.96T to 124.93T, the 8th-largest decrease of the modern ASIC era (since 2016), and the second-largest of 2026 behind February’s -11.16%. The trend was driven by early 4CP curtailment in ERCOT stacked on BTC-price-driven shutoffs at sub-$28 hashprice. The June 27 epoch snapped back +7.15% to 133.87T, recovering more than half the drop.
- BTC Breaks to Cycle Lows: BTC averaged $63,238 in June (-19.0%) and closed at $59,005. This close marks a ~53% drawdown from the ~$126,000 October 2025 peak, matching the 2021 cycle’s -53% mid-cycle correction.
- USD Sellers Win 3 of 5, BTC Buyers Sweep Again: The June 2026 USD contract settled at $30.37 per PH/s/day: sellers from January (+21.7%), May (+19.8%), and April (+10.1%) beat spot (FPPS), while hedges struck at the February–March lows lost -6.1% and -2.1%. BTC-denominated buyers won across the board for a second straight month, with sellers giving up 4.0% to 17.5% versus a 0.00048 BTC per PH/s/day settlement, the highest monthly average since August 2025.
- The 4CP Wager Paid: May’s front-end contango priced an early summer difficulty pullback, and June delivered it. During the month, USD forward contracts for July–November repriced -11.6% alongside BTC, while BTC-denominated contracts rose +5.7%. Front-end contango held into month-end, with November still at a discount to spot (FPPS).
June 2026 Spot Hashprice & Its Constituents
June 2026 was a capitulation month for Bitcoin mining markets. BTC price fell -19.0% on a monthly-average basis and only went lower after June 1, dragging USD hashprice to new all-time lows on both a daily and monthly-average basis. Difficulty responded with its second whipsaw of the year: -10.09% on June 14, +7.15% on June 27. This is a 17.2-point two-epoch swing, second in 2026 only to February’s ~26-point round trip.
USD Hashprice — New Lows on Every Measure
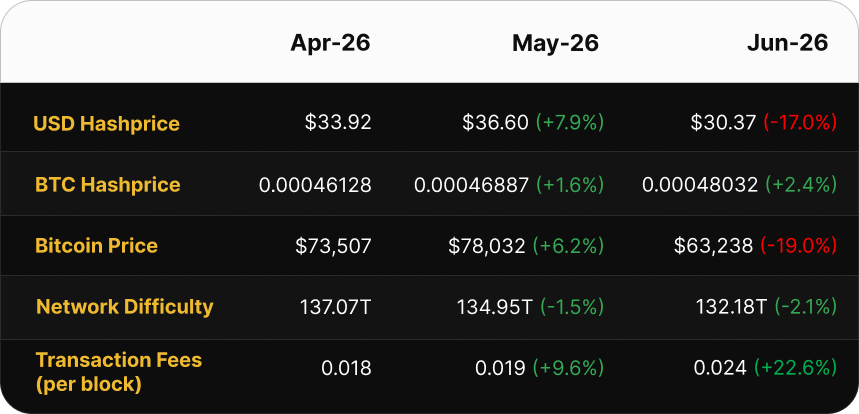
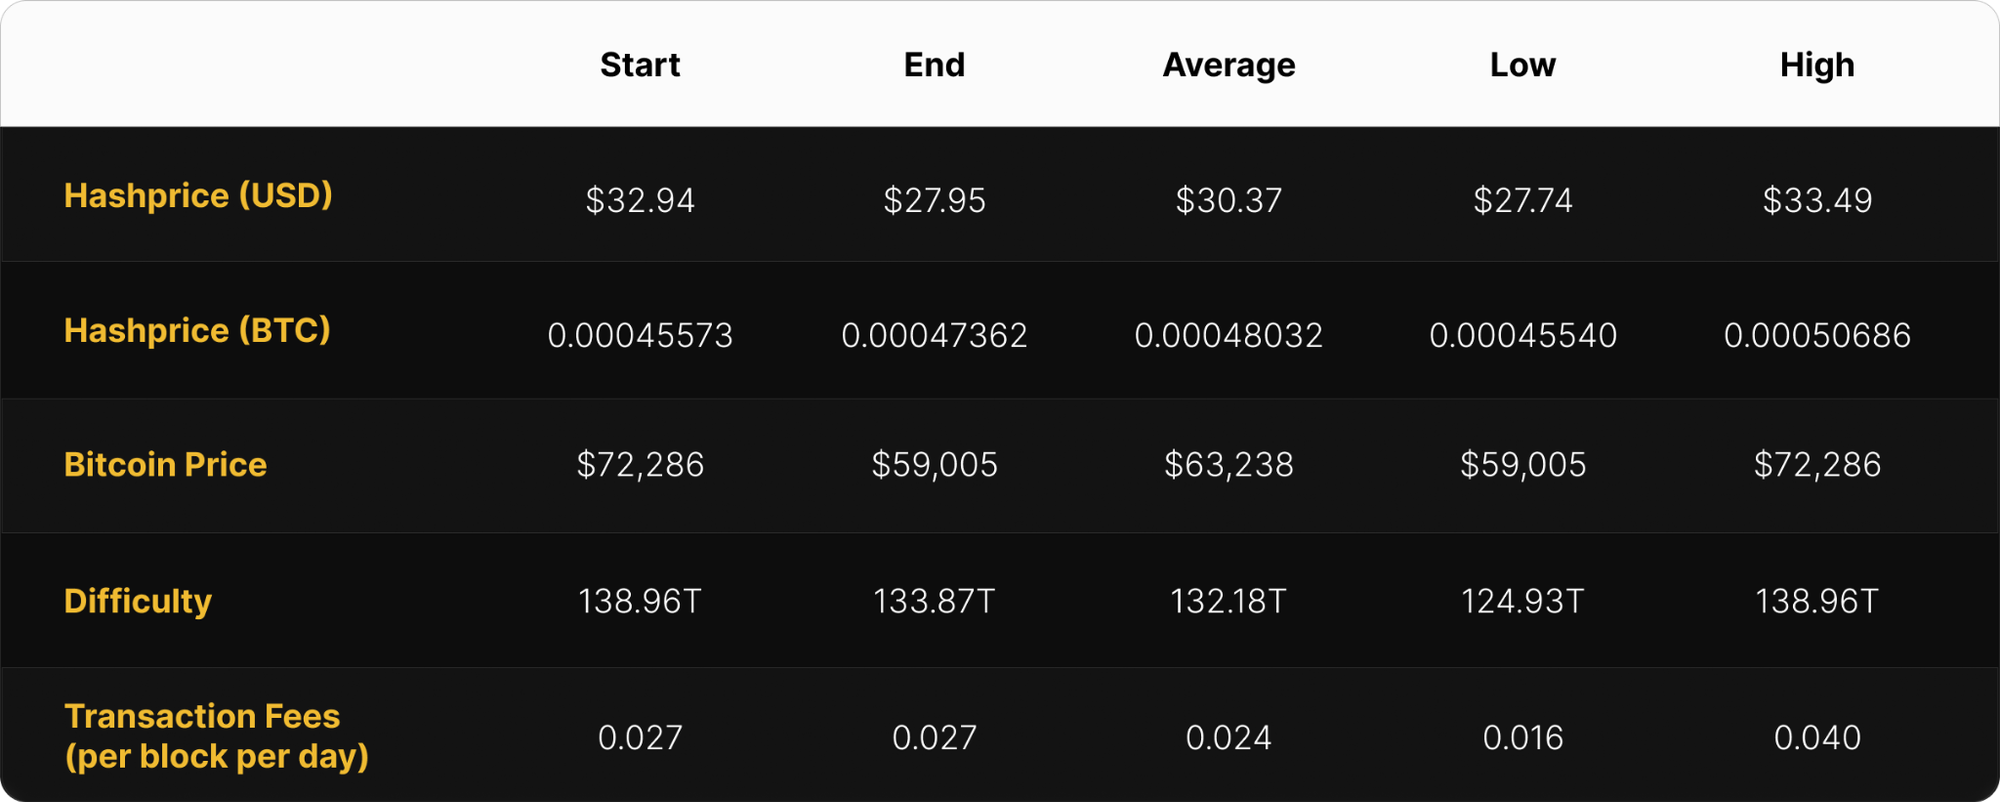
Monthly average USD hashprice fell -17.0%, from $36.60 to $30.37 per PH/s/day, a new record-low, below March 2026’s prior record of $31.27, and an end to two straight months of recovery.
The month bottomed early and never escaped. Hashprice opened June at $32.94, slid to $27.74 by June 6 (a new daily all-time low, undercutting February 24’s $27.89) as BTC broke down in the first week. The June 14 difficulty adjustment then lifted revenue per unit of hashrate: hashprice rebounded to a monthly high of $33.49 on June 15 and held a $31.84–$33.49 range through June 22. The back half unwound all of it. BTC’s slide to $59,005 and the +7.15% difficulty snapback on June 27 pushed hashprice to a $27.95 close on June 30 (-15.2% versus the open), $0.21 above the June 6 floor. Daily volatility ran 3.1% (σ of daily returns) with a -16.6% maximum intra-month drawdown.
BTC Price — Peaked on Day One, Bottomed on the Last
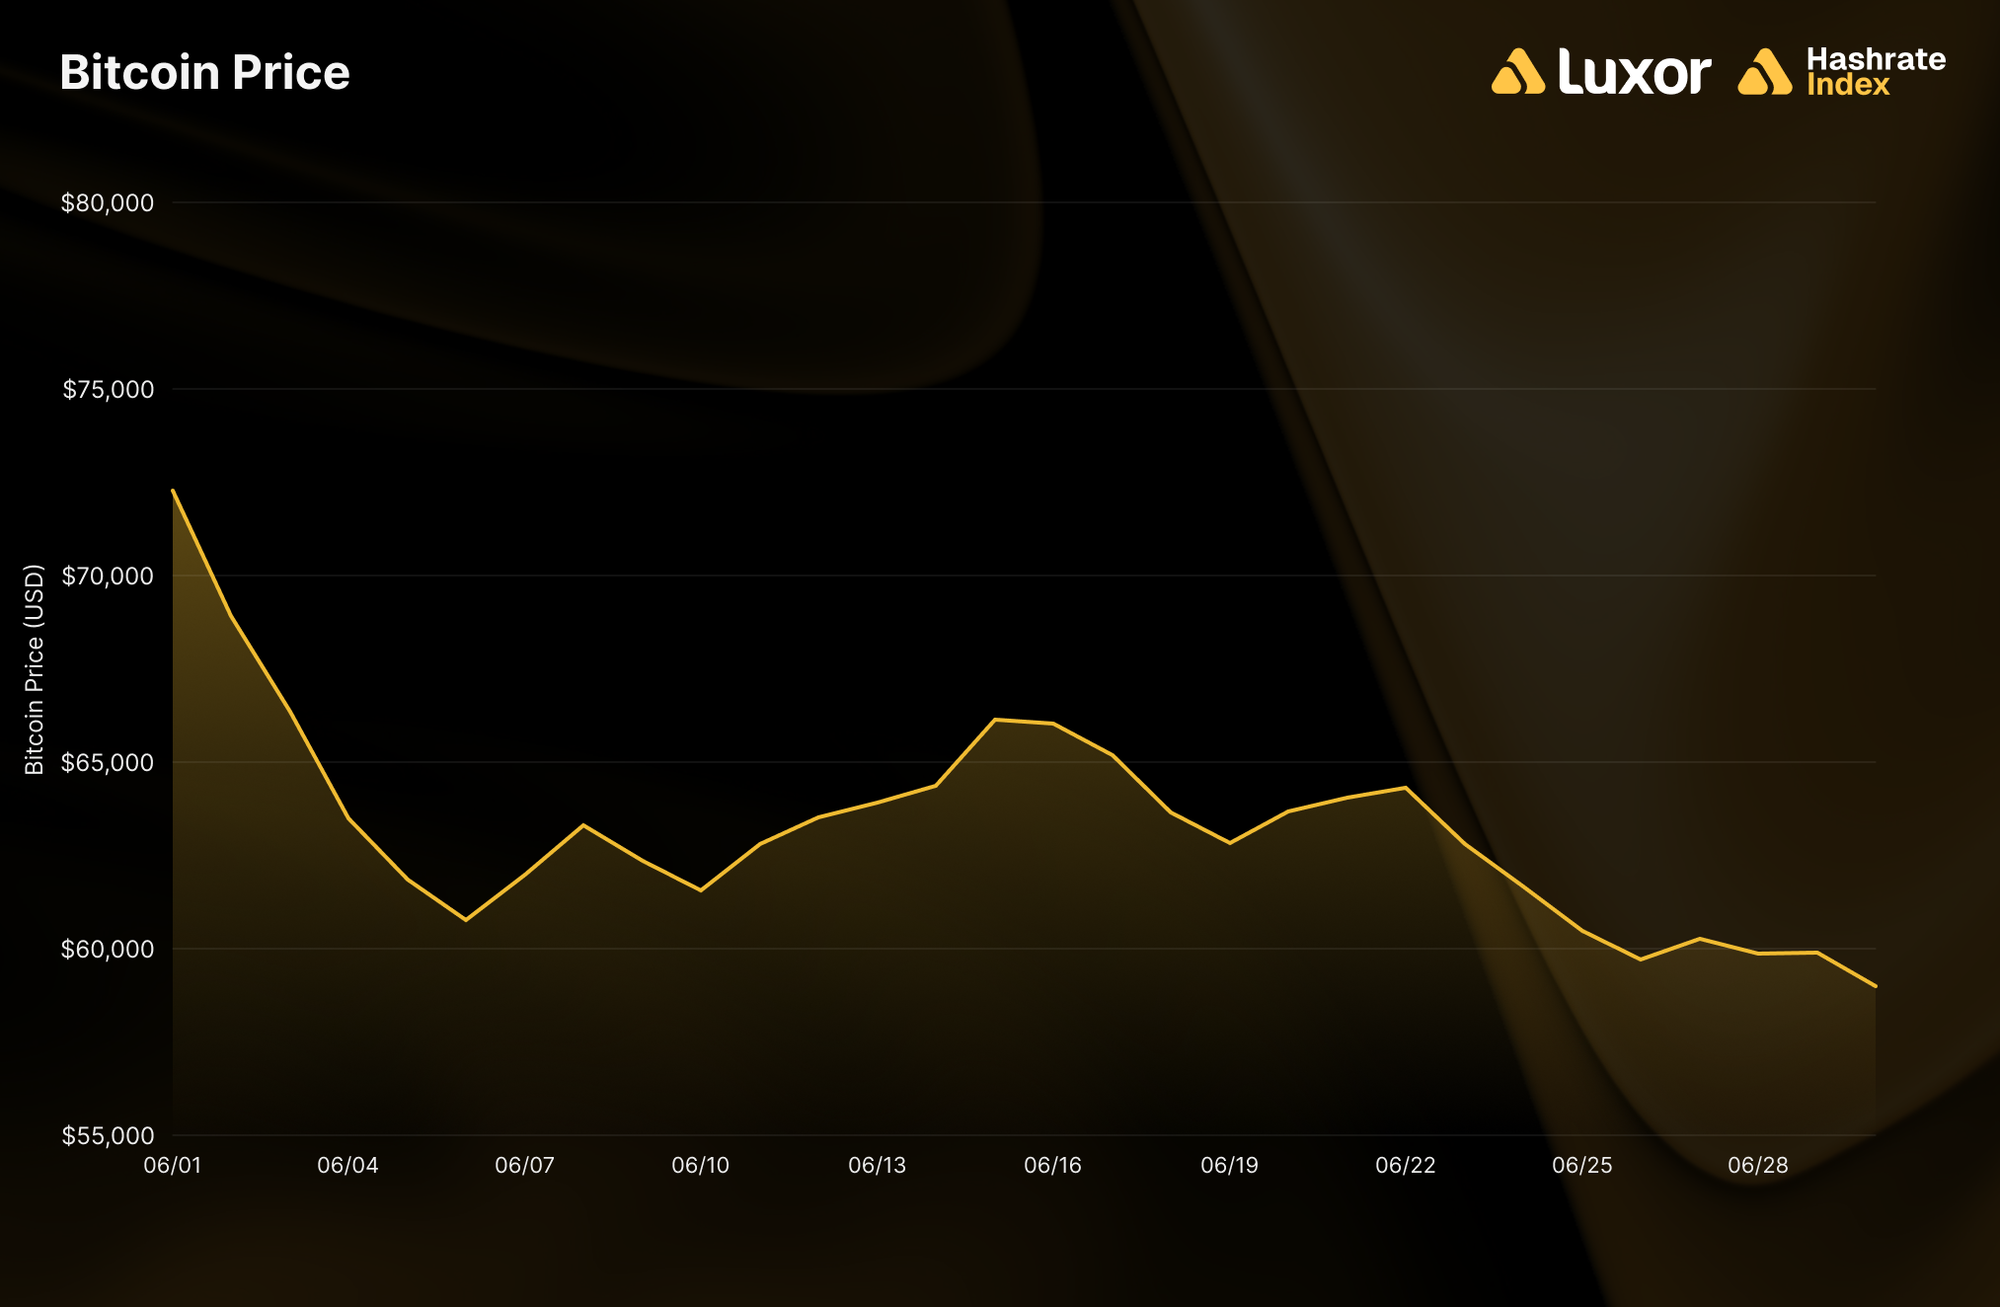
BTC averaged $63,238 in June, down -19.0% from May. It opened at $72,286 (the monthly high) and closed at $59,005, the monthly low, a -18.4% decline with no intra-month recovery that held. The shape: a -16% first-week break to $60,777 by June 6, a mid-month stabilization to $66,142 on June 15 as reports of progress toward a US–Iran deal circulated, then a second leg down through month-end as US spot Bitcoin ETFs recorded record monthly outflows (~$4.5B) during the drawdown.
The macro driver remained the Middle East. On June 1, Tehran broke off negotiations and moved to fully close the Strait of Hormuz, sending oil sharply higher and risk assets lower (the same shock that defined February’s drawdown). As covered in Hashrate Index’s Oil Shocks and the Bitcoin Network analysis, the crude-price channel matters little for ~90% of global hashrate; the transmission mechanism to mining runs through BTC price, and June was the proof.
The close at $59,005 puts BTC ~53% below its ~$126,000 October 2025 peak. This is the deepest drawdown of this cycle, surpassing February’s ~50% and matching the 2021 cycle’s -53% mid-cycle correction. We return to the cycle context in the concluding section.
Network Difficulty — The 8th-Largest ASIC-Era Drop, Whipsaw Back Up
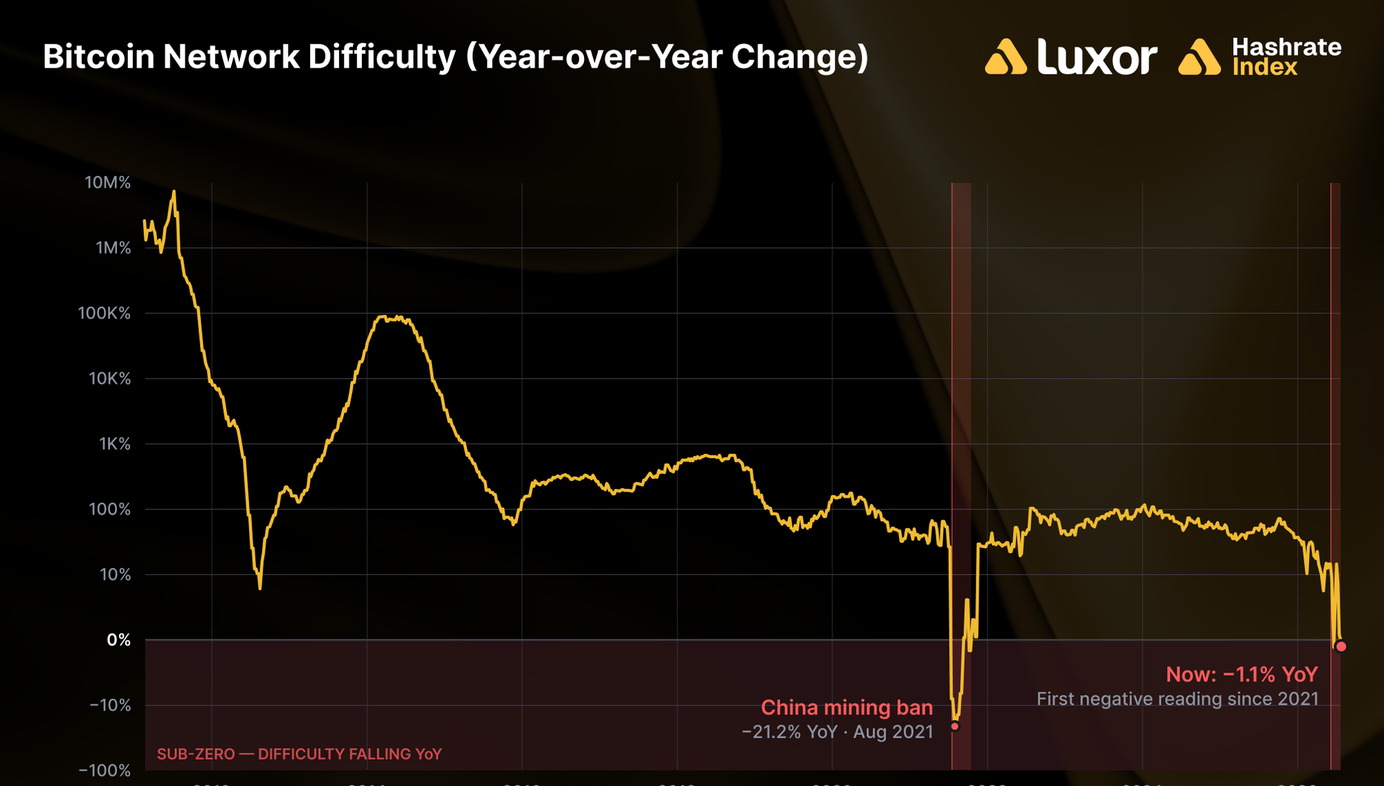
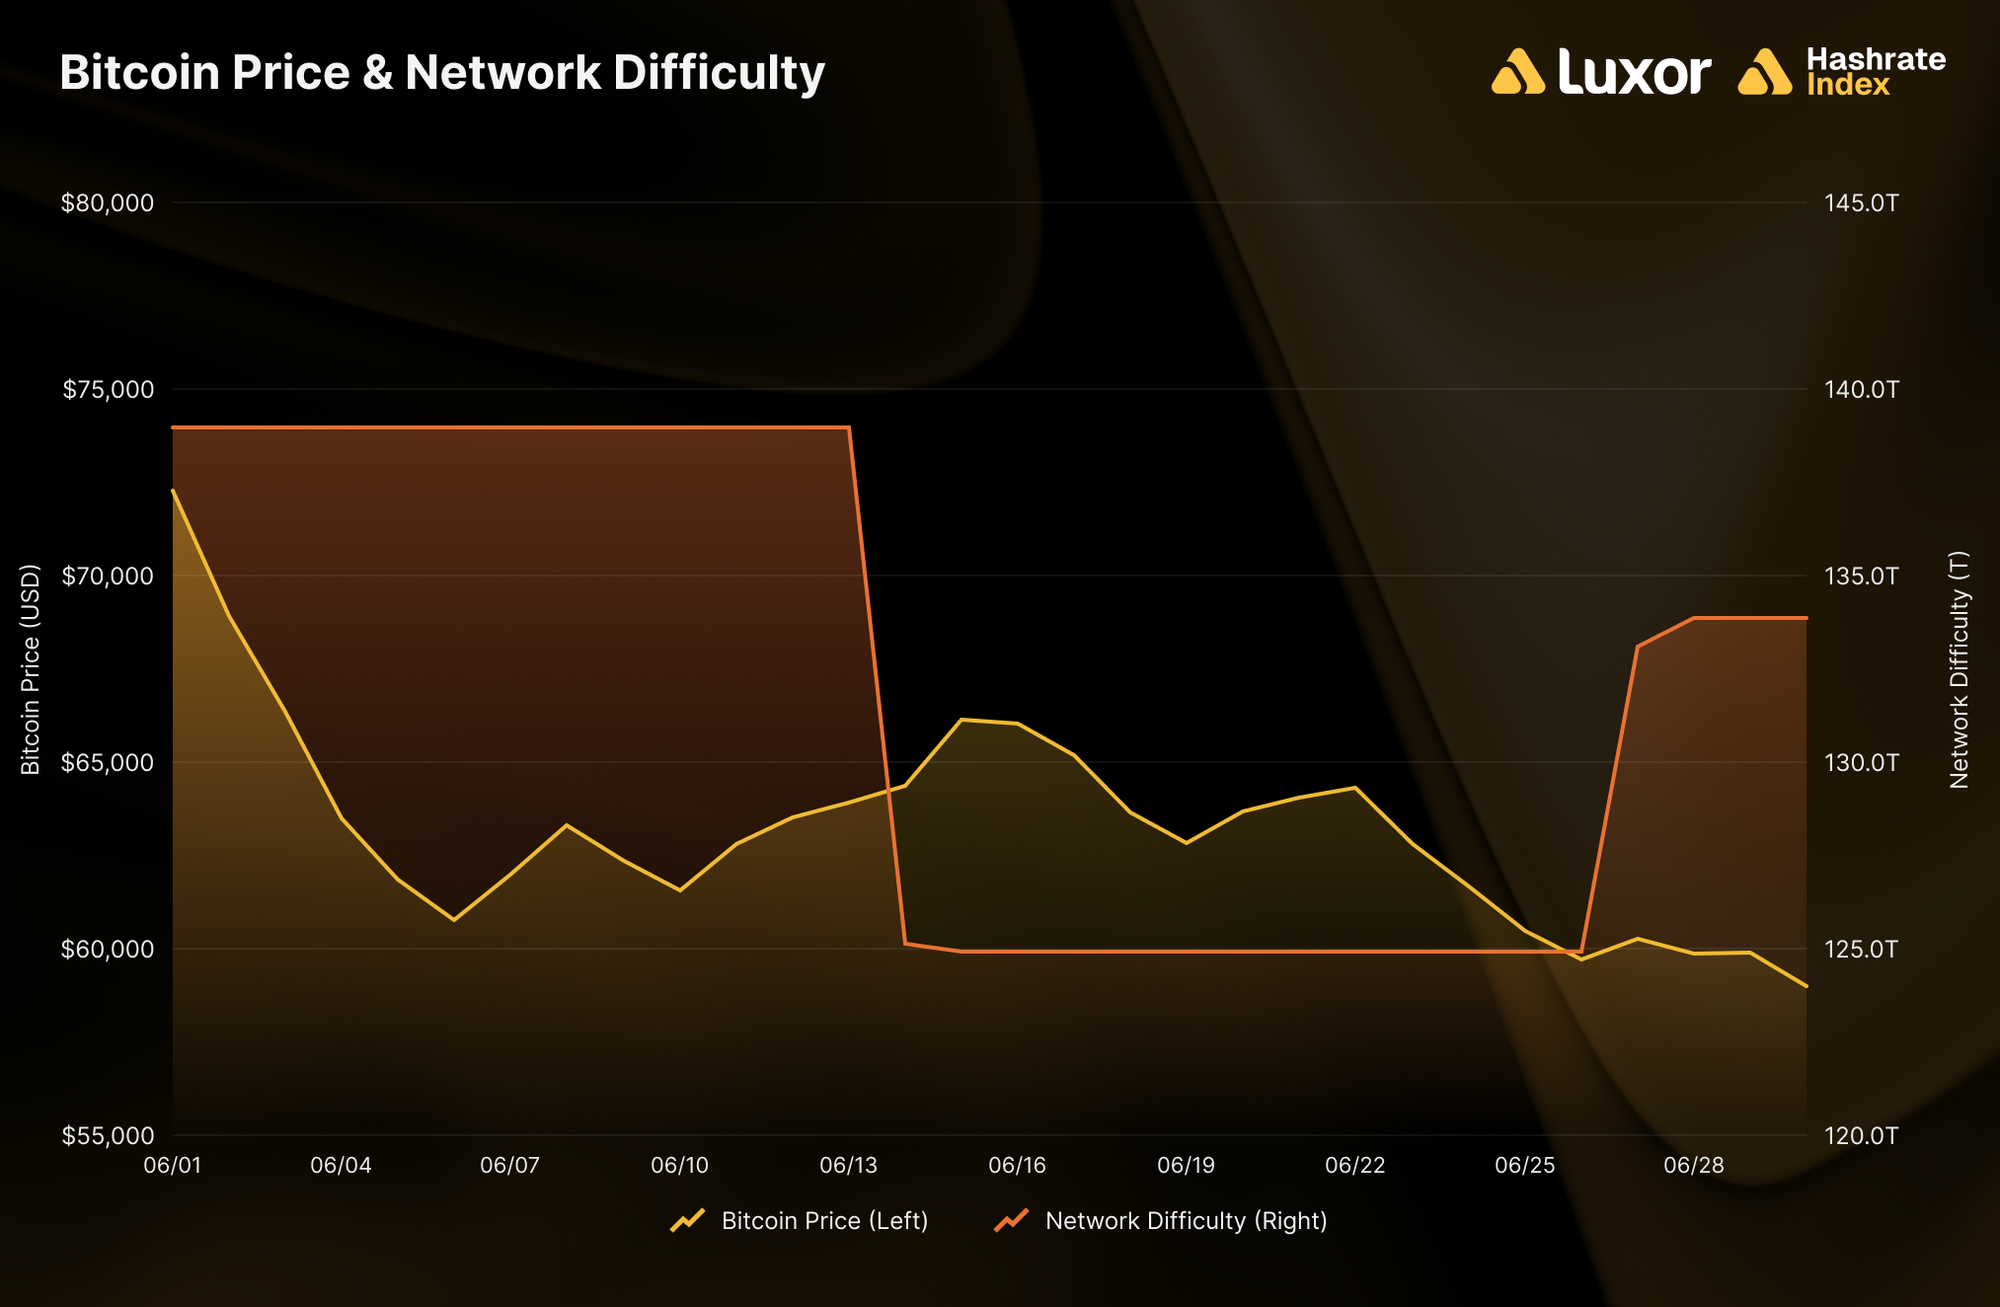
Difficulty averaged 132.18T in June, down -2.1% from May. The average hides the sharpest two-epoch swing since February’s (-11.16% | +14.73%). Two adjustments landed:
- June 14: -10.09%, from 138.96T to 124.93T at block 953,568 — the 8th-largest difficulty decrease in the modern ASIC era (since 2016), the second-largest of 2026 behind February 7’s -11.16% (itself the 7th-largest on record), and difficulty’s lowest absolute level since early July 2025. The epoch’s 2,016 blocks took ~15.6 days to complete against the 14-day target, as network hashrate fell from ~995 EH/s at the start of June toward ~894 EH/s. Two factors stacked: sub-$28 hashprice forcing off older-generation and higher-power-cost fleets, and early 4CP curtailment in ERCOT.
- June 27: +7.15%, from 124.93T to 133.87T (~958 EH/s) — recovering more than half the June 14 drop, even with spot hashprice back below $31. The speed of the snapback is telling: a meaningful share of the mid-June exit was temporary curtailment and marginal miner shutoffs responding to the post-adjustment ~11% jump in BTC-denominated revenue per unit of hashrate, rather than permanent capitulation.
4CP is better understood as a moving target than a single curtailment event. ERCOT allocates transmission costs using each customer’s demand during the highest systemwide 15-minute interval in each month from June through September. Because the winning interval is known only after month-end, miners may curtail across several candidate-peak days—not just the interval that ultimately sets the month’s peak.
The timing of that peak shapes the hashrate impact. If a high bar is set early and later forecasts are unlikely to exceed it, miners can operate more normally for the rest of the month. If successive heat waves keep pushing system load to new highs, miners must keep chasing the peak, extending curtailment across more days and potentially more of a difficulty epoch.
That distinction helps interpret June’s difficulty whipsaw. The rapid rebound is consistent with temporary 4CP curtailment, while persistently weak hashprice points to a second layer of economic shutdowns.
Overall, difficulty fell -3.7% from 138.96T to 133.87T over the month, and ended June ~14% below the 155.97T November 2025 peak. June has now printed a negative mean adjustment for a fifth consecutive year (-0.53%, -0.54%, -0.42%, and -3.96% in 2022–2025), and -1.47% averaged across 2026’s two adjustments (versus -1.36%, the average across every June epoch from 2022–2025). This is an on-chain 4CP signature we flagged last month.
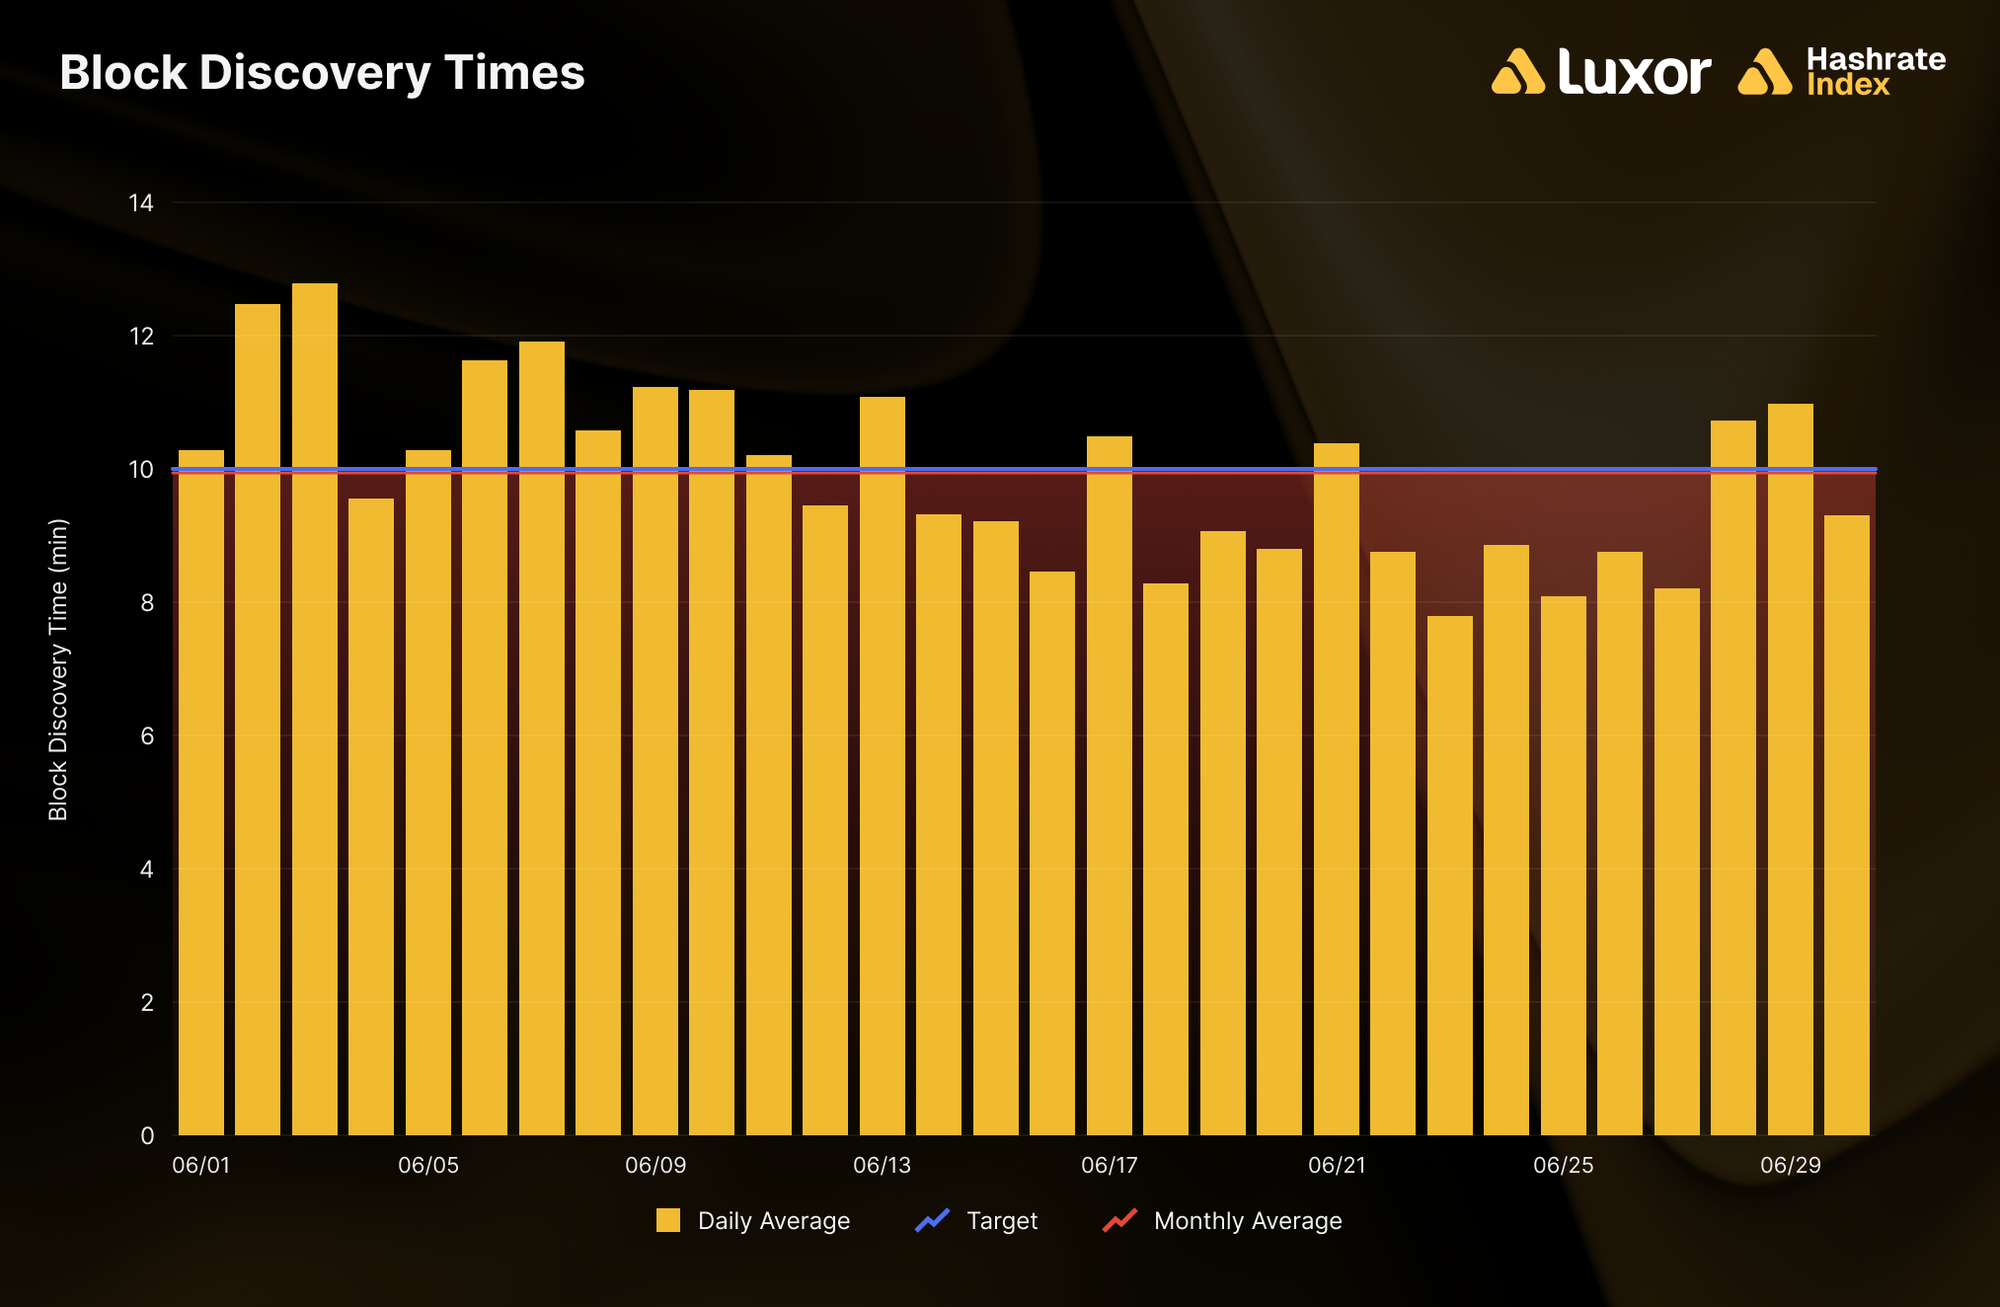
Blocks ran slow, then fast, averaging out to 9 minutes 57 seconds per block (+6.0% versus May’s 9m24s), split evenly with 15 of 30 days above the 10-minute target and 15 below. The slowest day, June 2 (12m49s), came at peak pre-adjustment stress; the fastest, June 23 (7m48s), landed in the post-adjustment window as returning marginal hashrate ran against a lower difficulty level.
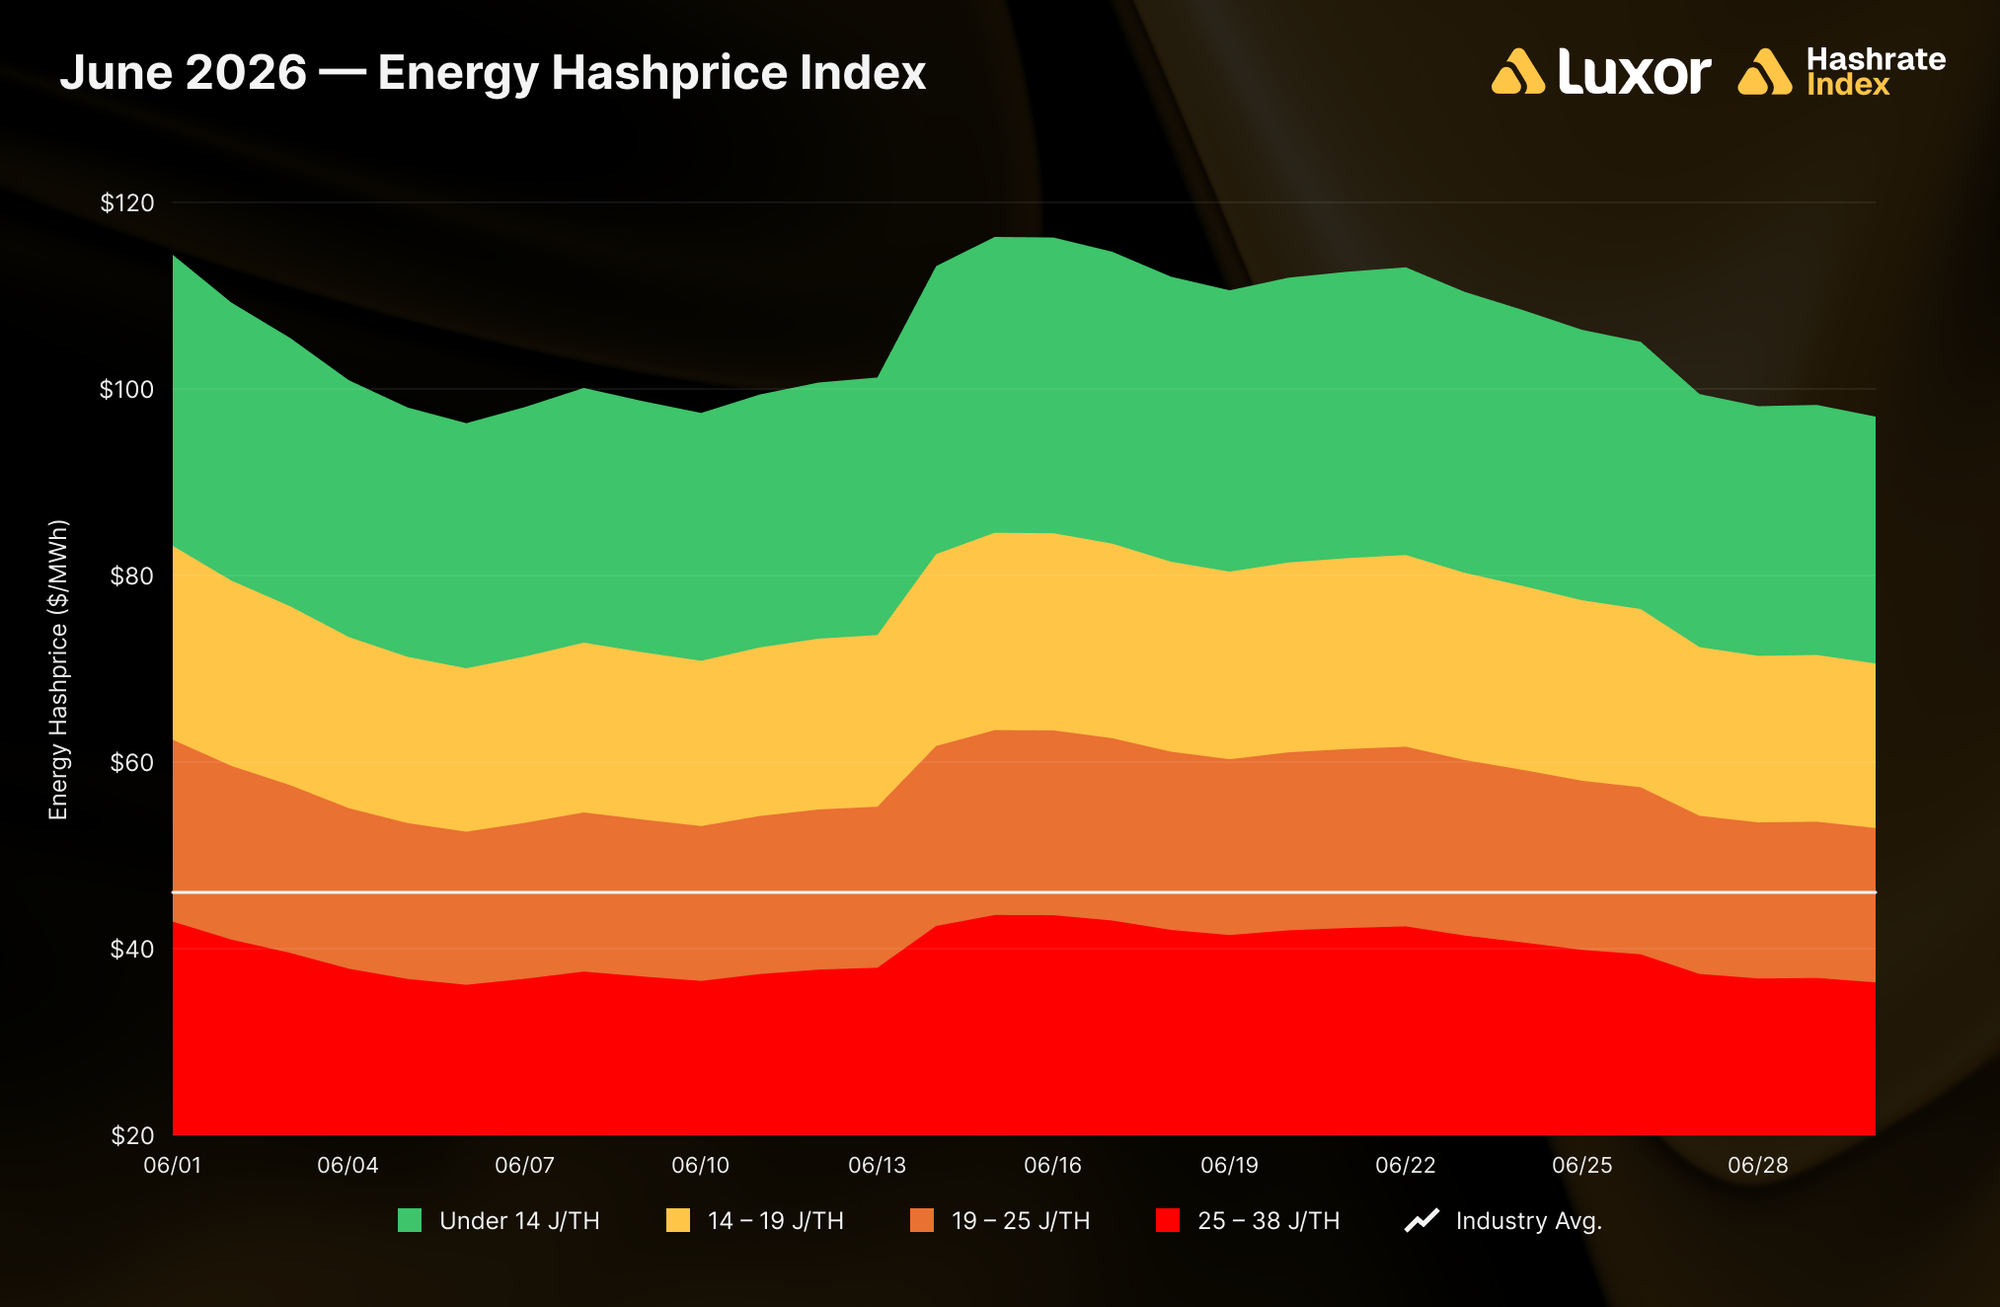
Mining revenue per unit of electricity consumed compressed with hashprice. Implied energy hashprice averaged ~$105/MWh for fleets under 14 J/TH, ~$77/MWh for 14–19 J/TH fleets, ~$58/MWh for 19–25 J/TH fleets, and ~$40/MWh for 25–38 J/TH fleets. Against an estimated network-average power cost of ~$46/MWh, the 25–38 J/TH tier fell back below breakeven, reversing May’s brief return to the surface and consistent with that tier supplying much of the hashrate that went dark into the June 14 adjustment.
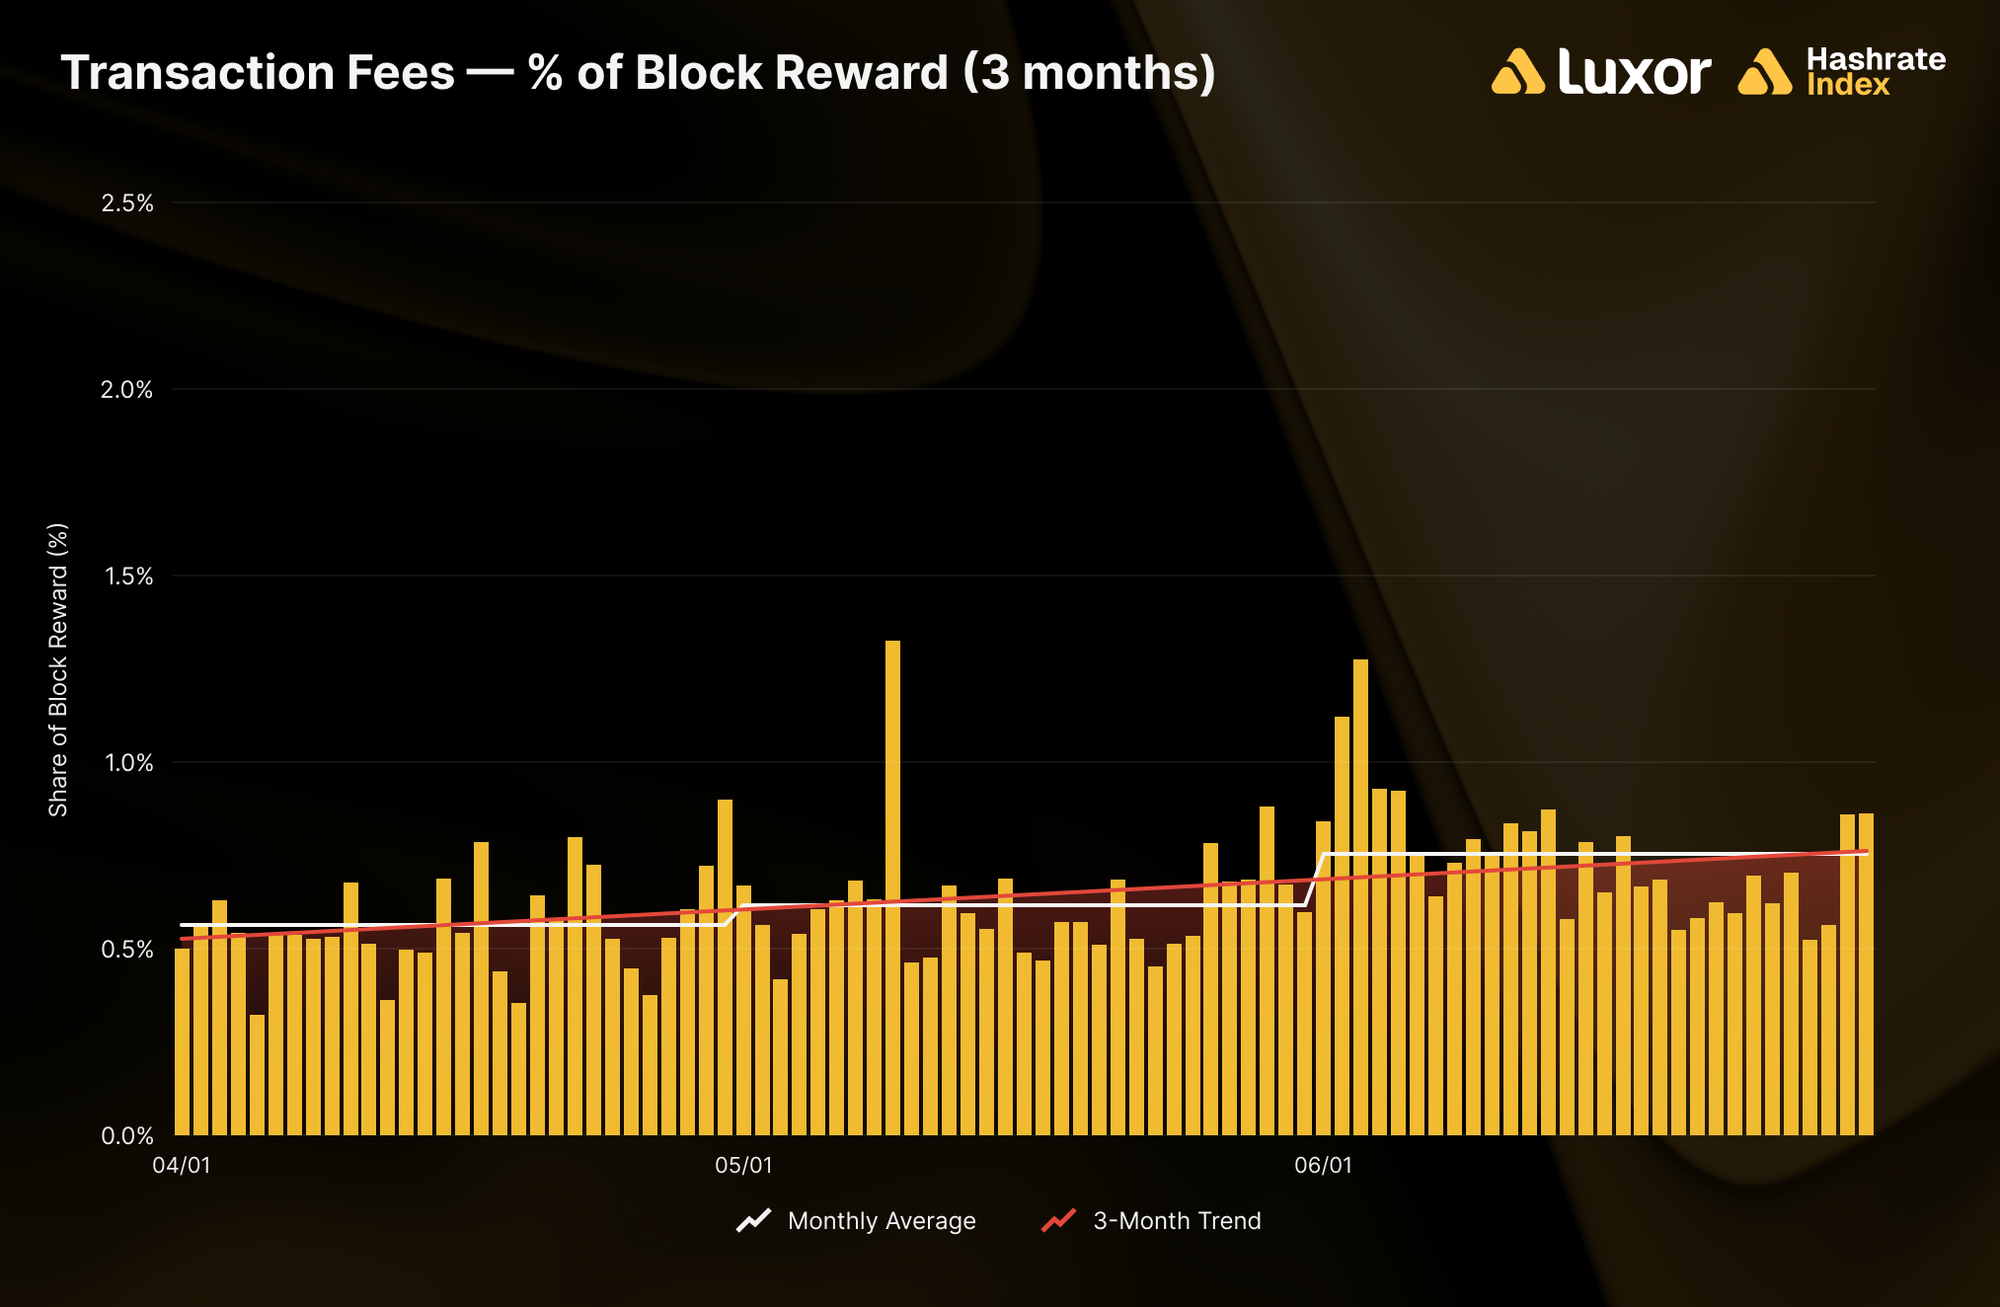
Transaction Fees — A 22.6% Jump That USD Terms Erased
Average fee collection rose +22.6% to 0.02382143 BTC per block in June, from 0.01942827 BTC in May, the largest monthly increase of 2026. This was driven by volatility-linked on-chain activity: the top fee days clustered on June 2–4 as the BTC selloff accelerated, peaking at 0.04035 BTC per block on June 3. Fees accounted for ~0.76% of total block rewards, up from ~0.62% in May but still under 1%, as they have been since July 2025. In USD terms the jump vanished: average fee revenue per block was ~$1,512 (-0.2%) versus ~$1,516 in May, the -19.0% BTC price decline fully offsetting the BTC-terms gain.
BTC Hashprice — Highest Monthly Average Since August 2025
Monthly average BTC hashprice rose +2.4%, from 0.00046887 to 0.00048032 BTC per PH/s/day, its highest since August 2025 (0.00049107), and the mirror image of the USD series’ record low. Both network parameter constituents positively pushed hashprice: average difficulty fell -2.1% and fees rose +22.6%.
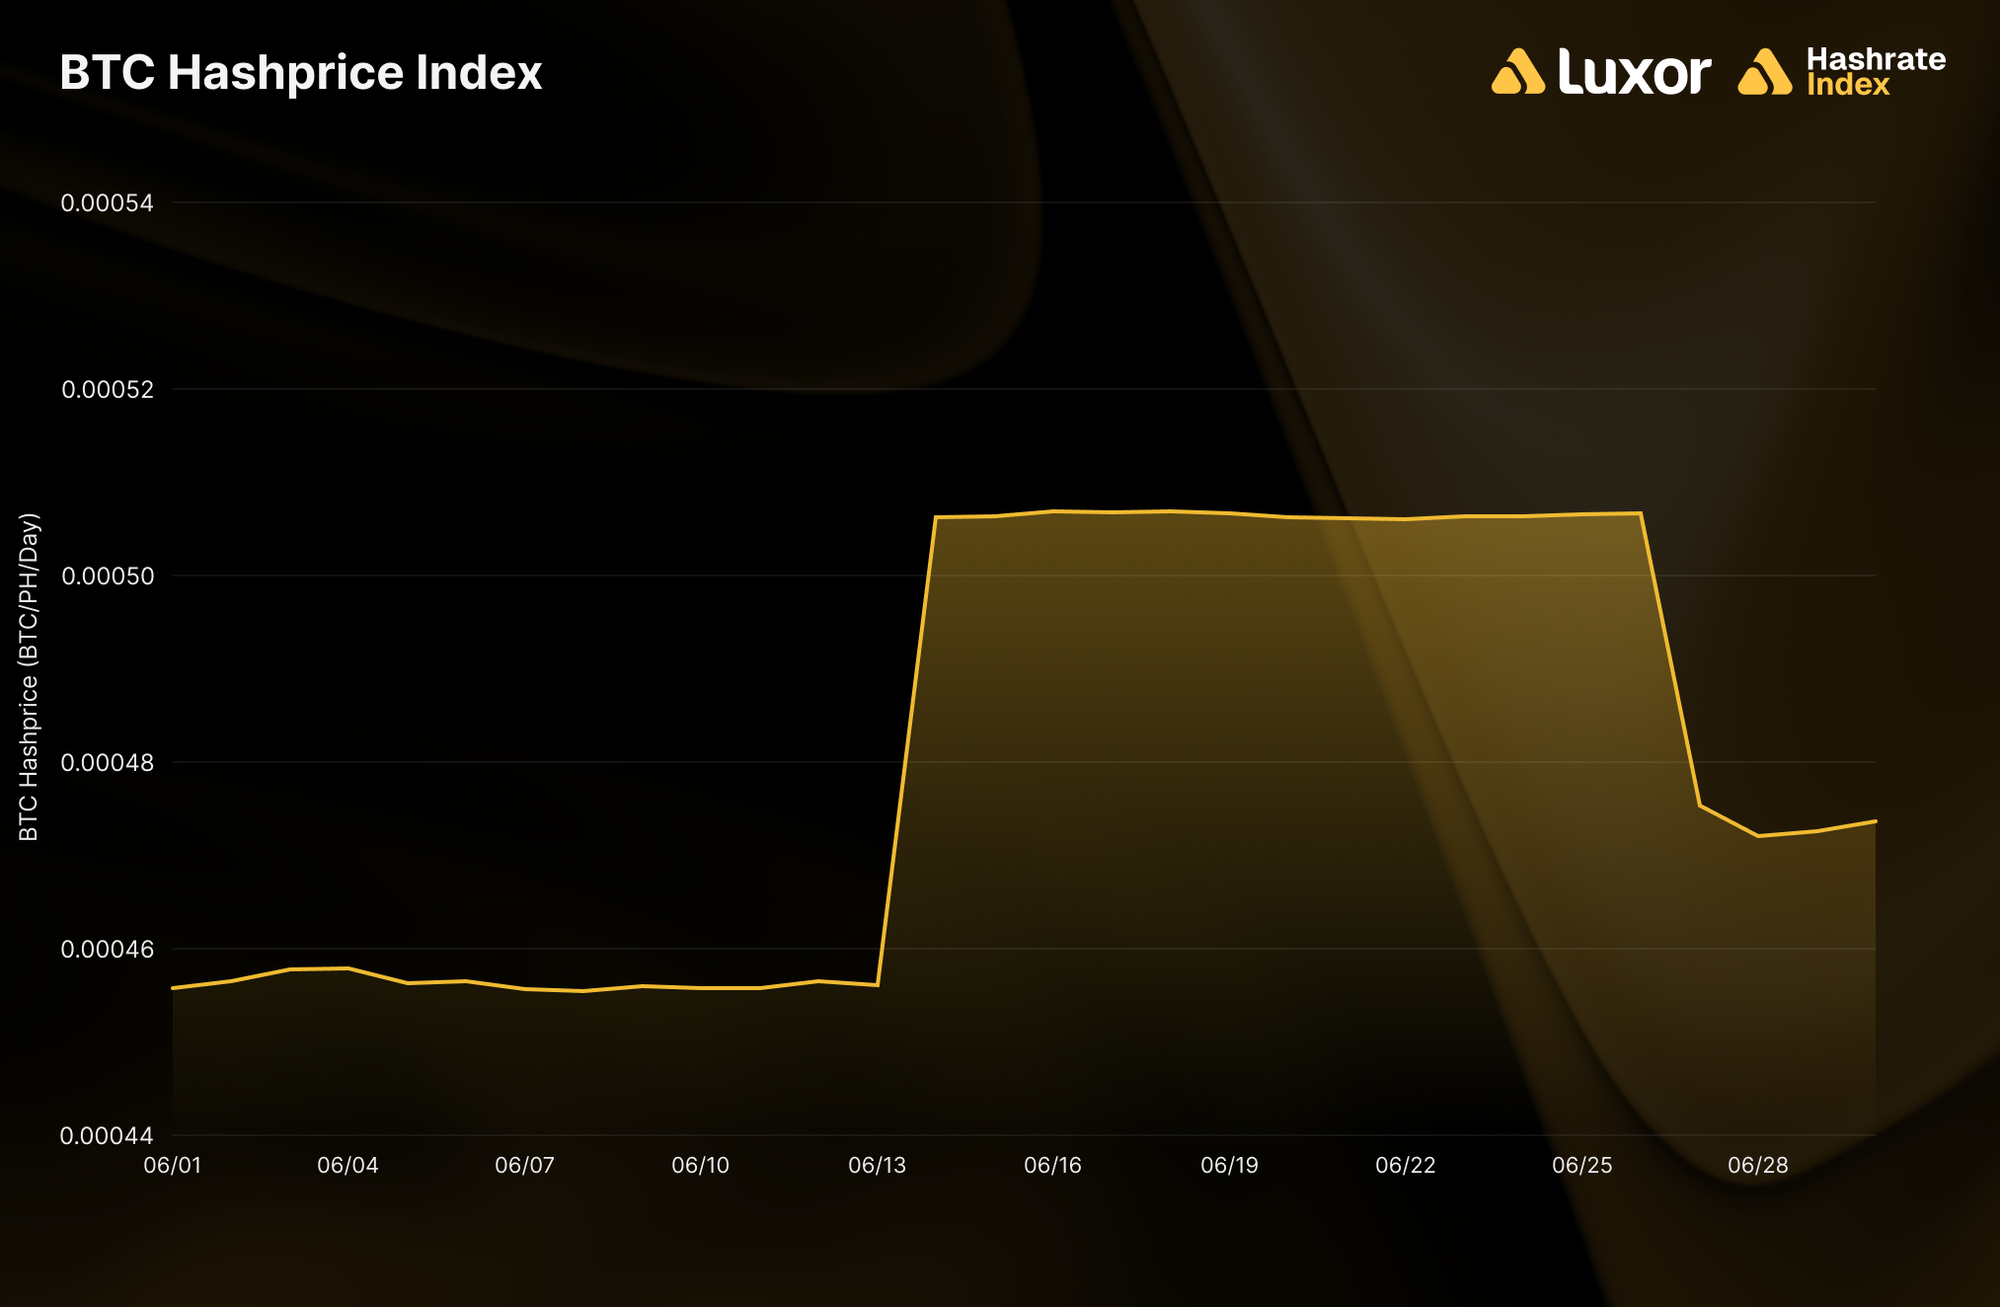
Intra-month, BTC hashprice traced difficulty. It opened at 0.000456, jumped ~11% to 0.000506 at the June 14 adjustment, held that plateau through June 26 (high of 0.000507 on June 16), then gave back roughly two-thirds of the jump at the June 27 repricing, closing at 0.000474 (+3.9% versus the open).
June 2026 Hashrate Market Activity
Our analysis of the June 2026 hashrate market focuses on two key points: how the June 2026 hashrate contract traded in previous months and how the forward curve shifted in June, based on pricing for forward hashrate during the month.
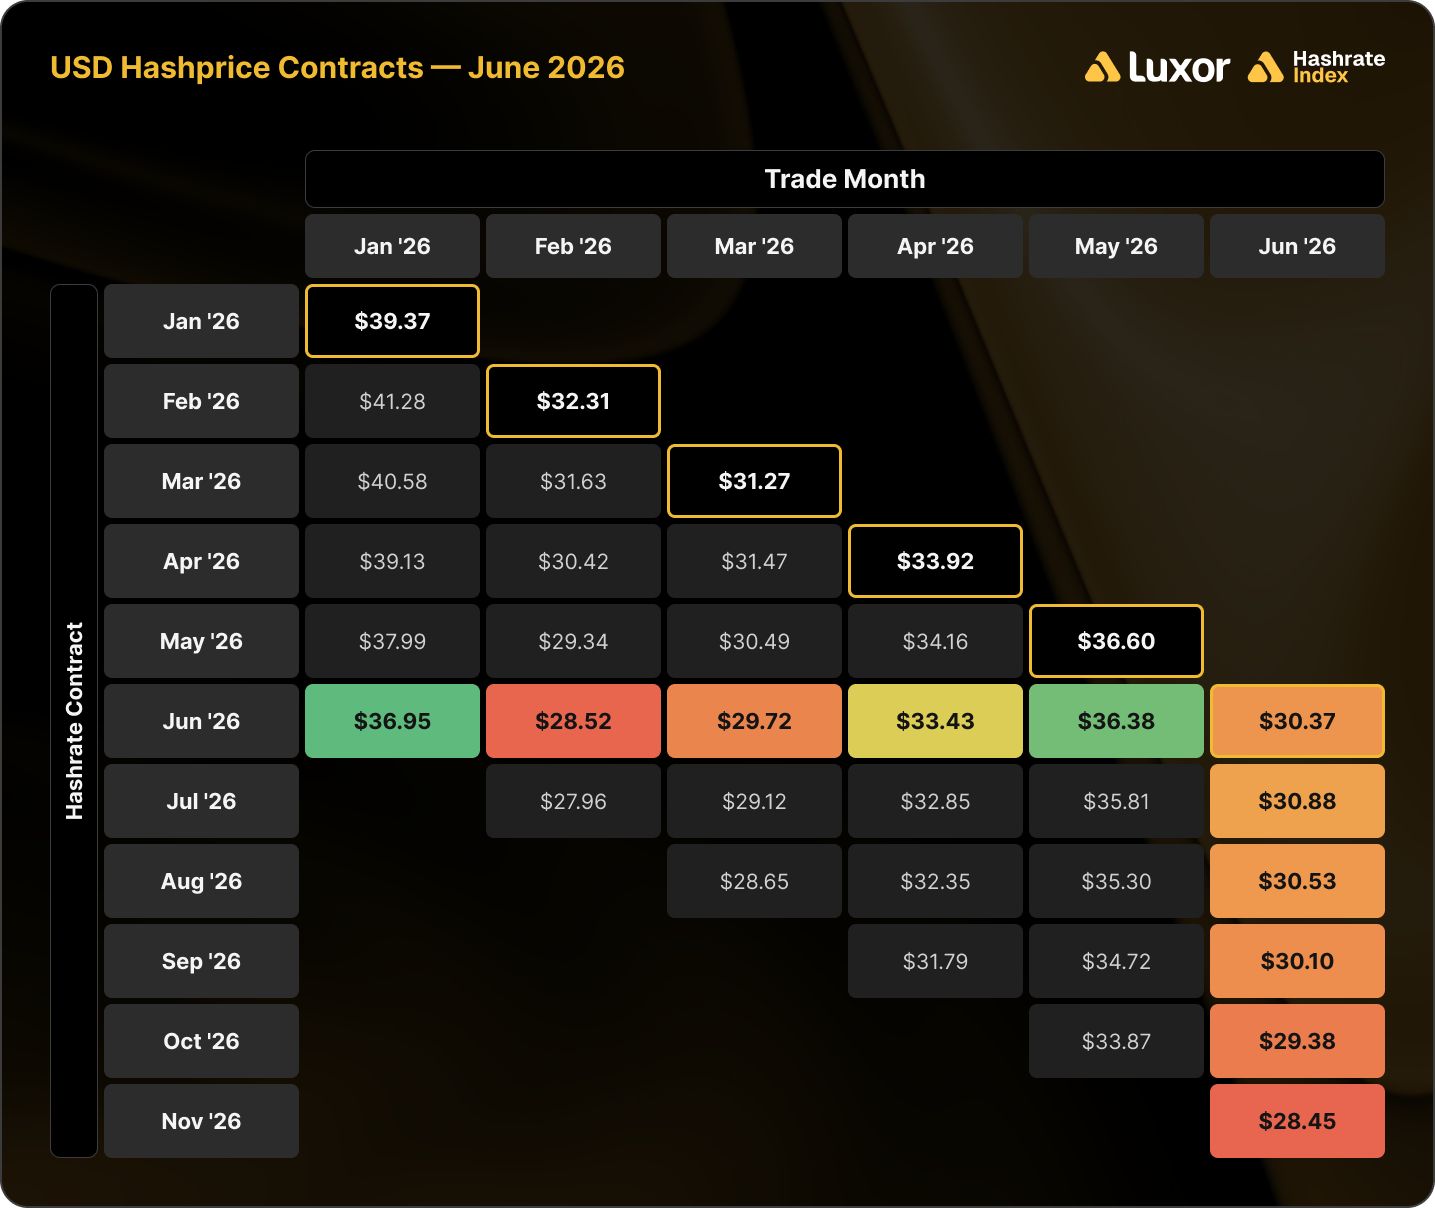
The two tables below show the evolution of Luxor’s USD and BTC-denominated hashrate forward markets from January 2026–June 2026. Rows represent specific monthly contracts, while columns represent each trading month. Cell values indicate the average monthly mid-market hashprice — except for the bold highlighted main diagonal — which shows actual spot hashprice settlement in each month.
This table summarizes both the trading history of the June 2026 USD-denominated contract (colored row) and the forward curve in June (colored column).
This table summarizes both the trading history of the June 2026 BTC-denominated contract (colored row) and the forward curve in June (colored column).
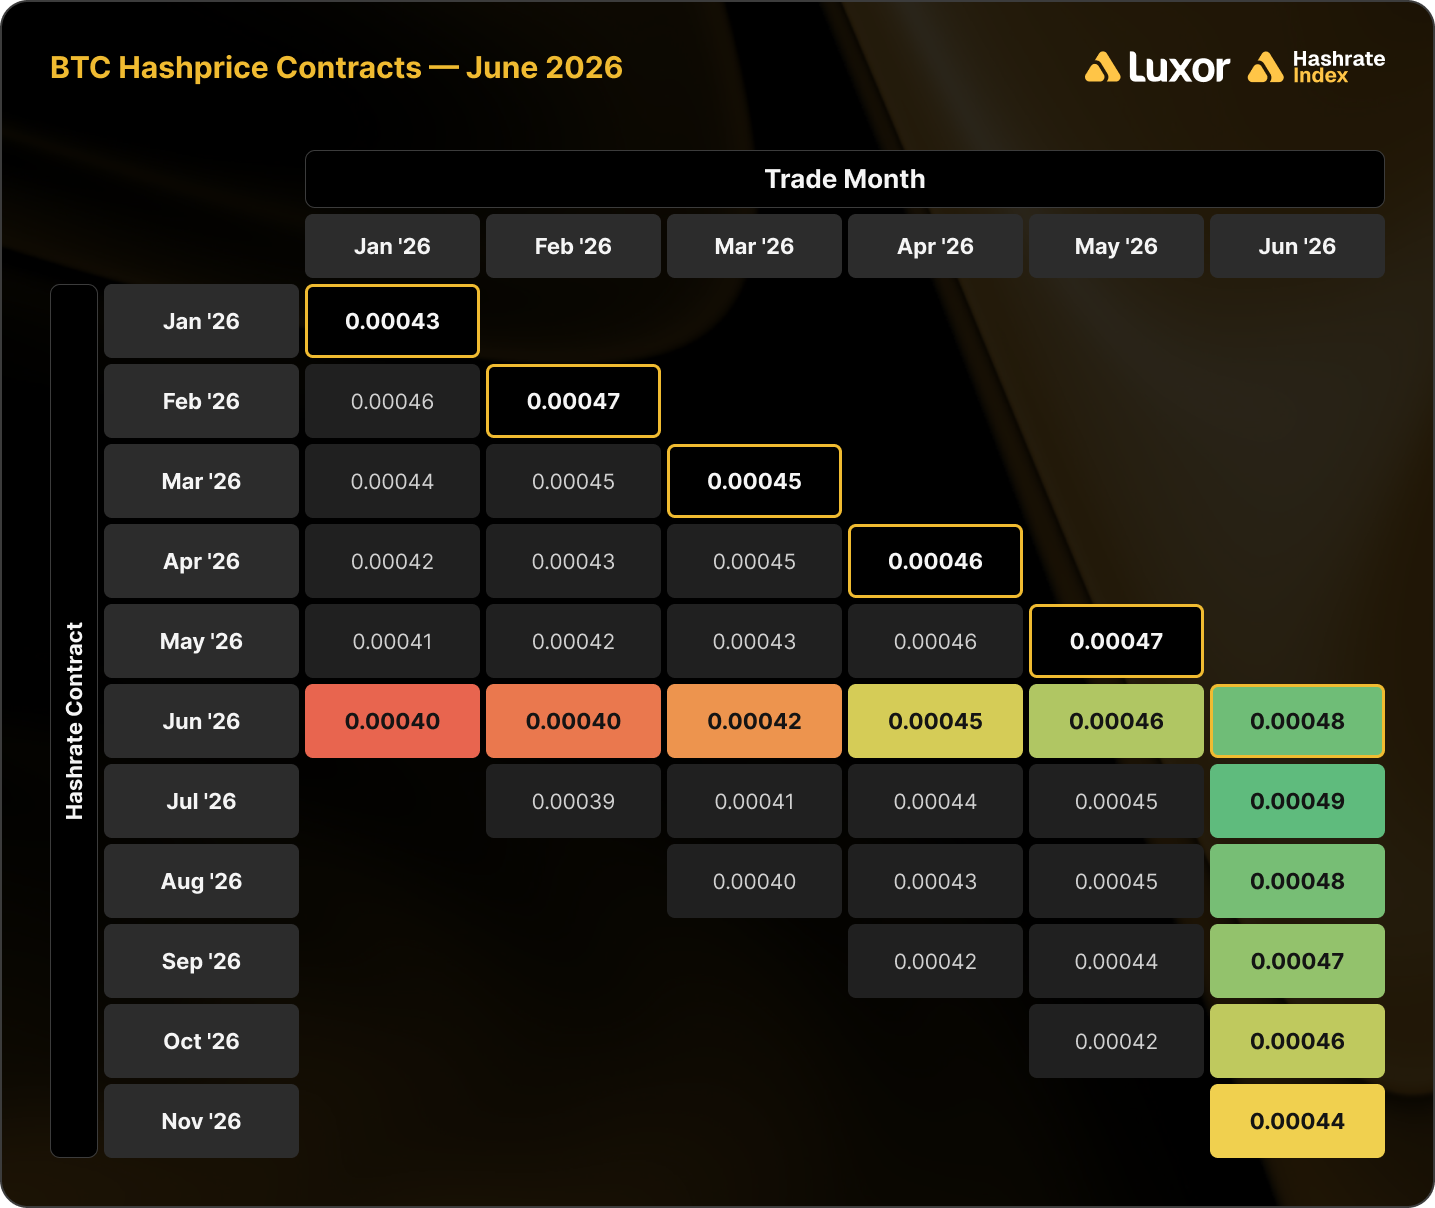
Note: all values (except for the bold highlighted main diagonal) shown in figures represent mid-market rates, the midpoint of the best bid and ask on Luxor's Non-Deliverable Hashrate Forward market. The bold highlighted main diagonal shows actual spot hashprice settlement in each month, measured by Luxor’s Bitcoin Hashprice Index.
The table below shows the type of market participants on the buy and sell side of Luxor’s deliverable (DF) and non-deliverable hashrate forward (NDF) market. In June, lenders were active on the buy side of the DF market, while public and private miners used the contract to sell forward, receive financing, and expand their fleet.
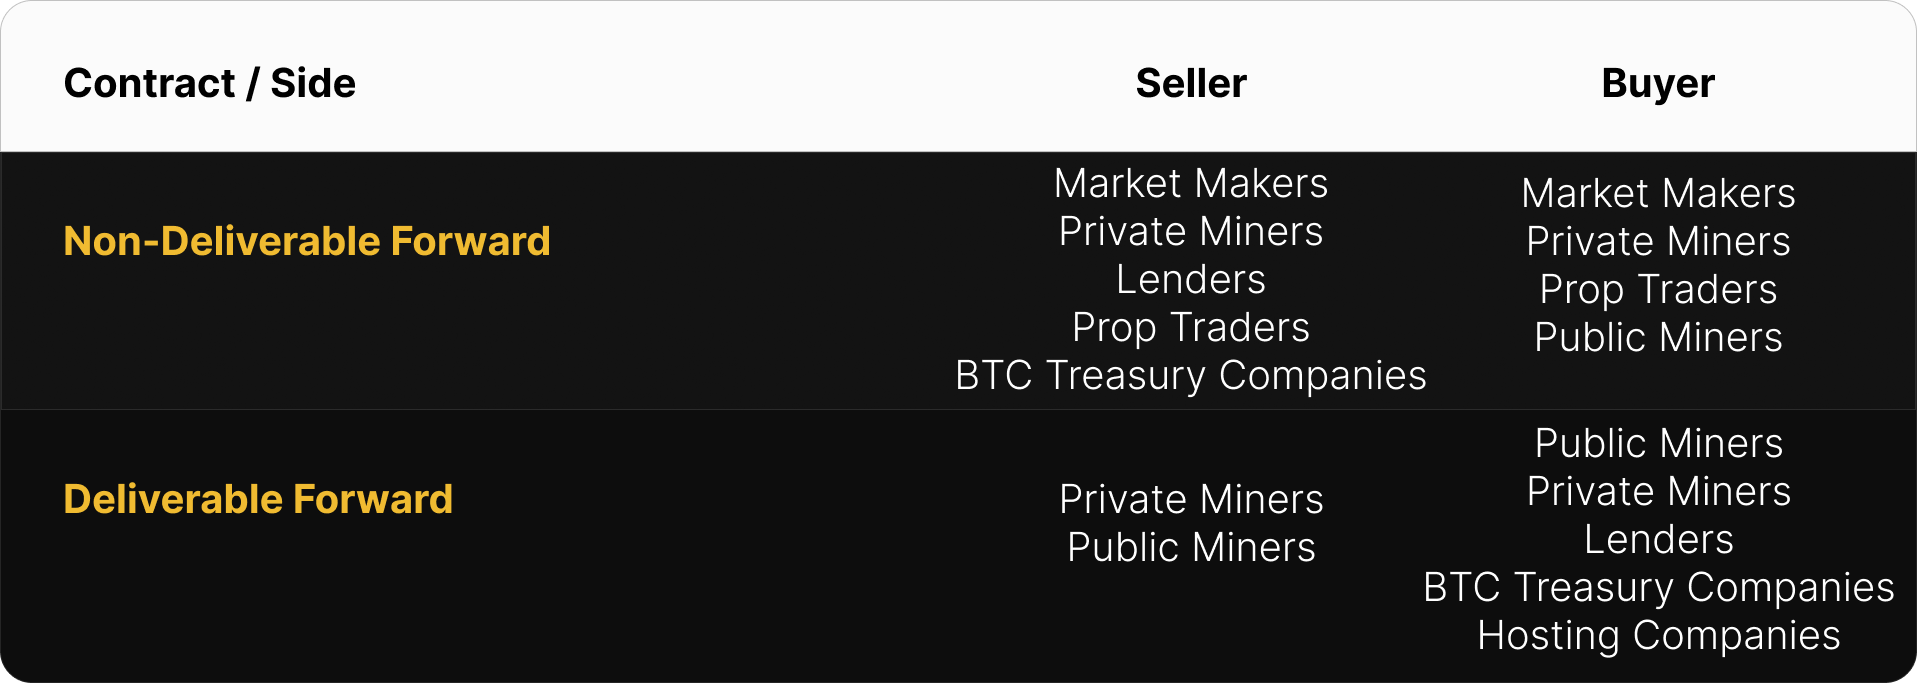
Because DFs are prepaid, they typically trade below NDFs to compensate buyers for credit risk and the cost of capital. Pairing a DF with an offsetting NDF can lock in that spread as a fixed BTC-denominated yield for lenders or a fixed financing cost for miners.
This strategy was used by lenders and Bitcoin treasury companies (buy DF & sell NDF) to earn a BTC-denominated return and by miners (sell DF & buy NDF) to obtain non-dilutive financing. In June 2026, that yield (cost of capital) was 7–10% annualized.
How June 2026 Hashrate Traded
June inverted May’s hedge results: USD sellers won at most horizons, and the pattern of who won reads like a map of where hashprice traded when the hedge was struck.
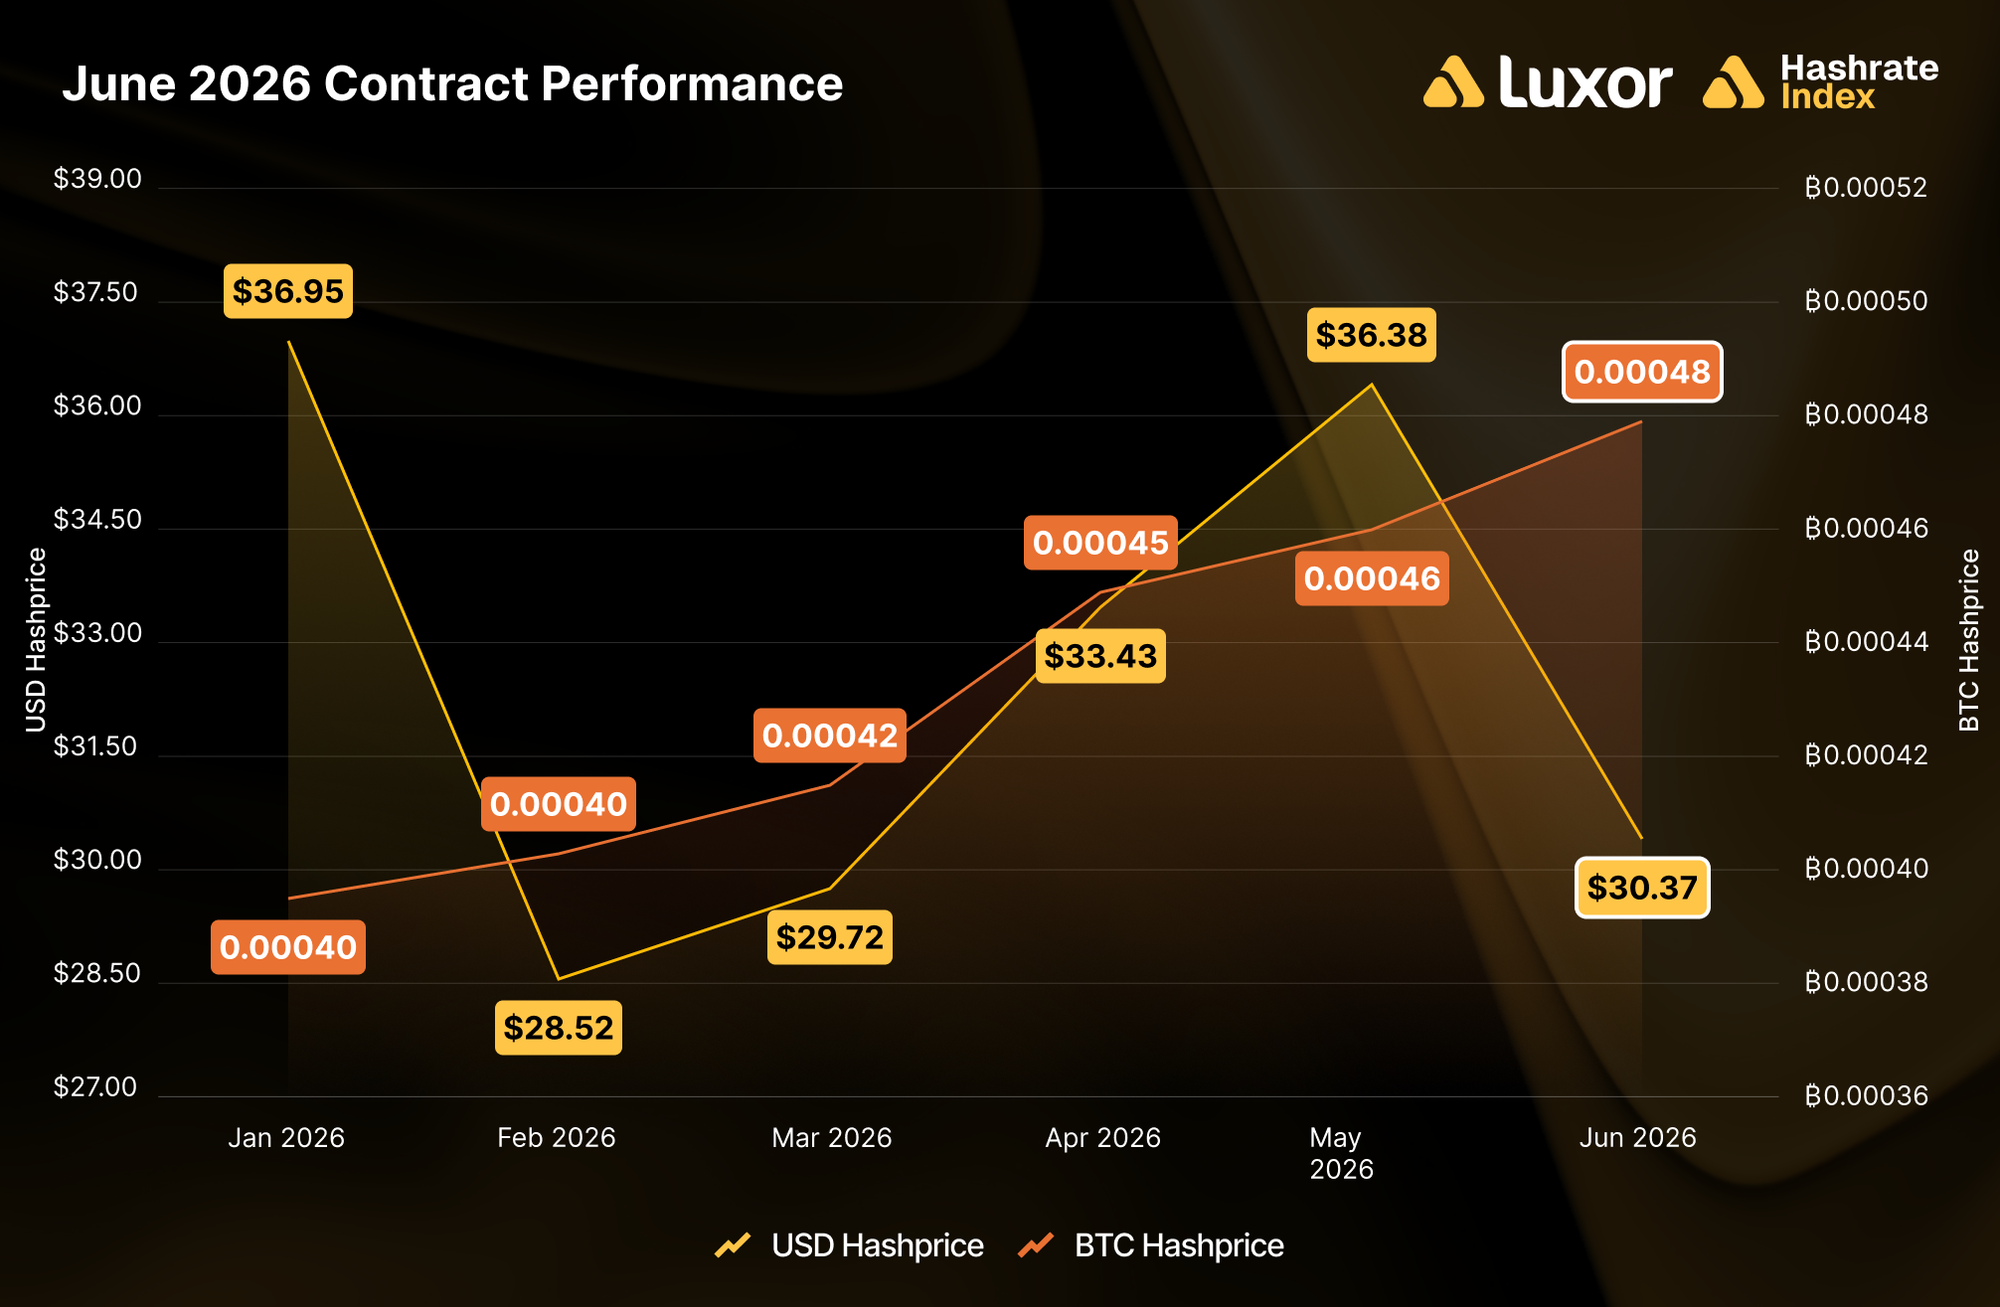
In USD-denominated contracts, sellers beat spot (FPPS) at three of five horizons. Forward sellers of the June 2026 contract locked in between $28.52 and $36.95 per PH/s/day against spot settlement of $30.37. The winners were the hedges struck away from and higher above the lows:
- The five-month-ahead sale in January at $36.95 (+21.7%, priced when BTC traded between ~$82,000 and ~$96,000)
- The one-month-ahead sale in May at $36.38 (+19.8%, priced at May’s local hashprice peak)
- The two-month-ahead sale in April at $33.43 (+10.1%)
The losers were the hedges struck inside the February–March all-time-low trough: -6.1% (four-month, $28.52) and -2.1% (three-month, $29.72). Selling forward paid whenever the forward curve wasn’t already pricing in capitulation.
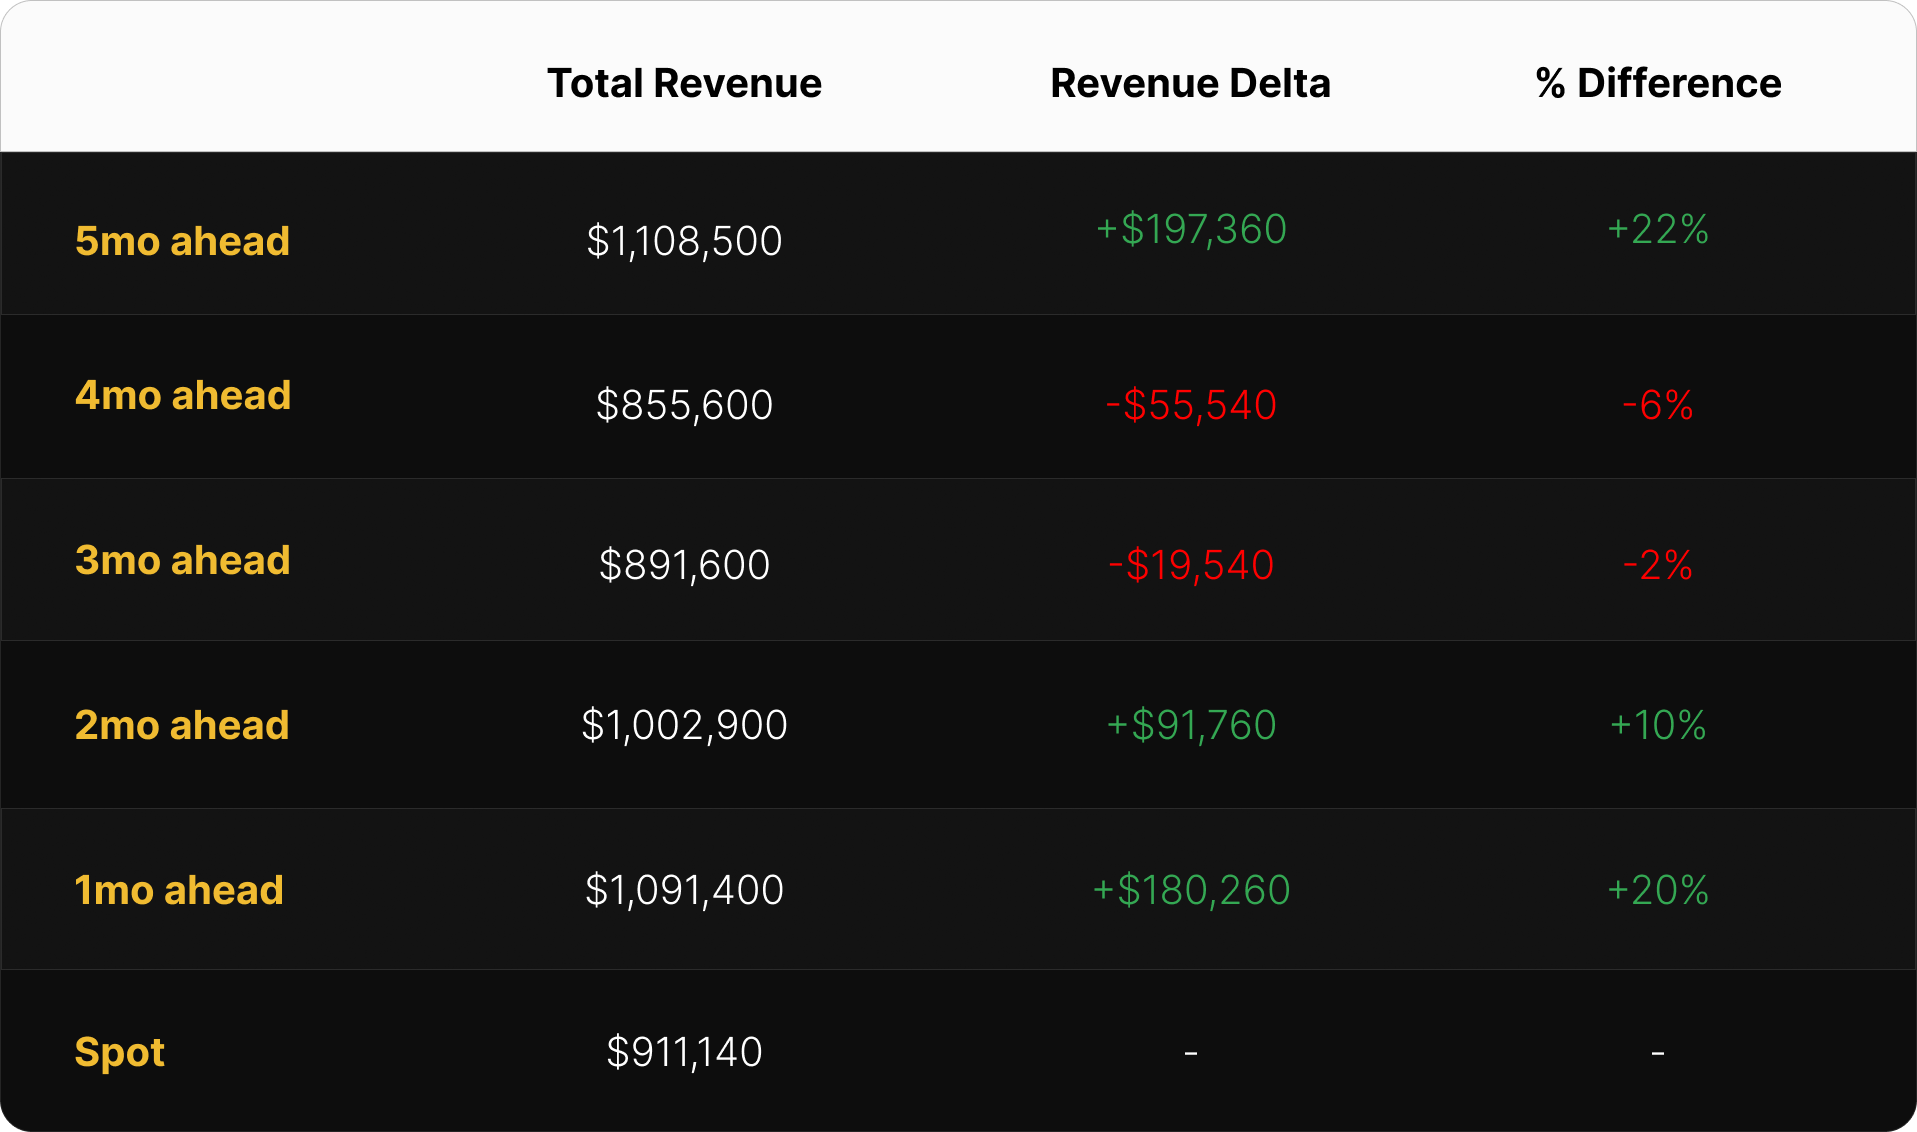
In BTC-denominated contracts, buyers won across the board for a second consecutive month. Forward sellers received between 0.00040 and 0.00046 BTC per PH/s/day, all below spot settlement of 0.00048 — the highest monthly settlement since August 2025. Average difficulty has now contracted ~14% from its 153.33T November 2025 monthly average, and June’s +22.6% fee jump added to the BTC-denominated payout. The spread compressed toward the front: five-month sellers (locked in January) gave up -17.5% versus spot, while one-month sellers (locked in May) gave up just -4.0%.
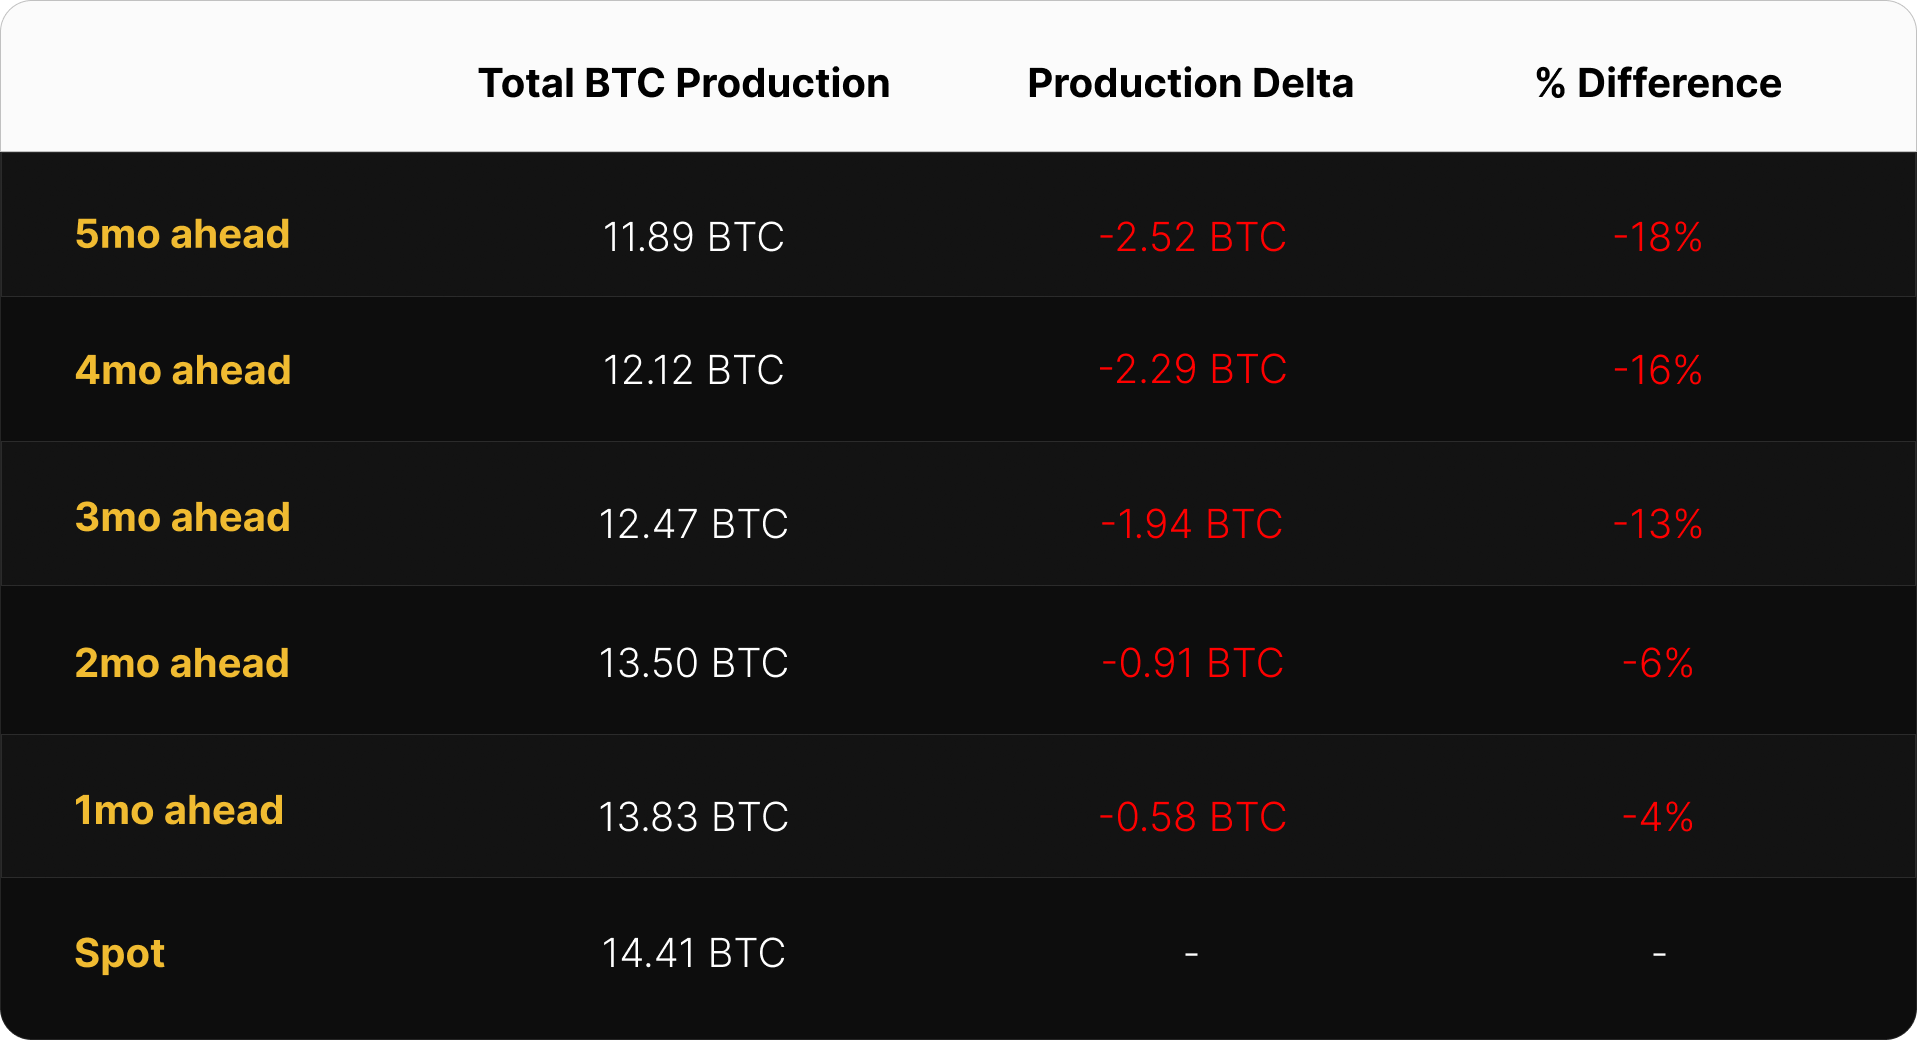
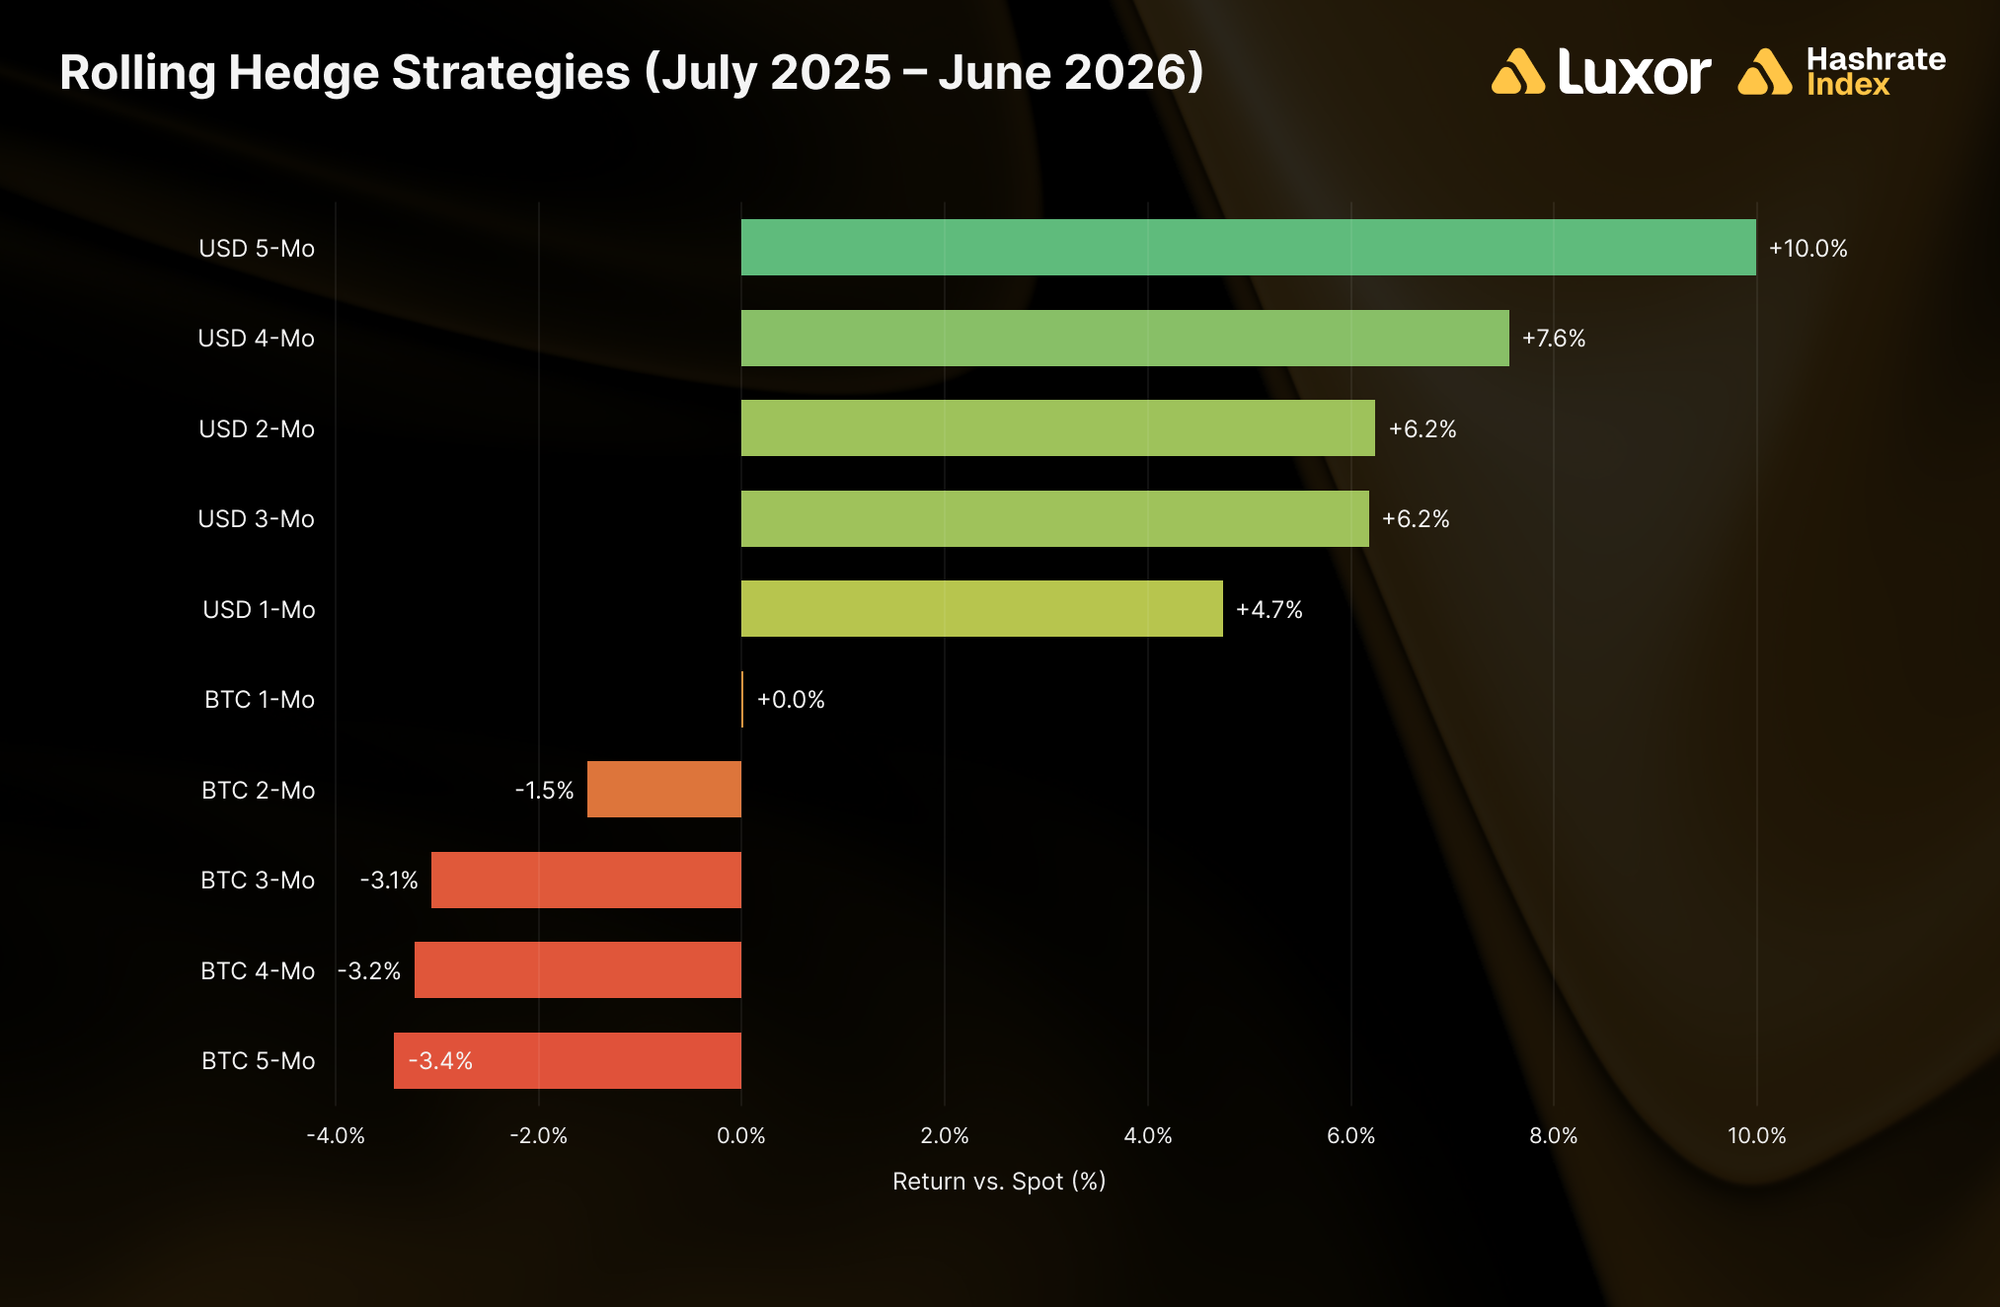
Zooming out, we examine rolling hedge performance across two windows: the trailing twelve months (July 2025–June 2026) and since the April 2024 halving (May 2024–June 2026).
Over the past year, rolling USD-denominated hedging strategies extended their sweep: every USD horizon beat spot (FPPS) mining, led by the 5-month (+10.0%) and 4-month (+7.6%) rolls, with the 2-month and 3-month tied at +6.2% and the 1-month at +4.7%. Rolling BTC-denominated strategies sat flat to negative, from +0.0% (1-month) to -3.4% (5-month). BTC hashprice has consistently settled above where the forward curve enabled sellers to lock in as difficulty kept undershooting expectations.
Extending the window back to the 2024 halving, every one of the ten strategies remains ahead of spot (FPPS), but the leaderboard keeps converging. BTC-denominated rolls still lead at the long end (+9.5% for 5-month, +6.4% for 4-month), while the remaining eight strategies cluster closer together: BTC 3-month (+3.9%) at the top, BTC 1-month (+1.6%) at the bottom, and all five USD horizons in between (+1.9% to +2.8%).
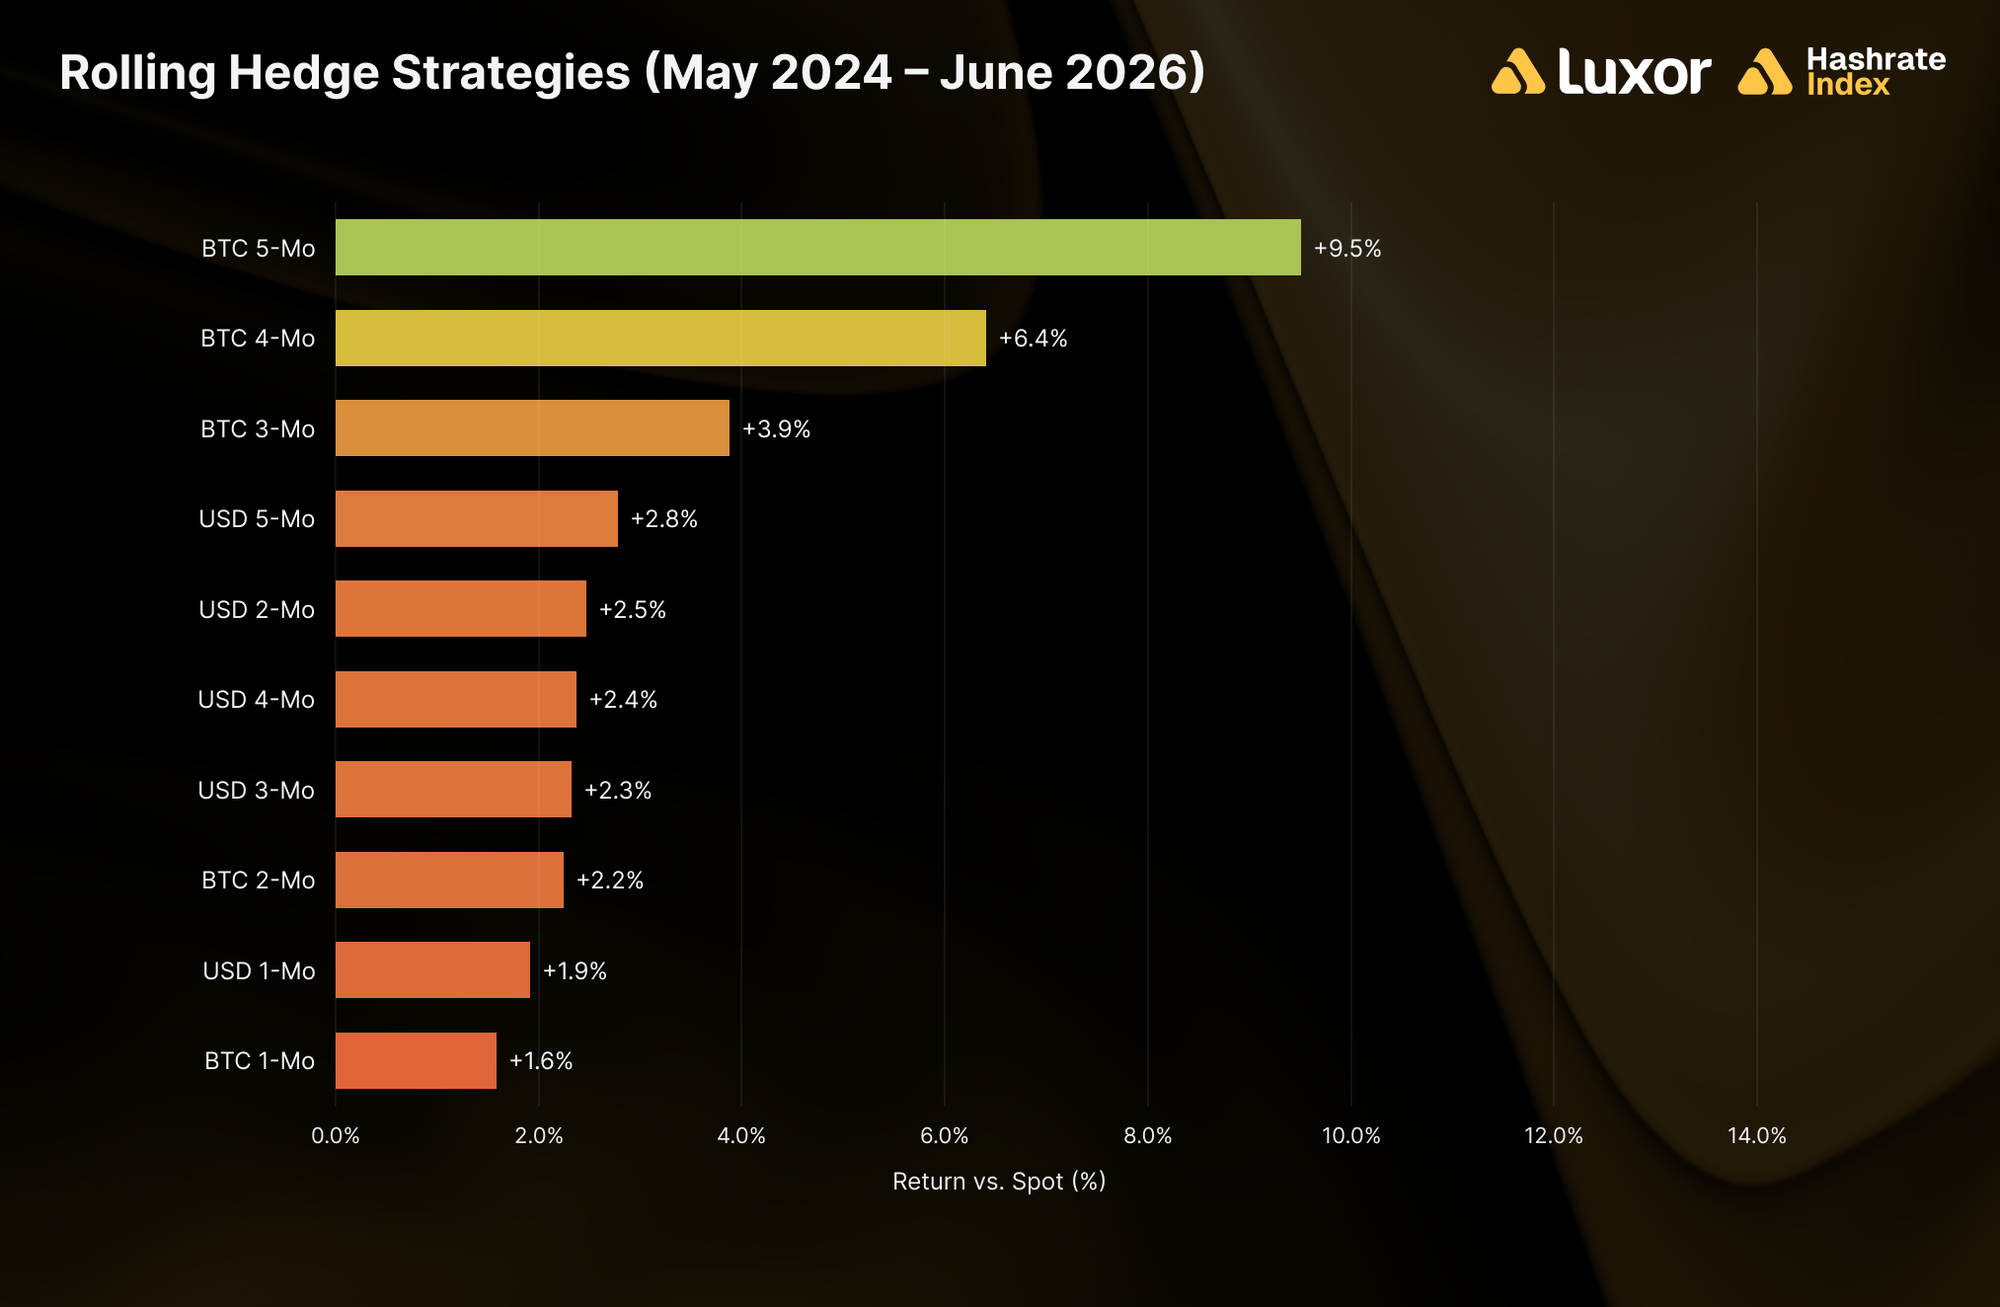
The regime logic from last month still holds: which denomination outperforms depends on whether BTC price or difficulty-plus-fees moves further than the forward market anticipated at the time of hedging. Through late 2025, difficulty outran expectations and BTC-denominated sellers captured the spread; since then, BTC price weakness has compressed USD hashprice below forward expectations and USD sellers have captured it. June added a data point to each column and to the constant across both: forward sellers as a group remain meaningfully ahead of mining at spot (FPPS) since the halving.
Note: two important caveats apply to both windows. First, figures exclude fees and bid/ask spreads. Second, hedging is a cost of business rather than a revenue generation strategy. Hedgers willingly buy the certainty of predictable cash flows, which increases valuations, reduces capital costs, and ultimately attracts investments.
How Future Hashrate Traded in June 2026
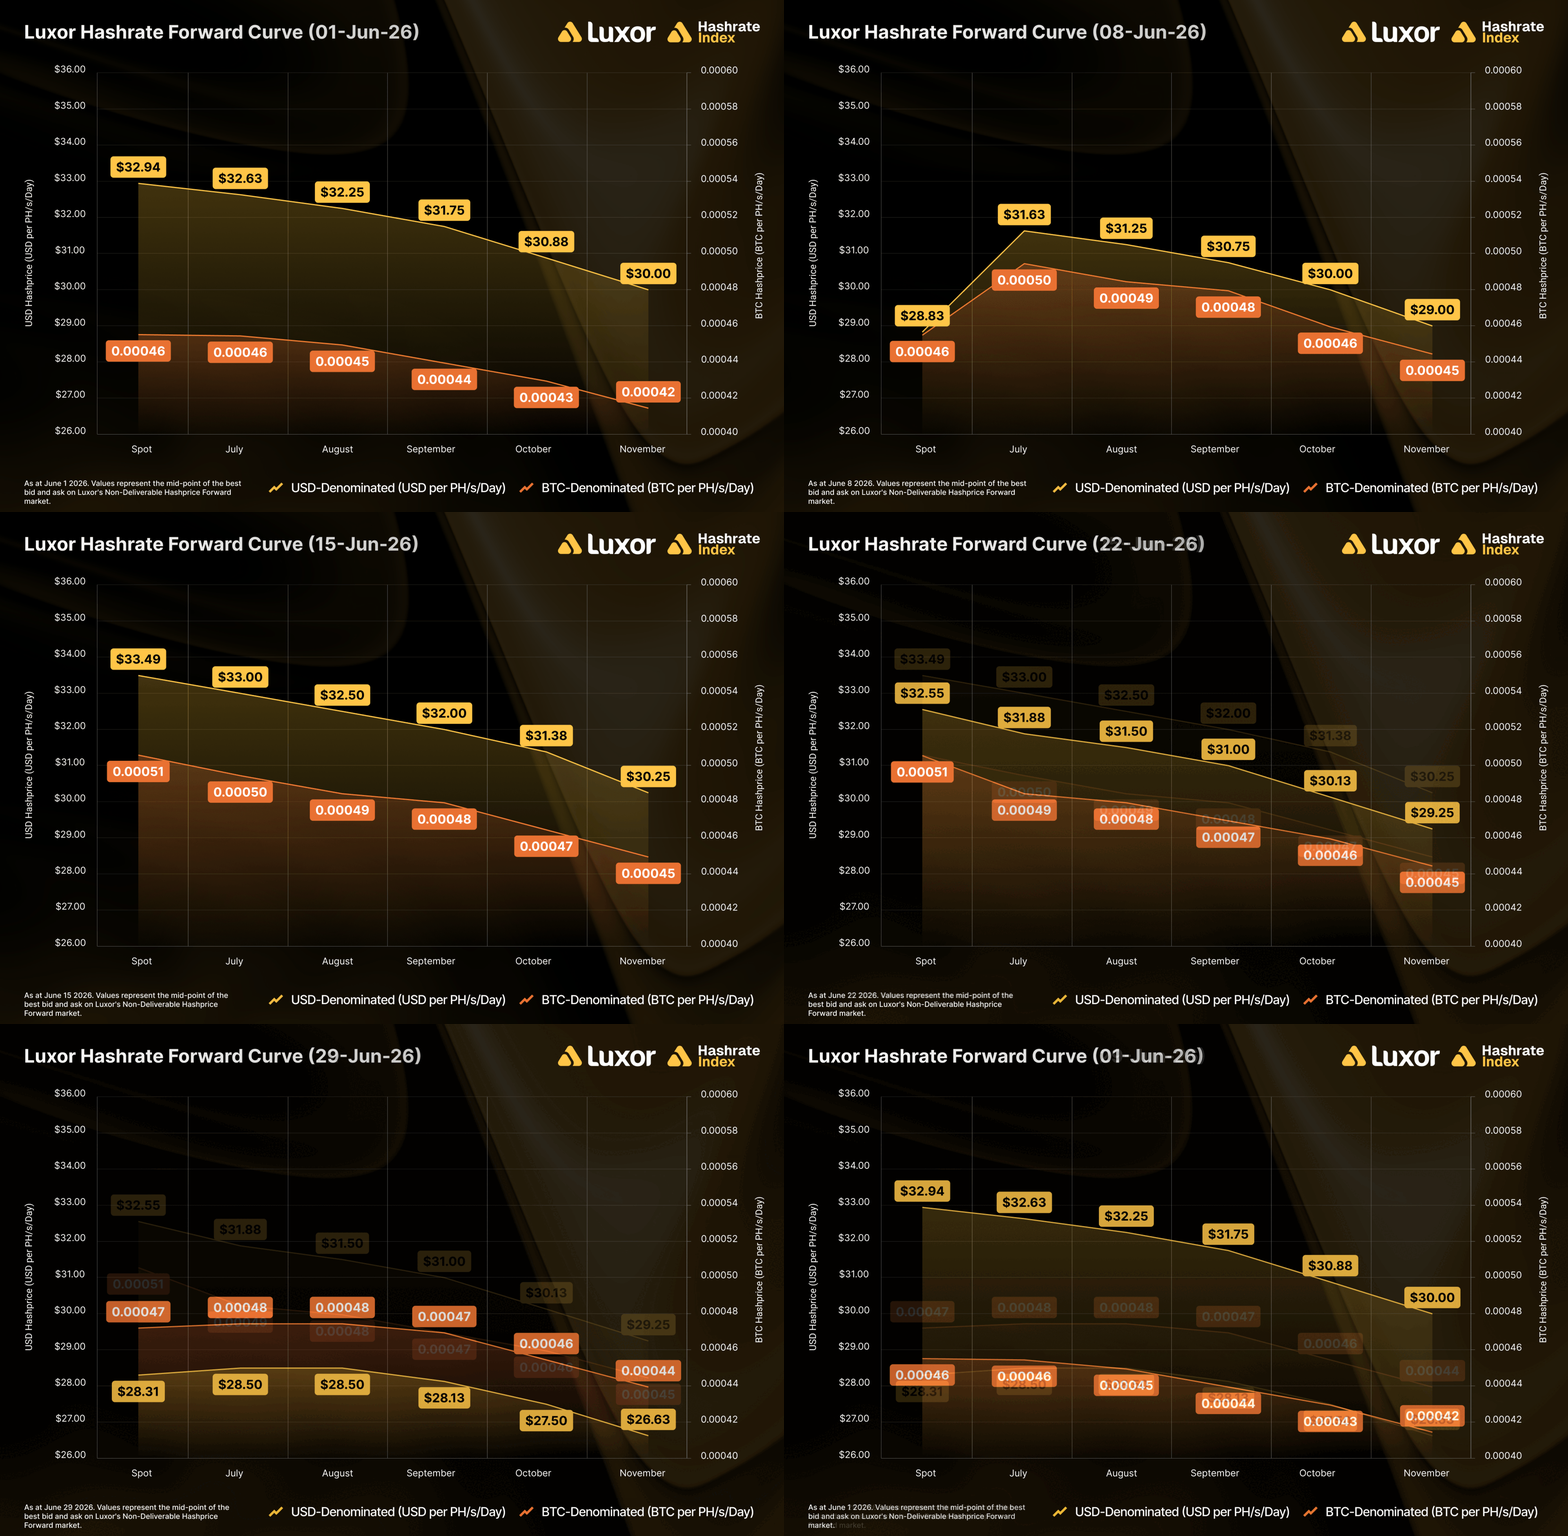
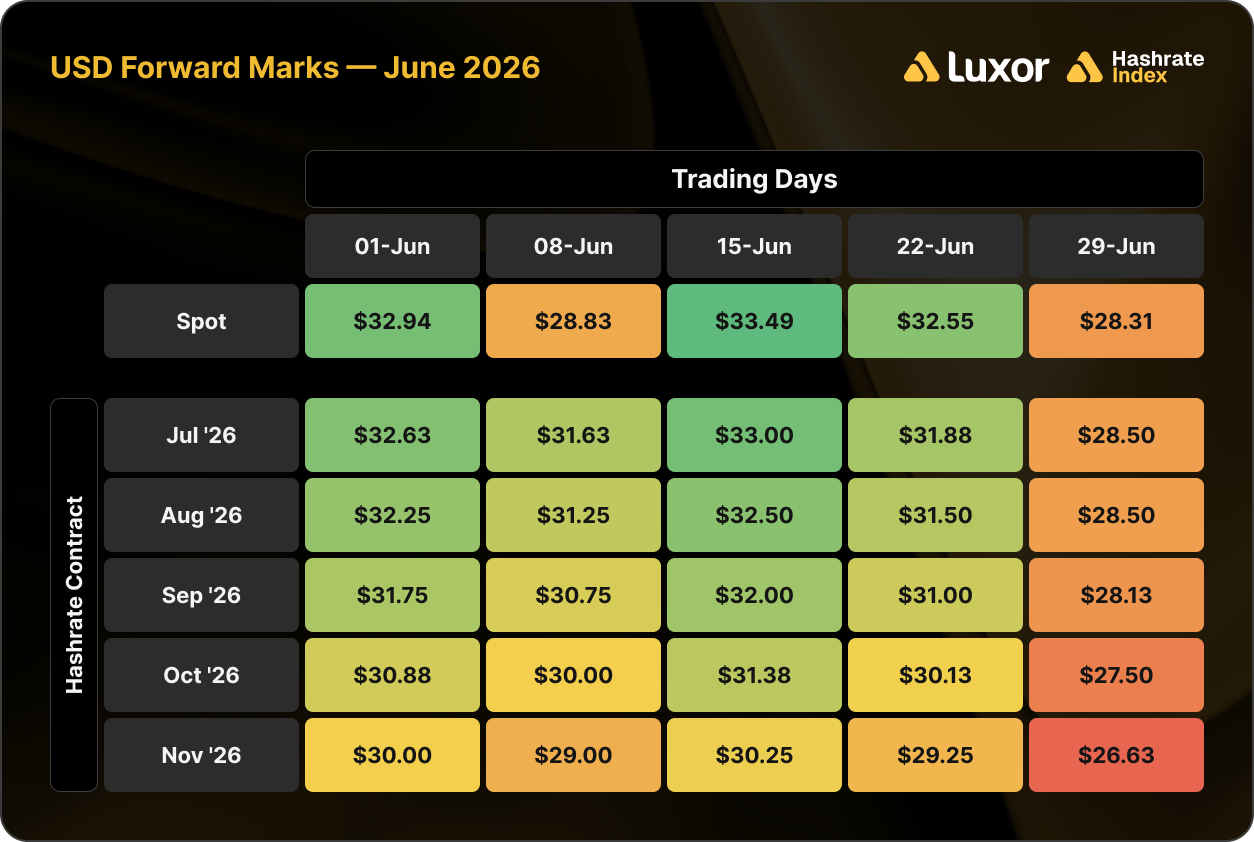
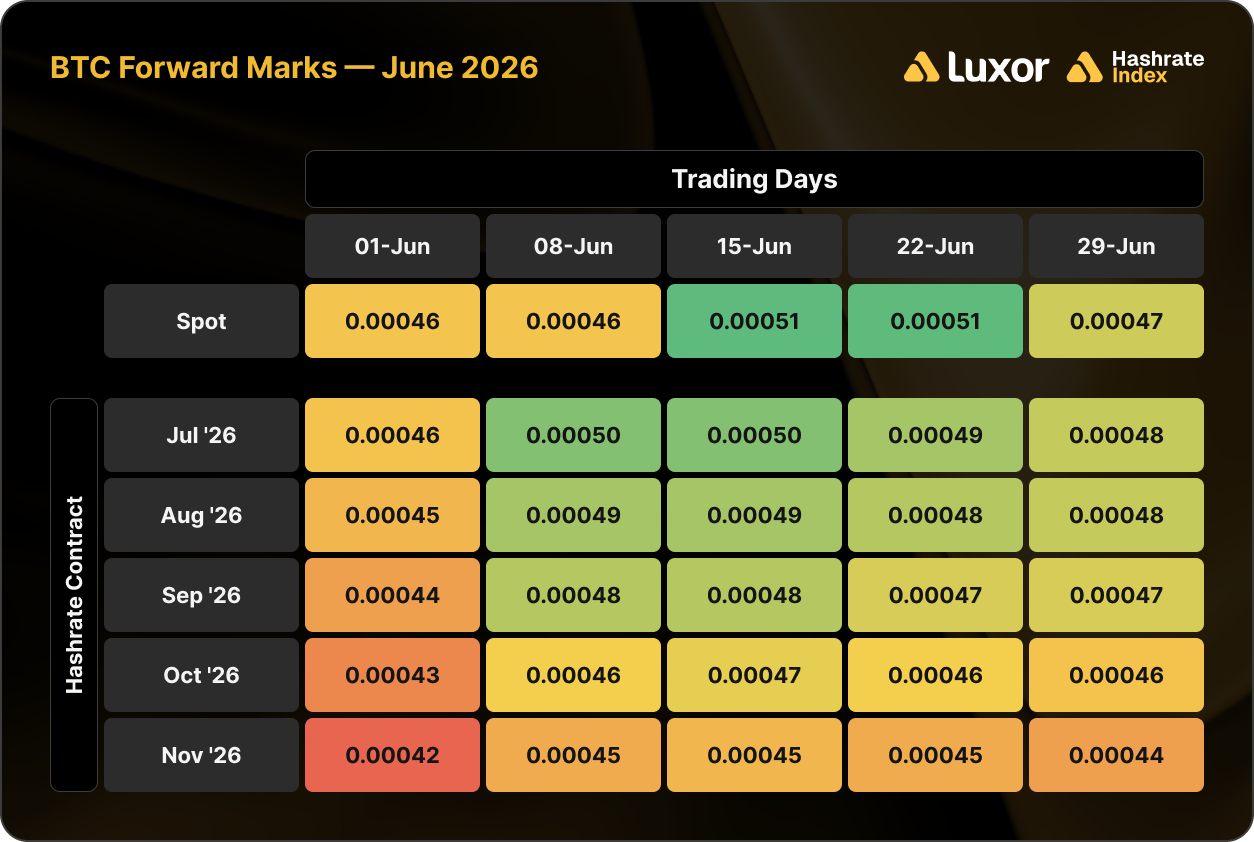
The two tables below summarize the evolution of hashrate forward markets during June 2026, for the subsequent five months from July 2026 to November 2026. Rows represent specific monthly contracts; columns represent specific trading days. Cell values are the average daily mid-market price, except for spot.
In June, the USD forward curve was marked down in line with BTC. Lock-in rates for July–November 2026 contracts fell -11.6% on average between June 1 and June 29 (range: -10.9% to -12.7%), against a -14.1% decline in spot. The repricing tracked BTC price weakness feeding into USD hashprice expectations, with the mid-month bounce (June 15 column) mirroring the post-adjustment hashprice recovery before the second half erased it.
The BTC-denominated curve moved the other way. July–November lock-in rates rose +5.7% on average over the month (range: +4.4% to +6.8%) while spot BTC hashprice gained +3.7%. Stripped of BTC price, that is the forward market marking down its difficulty-and-fees path: June’s -10.09% adjustment forced the forward curve to concede that the summer pullback it had only leaned toward in May was now the base case. Both curves held the 4CP contango structure into month-end: the front end retained a small premium, while the back end remained at a discount to spot. On June 29, July and August traded at a ~0.5–0.7% premium to spot ($28.50 | 0.00048 BTC versus $28.31 | 0.00047 BTC), with the discount deepening down the curve to -5.9% in November.
Dividing USD contract values by BTC contract values reveals the implied BTC price embedded in the forward hashrate market. Implied BTC price fell -16.4% on average across June, ending at ~$60,000 across all tenors by June 29. The hashrate forward curve marked BTC expectations down one-for-one with spot, embedding no rebound into year-end.
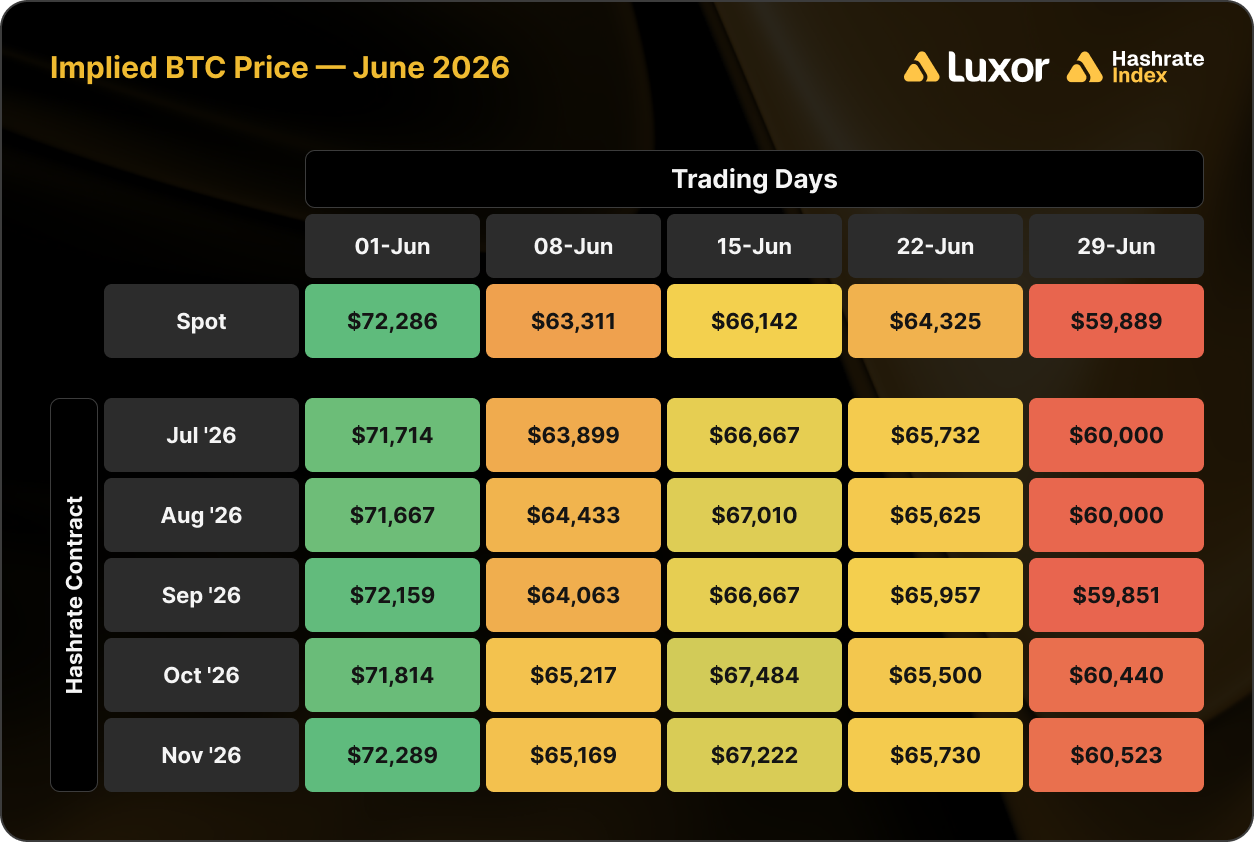
Assuming 0.0238 BTC per block in transaction fees (June’s monthly average), we can also back out implied difficulty and network hashrate expectations:
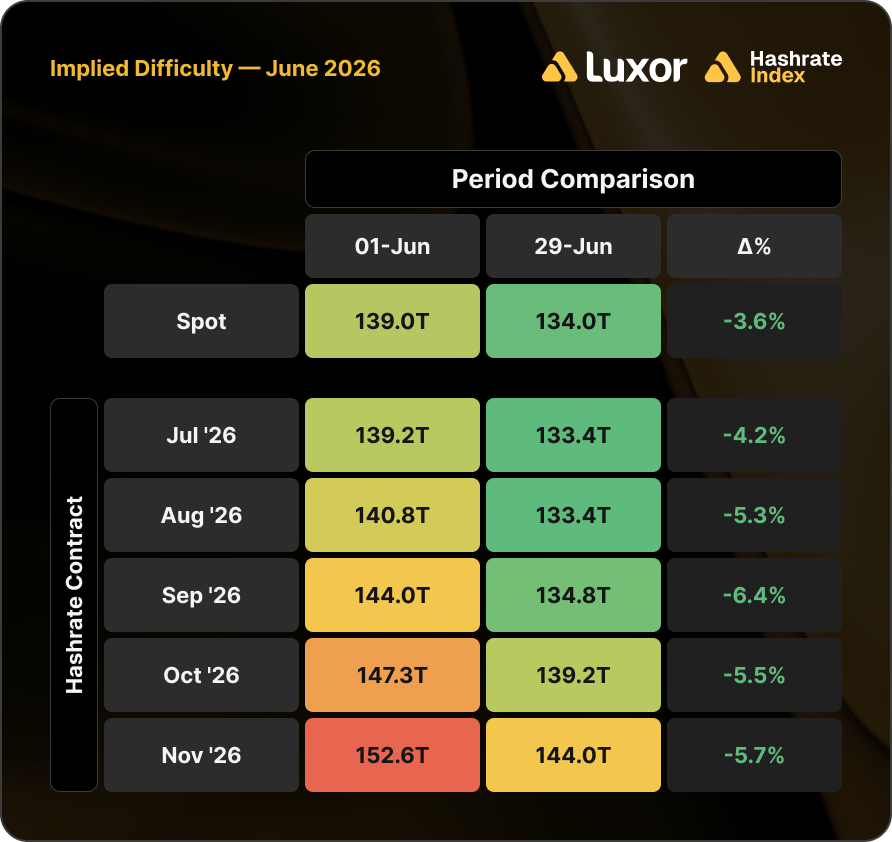
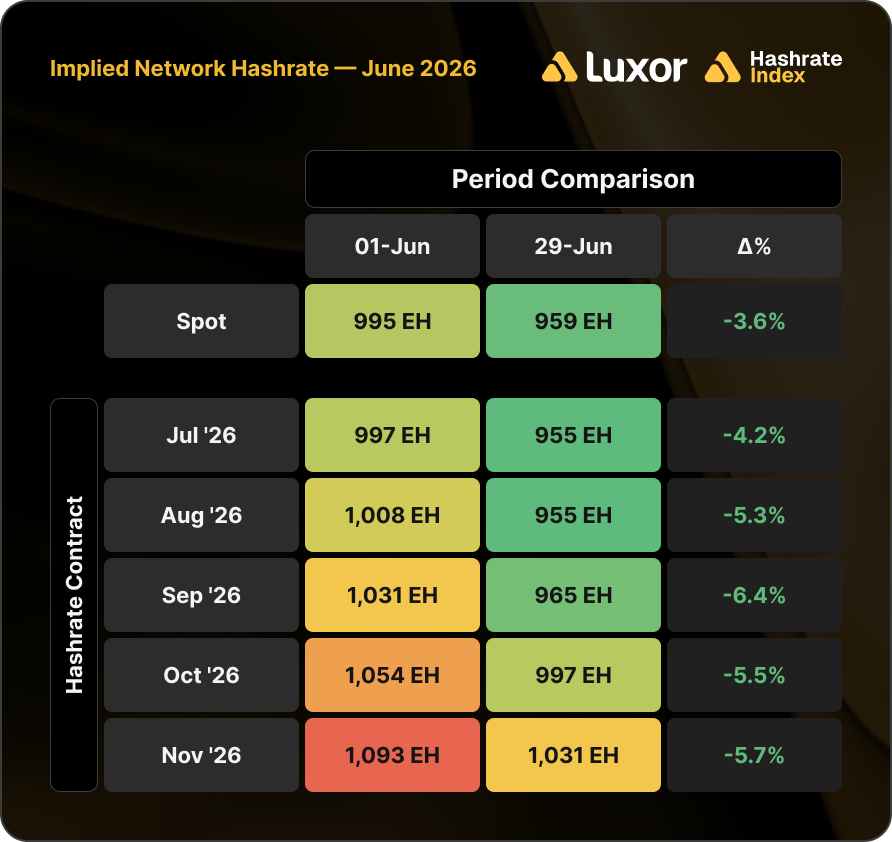
Note: figures assume 0.0238 BTC per block transaction fee collection.
Based on this analysis, the forward market cut its difficulty and hashrate expectations by ~5% on average during June, a mirror of the ~2% increase it was pricing a month ago. The shape survived as the level fell: implied hashrate on June 29 still climbs from ~955 EH/s at the July contract to ~1,031 EH/s by November (+8.0%). The forward market expects to see the same summer-bottom-to-autumn-rebound arc, just rebased lower after the June 14 adjustment showed how much marginal hashrate was actually at risk.
Concluding Thoughts and Looking Ahead
As of early July, BTC has rebounded to ~$63,000, lifted by the June 17 US–Iran memorandum and follow-on talks in Doha, the first spot Bitcoin ETF inflows since mid-June ($266M on July 6, the largest daily inflow in over a month), and a softer-than-expected June jobs report (+57,000 payrolls versus ~110,000 consensus). The rebound is fragile: on July 7–8, attacks on three ships in the Strait of Hormuz and retaliatory US–Iran strikes put the truce in question, sending Brent to ~$78/bbl (+8% over two sessions). Hashprice is hovering around ~$30 per PH/s/day.
The 4CP Wager Paid — Now Comes the Bigger Question
Last month we framed June as a test of the forward curve’s 4CP wager: front-end contango pricing in a summer slowdown in difficulty. It delivered. The -10.09% June 14 adjustment extended June’s streak as the only month with a negative mean adjustment every year since 2022, now five straight years.
But the full story was not just curtailment for peak avoidance. The +7.15% snapback on June 27 contains another signal. A pure 4CP signature removes hashrate for short, predictable windows and lets it return. More than half of the drop did return within one epoch, even with hashprice below $31; the rest of the drawdown was economic: hashprice spent ten of June’s first thirteen days below $30, switching off the 25–38 J/TH tier that had only just clawed back to breakeven in May. The picture is one part seasonal curtailment behaving exactly as the last four summers suggest, one part price-driven shutdowns that reversed as soon as the difficulty drop restored hashprice.
The next question is: what happens if BTC price stays here? Difficulty ended June ~14% below its 155.97T November 2025 peak, and network hashrate sits near ~910 EH/s versus ~990 EH/s at the start of June. At our estimated ~$46/MWh network-average power cost, the 25–38 J/TH tier is underwater again. Layer the July–September 4CP peaks on top (historically a fading drag after June; a 38-second block-time drag in July 2025, and back around to baseline by August), and the forward curve’s call of a summer low near ~955–960 EH/s followed by an autumn climb to ~1,031 EH/s looks less like a wager and more like a base case. The risk to it is another breakdown in BTC price.
BTC Price — Deepest Drawdown of the Cycle
June’s $59,005 close left BTC 53% below its October 2025 peak, matching the 2021 mid-cycle correction. More concerning is the duration: the nine-month drawdown has reached a new low with each macro shock, increasingly resembling a post-peak bear market. For miners, BTC near $59,000–$63,000 keeps USD hashprice around the $28–$31 range that triggered June’s marginal shutdowns, with each upward difficulty adjustment adding further pressure.
Looking Ahead
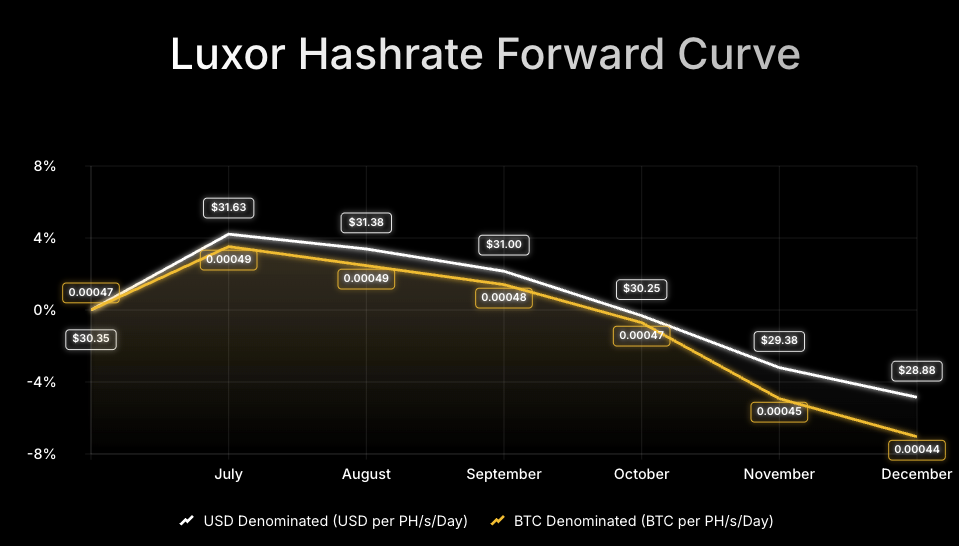
Looking forward, Luxor's Hashrate Forward Market is pricing in an average hashprice of $30.42 or 0.00047 BTC per PH/s/day over the August–December window. Sellers can currently secure this hashprice while buyers have the opportunity to lock in the same hashcost over the next six months.
If you’d like to learn more about Luxor’s Bitcoin mining derivatives, please reach out to [email protected] or visit https://www.luxor.tech/derivatives.
About Luxor Technology Corporation
Luxor delivers hardware, software, and financial services that power the global compute and energy industry. Its product suite spans Bitcoin Mining Pools, ASIC Firmware, Hardware trading, Hashrate Derivatives, Energy services, a Miner Management software, Commander, and a bitcoin mining data platform, Hashrate Index.
Disclaimer
This content is for informational purposes only, you should not construe any such information or other material as legal, investment, financial, or other advice. Nothing contained in our content constitutes a solicitation, recommendation, endorsement, or offer by Luxor or any of Luxor’s employees to buy or sell any derivatives or other financial instruments in this or in any other jurisdiction in which such solicitation or offer would be unlawful under the derivatives laws of such jurisdiction.
There are risks associated with trading derivatives. Trading in derivatives involves risk of loss, loss of principal is possible.




Hashrate Index Newsletter
Join the newsletter to receive the latest updates in your inbox.