Luxor Hashrate Lookback Series — July 2026
July 2026’s hashrate and hashprice trends, forward market participation, trading activity and contract performance.




Luxor’s Monthly Lookback Series is a deep dive into Bitcoin hashrate market activity. In this post, we cover July 2026’s hashrate market and hashprice trends, forward market participation, trading activity and contract performance.
Summary
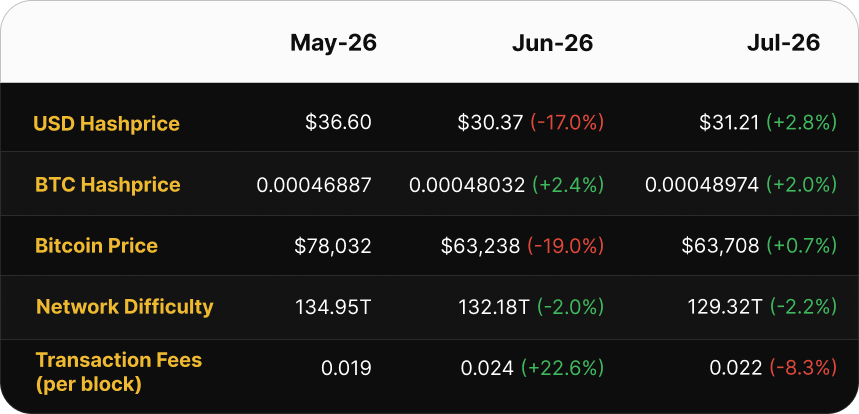
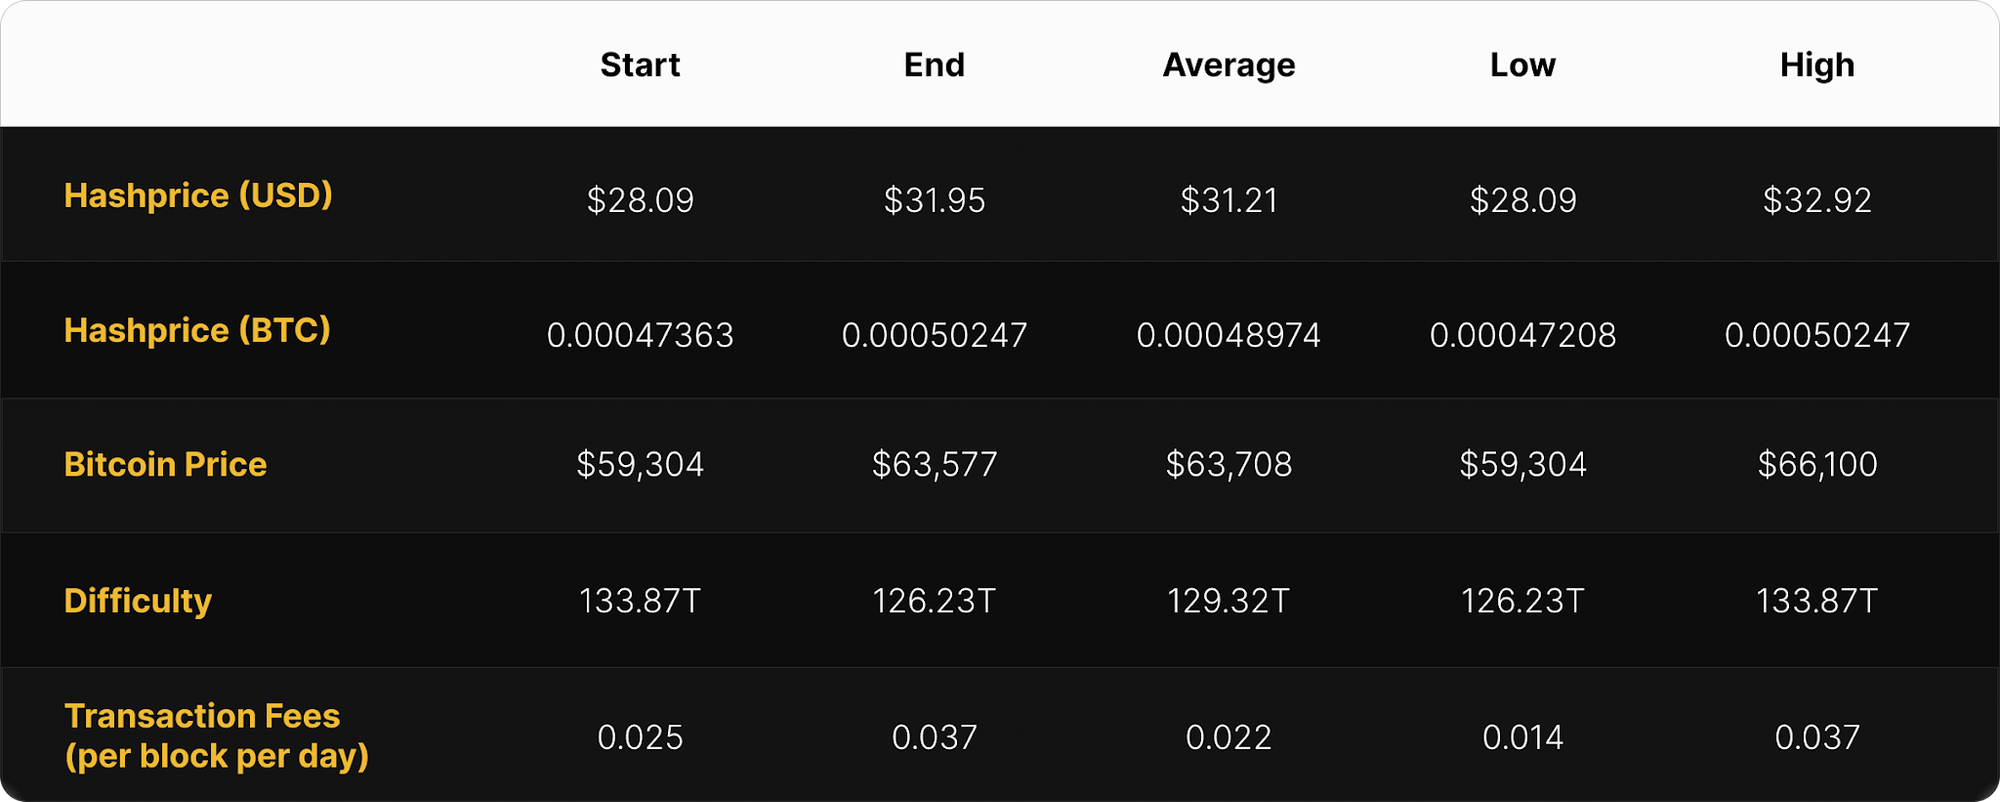
- Double Drop in Difficulty, Slight Hashprice Recovery: Difficulty fell twice during July epochs, -5.00% on July 11, and -0.74% on July 25 (a -5.71% net decline). The trend was driven by 4CP curtailment, and the July 11 drop was the fourth-largest decrease of 2026. Monthly average USD hashprice rose to $31.21 per PH/s/day (+2.8%), recovering only a sliver of June’s fall (-17.0%).
- BTC Hashprice at an 11-Month High: BTC hashprice averaged 0.00048974 BTC per PH/s/day (+2.0%), and closed the month at 0.00050247 BTC — the strongest monthly average since August 2025. What this means for miners still online and hashing: relief. The Bitcoin network is paying more BTC per unit of SHA-256 compute.
- Bitcoin Stabilized: BTC opened July at $59,304 and closed at $63,577 (+7.2%), with a $66,100 high, and a monthly average of $63,708 (+0.7%). Price action points toward stabilization rather than recovery.
- USD-denominated Hashrate Hedges Won 2 of 5, BTC Sellers Lost All Five: In July 2026, spot USD hashprice settled at $31.21 per PH/s/day. Forward sellers from April (+5.3%) and May (+14.7%) beat spot (FPPS), while hedges struck in February, March, and June fell short. In BTC-denominated contracts, sellers lost at every horizon for a fourth straight month, giving up -0.9% to -19.7% against a spot settlement of 0.00049 BTC per PH/s/day. These results were driven by ongoing weakness in BTC price action combined with declining difficulty beyond expectations.
- The Hashrate Forward Curve Moved Up: July inverted June’s repricing. USD forward contracts for August–December rose +8.1% on average over the month, and BTC-denominated contracts rose +6.4%.
July 2026 Spot Hashprice & Its Constituents
July 2026 was a stabilization month. Difficulty fell at both adjustments for a -5.71% net decline (from 133.87T to 126.23T) as miners in ERCOT curtailed for 4CP. USD hashprice rose +2.8% on a monthly-average basis, and BTC hashprice reached its highest monthly average since August 2025, lifting miner revenue per unit of hashrate even as BTC price averaged close to flat (+0.7%). After June’s capitulation — record-low hashprice and a -10.09% difficulty drop — July saw the network finding some relief.
USD Hashprice — Slight Recovery
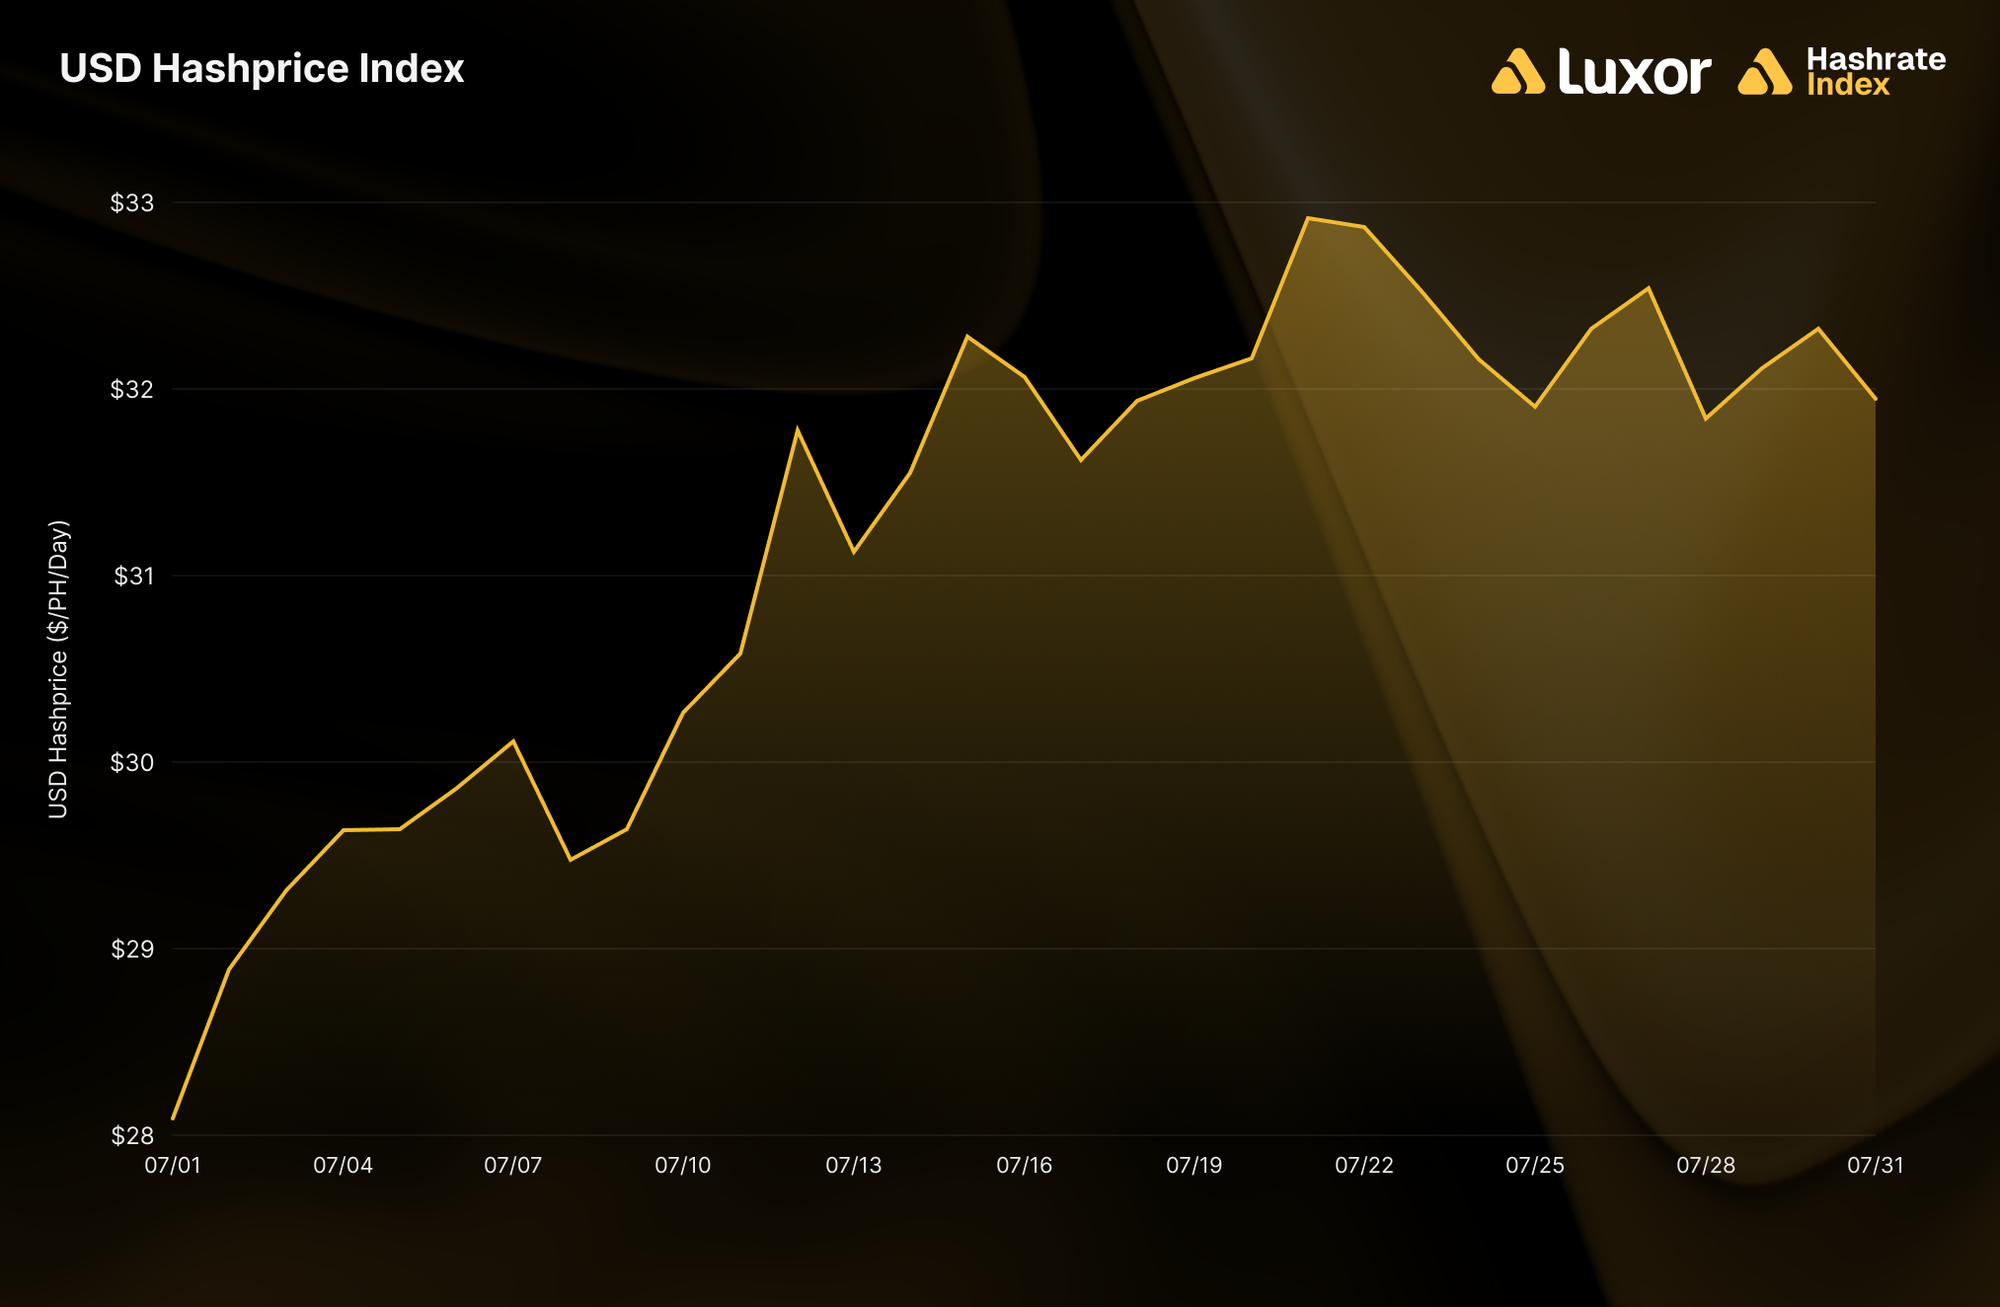
Monthly average USD hashprice rose from $30.37 to $31.21 per PH/s/day (+2.8%), a move up from June’s record low. The recovery was small: June had fallen -17.0%, or $6.23, and July regained $0.84 of it, about 13%. At $31.21, July ranks as the second-lowest monthly average on record, behind June’s $30.37 and just under March’s $31.27 — these three lowest readings in the Bitcoin Hashprice Index’s history all fall inside 2026. For comparison, 2025’s monthly averages ranged from $37.89 to $59.38 with a mean of $50.68.
The month opened at its floor and climbed. Hashprice began July at $28.09 (the fifth-lowest daily print on record), and stayed above June’s $27.74 daily all-time low throughout. A downward difficulty adjustment (-5.00%) on July 11 lifted revenue per unit of hashrate, and USD hashprice peaked at $32.92 on July 21 as BTC topped out at $66,100. It closed at $31.95, +13.7% versus the open.
BTC Price — Stabilized
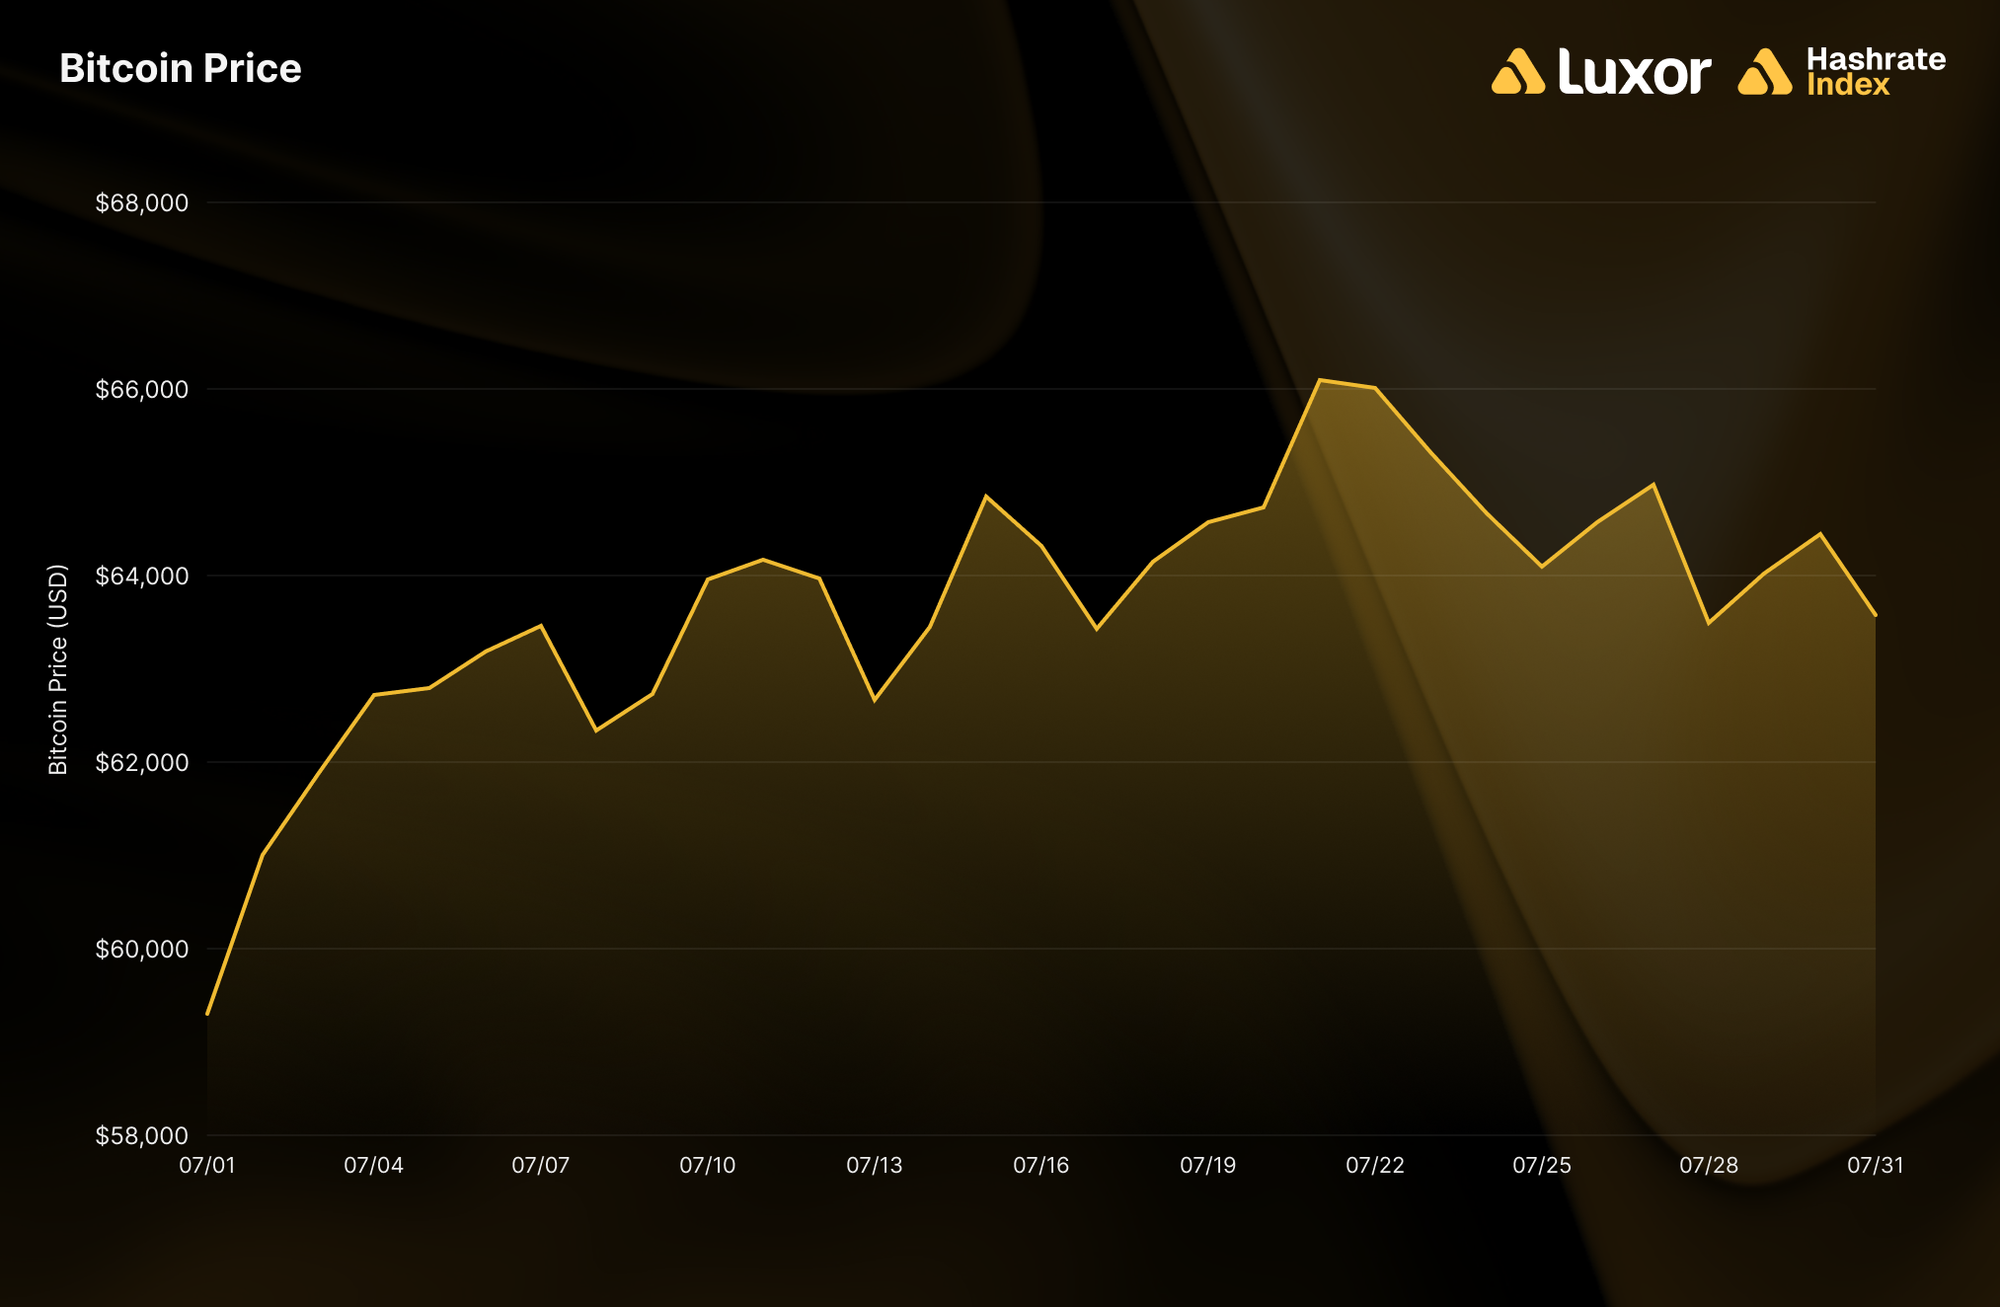
Monthly average BTC price averaged $63,708 in July (+0.7%). It opened at $59,304 and closed at $63,577 (+7.2%), peaking at $66,100 on July 21. Price action inverted June’s trend: June opened at its high and closed at its low, whereas July opened at its low and closed near its high. The flat monthly average masks the turn, which is why hashprice improved more than the average BTC price change alone would suggest.
The driver for BTC was policy, both monetary and regulatory. Bitcoin entered July near $59,000 after its second-worst month of 2026: a -19.0% June decline coinciding with a record ~$4.5B of US spot Bitcoin ETF outflows, coupled with the June Summary of Economic Projections moving interest rate expectations from one 2026 cut to one hike on the back of a revision to the core Personal Consumption Expenditures (PCE) inflation index up to 3.3%.
July reversed the flow side. ETF flows turned positive mid-month (~$227M of net inflows on July 20, and a five-day total near $727M), lifting assets under management (AUM) from ~$75B to ~$79B. The Federal Reserve then held rates steady at the July 28–29 meeting.
The month’s peak also had a legislative fingerprint. On July 22, Senate Republicans released a revised text of the Digital Asset Market Clarity Act merging the Banking and Agriculture committee bills, and adding a division of ethics requirements restricting digital asset activity by senior federal officials, the language for which was still under negotiation. The bill has cleared the House (294–134 in July 2025) and Senate Banking Committee (15–9 on May 14, 2026), and has sat on the Senate Legislative Calendar since June 1, but no cloture motion had been filed and no floor vote scheduled as of July's month-end, which requires 60 votes against 53 Republican seats. Whether it reaches the floor remains an open question at the time of writing.
At a month-end close of $63,577, BTC ended July 48.9% below its October 6, 2025 peak of $124,485 (based on Luxor’s daily index). This is an improvement from June’s trough (-52.6%), but still the deepest sustained drawdown of this cycle.
Network Difficulty — Double Drop
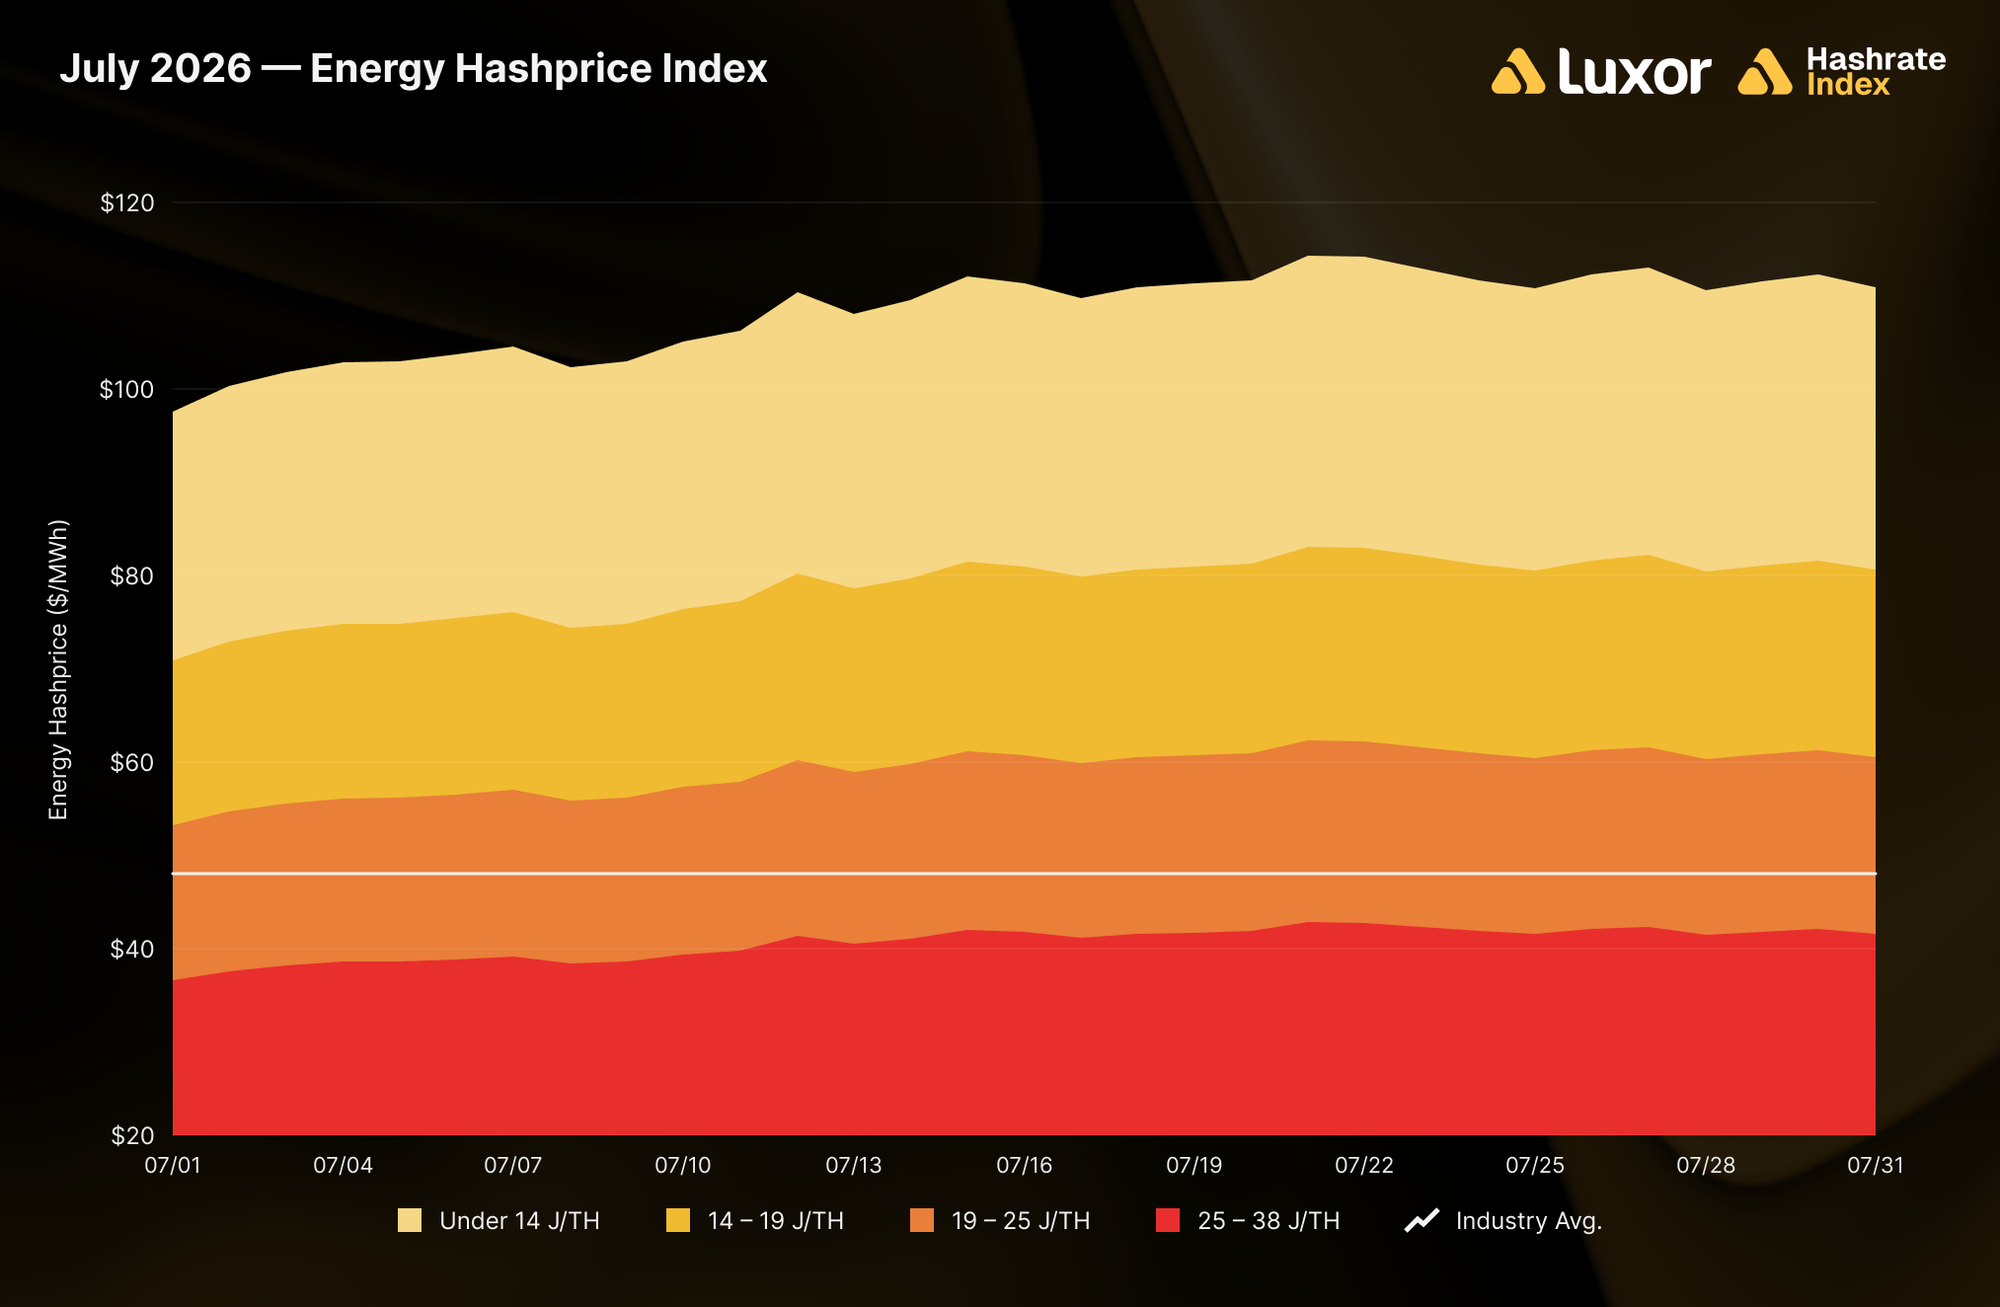
Difficulty averaged 129.32T in July, down -2.2% from June. Two downward adjustments occurred in the month: July 11 (-5.00% from 133.87T to 127.17T), and July 25 (-0.74%, from 127.17T to 126.23T), leaving difficulty roughly 19% below its 155.97T peak set on October 29, 2025.
The June 26 – July 11 epoch’s 2,016 blocks ran over the network’s 10-minute target, and a contributing cause was 4CP curtailment, as shown by Luxor Energy’s 4CP Dispatch Signal below:
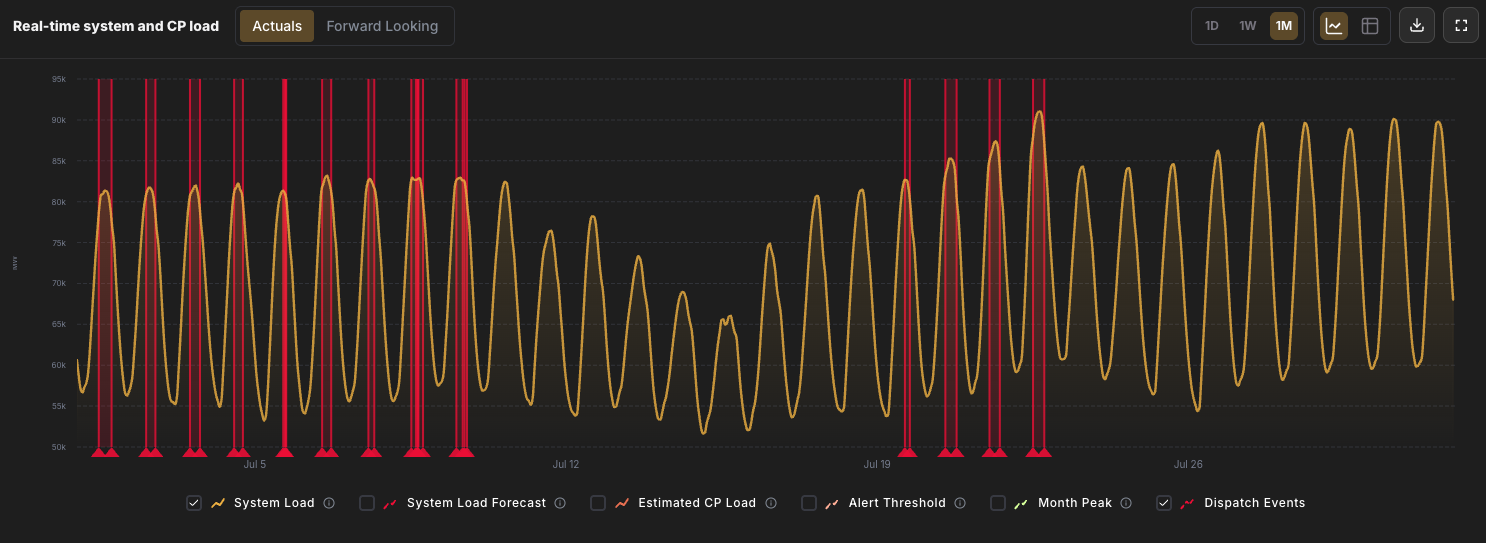
ERCOT dispatch events clustered heavily across July 1–10, with more than a dozen curtailment events in ten days. The following July 11 – July 25 epoch saw less than half, and produced a −0.74% adjustment. Curtailment intensity and difficulty adjustment size tracked each other closely. July 11’s -5.00% drop was also the fourth-largest decrease of 2026 (behind February’s -11.16%, June’s -10.09% and March’s -7.76%) — the three of which all ranked in the top 10 largest difficulty drops of the modern ASIC era (since 2016).
After June’s violent whipsaw, July’s second epoch was close to equilibrium, with hashrate broadly matching what the post-July 11 difficulty level implied. It also extends a streak: difficulty has now closed below 139.70T — the 1 ZH/s equivalent — for ten consecutive difficulty adjustments spanning March 20 to July 25 (roughly 127 days). We first flagged this reversal back in April, at which point the trend stood at four adjustments (43 days). The Bitcoin network first crossed 1 ZH/s back in September 2025.
Another distinction between June and July’s difficulty drops is that June’s drop coincided with record-low hashprice, so seasonal curtailment and economic shutdowns stacked; July’s came while hashprice rose +2.8%, which removes some of that economic layer.
Overall, difficulty fell from 133.87T to 126.23T (-5.71%) over the month.
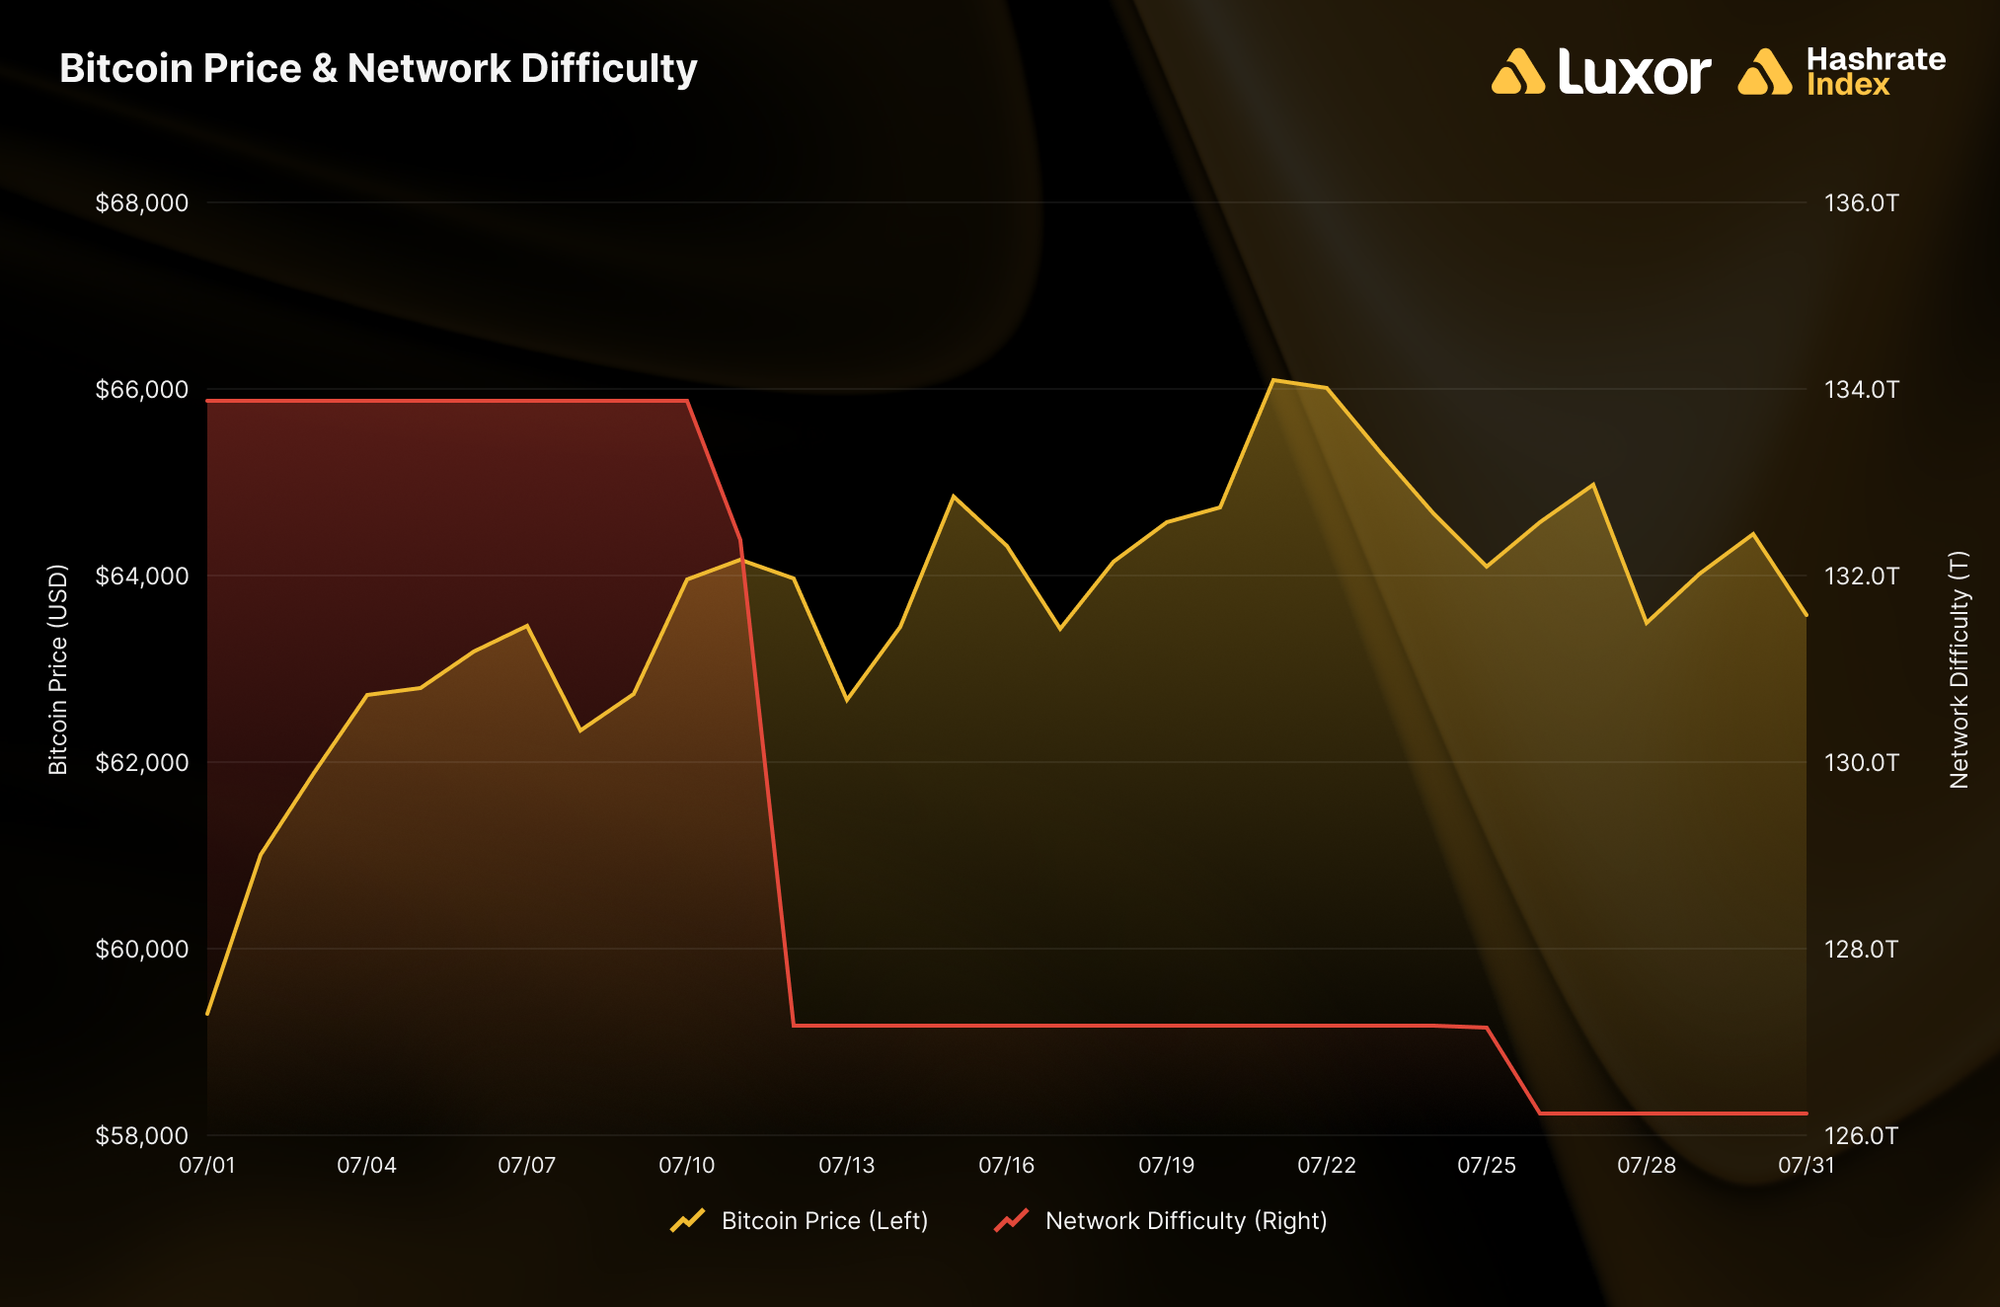
Blocks ran slightly fast, averaging 9 minutes 55 seconds per block, essentially unchanged from June’s 9m57s, with 17 of 31 days below the 10-minute target and 14 above. The monthly average landing below target tells us that hashrate had stopped deteriorating: for a majority of the month, the network produced blocks slightly faster than the prevailing difficulty implied.
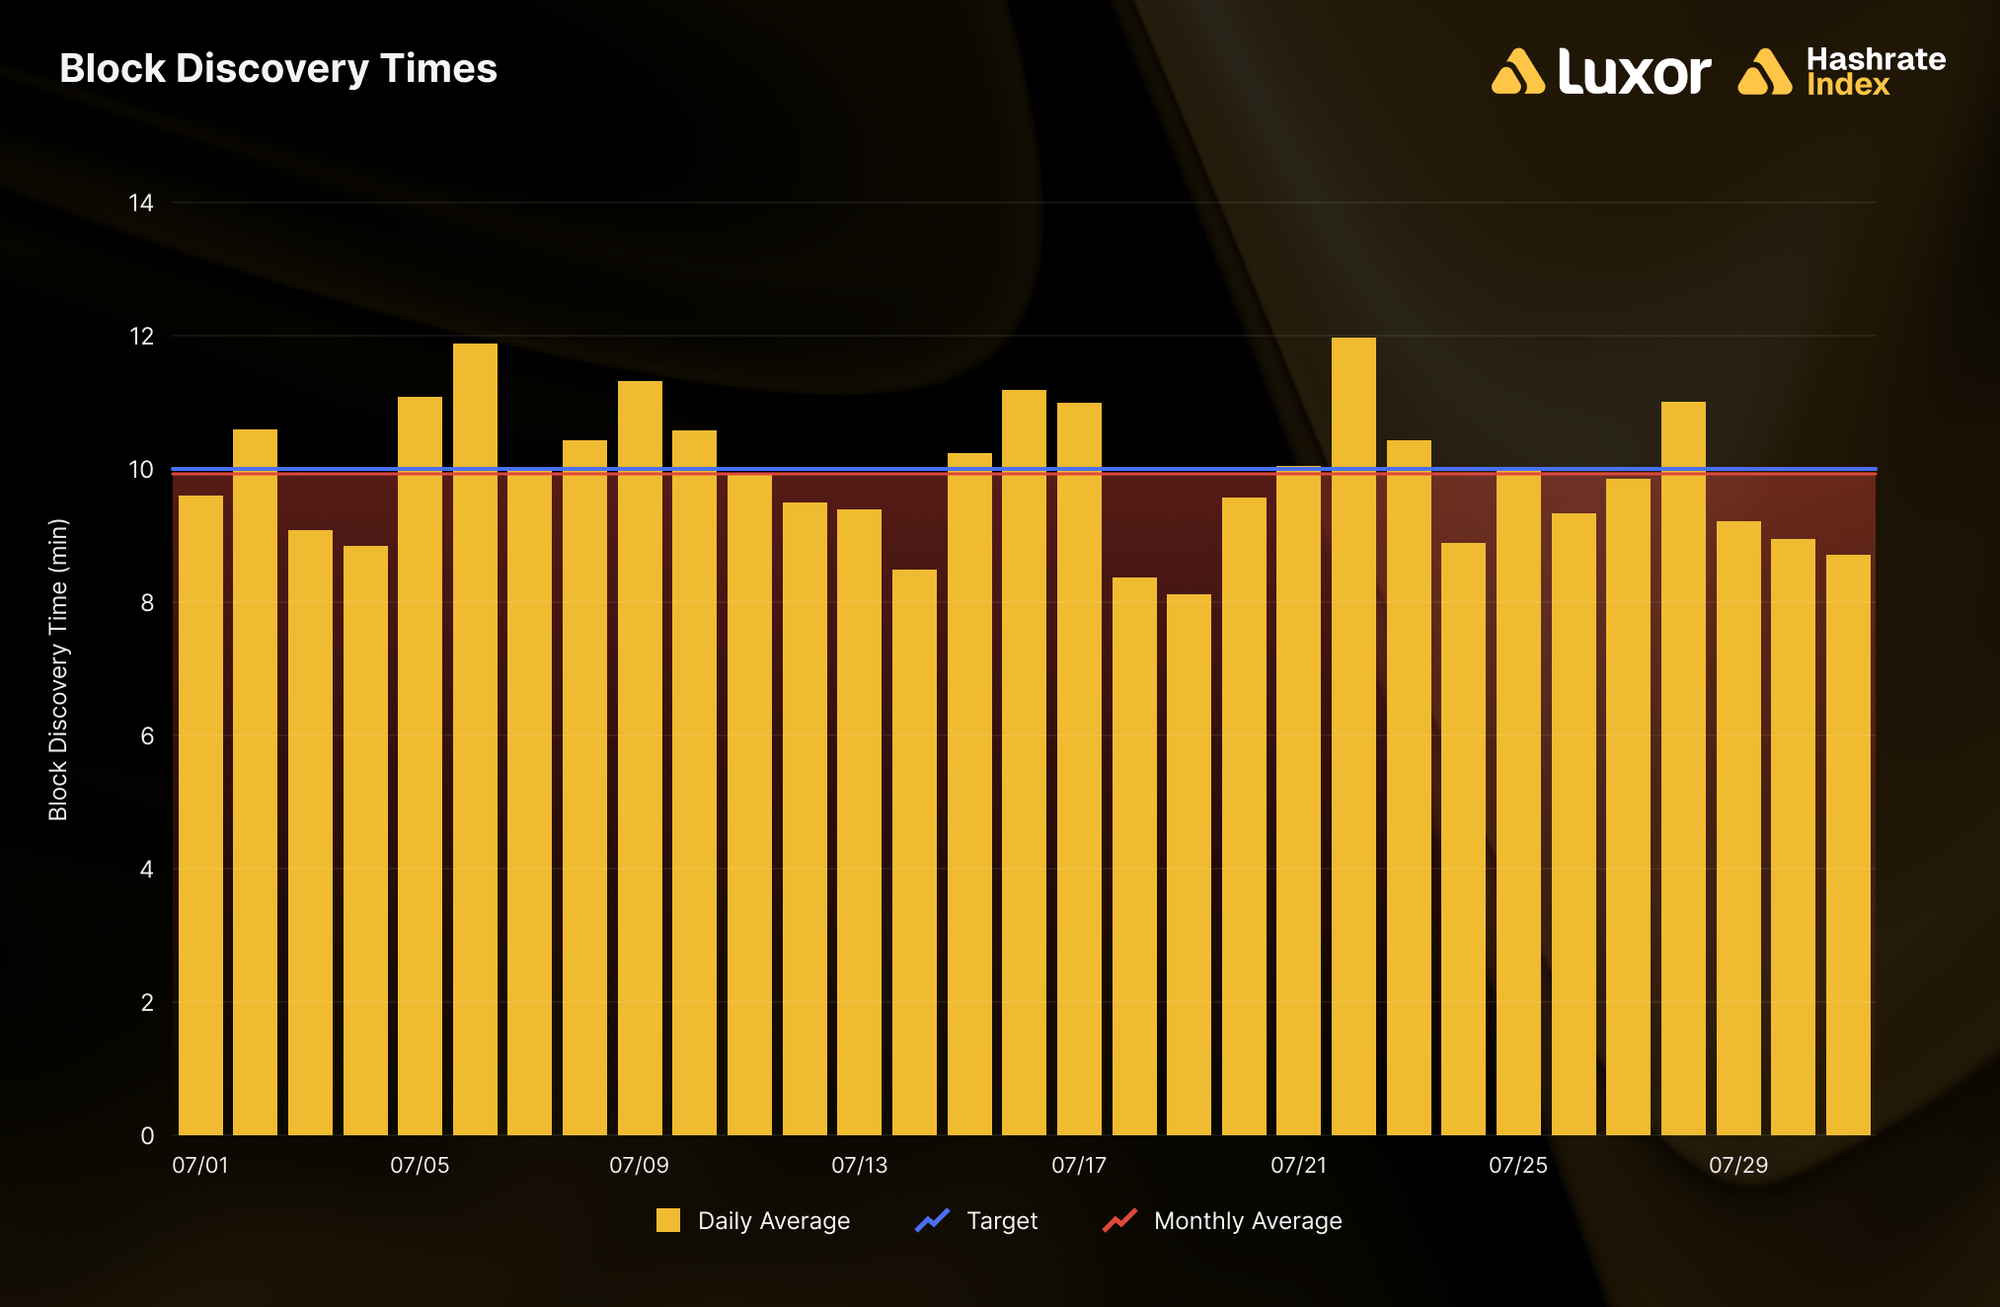
Mining revenue per unit of electricity consumed recovered with hashprice. Implied energy hashprice averaged ~$108/MWh for fleets under 14 J/TH, ~$79/MWh for 14–19 J/TH fleets, ~$59/MWh for 19–25 J/TH fleets, and ~$41/MWh for 25–38 J/TH fleets. Against an estimated network-average power cost of ~$48/MWh, the 25–38 J/TH tier remained below breakeven for a second month.
Transaction Fees — An -8.3% Decline and a Closing Spike
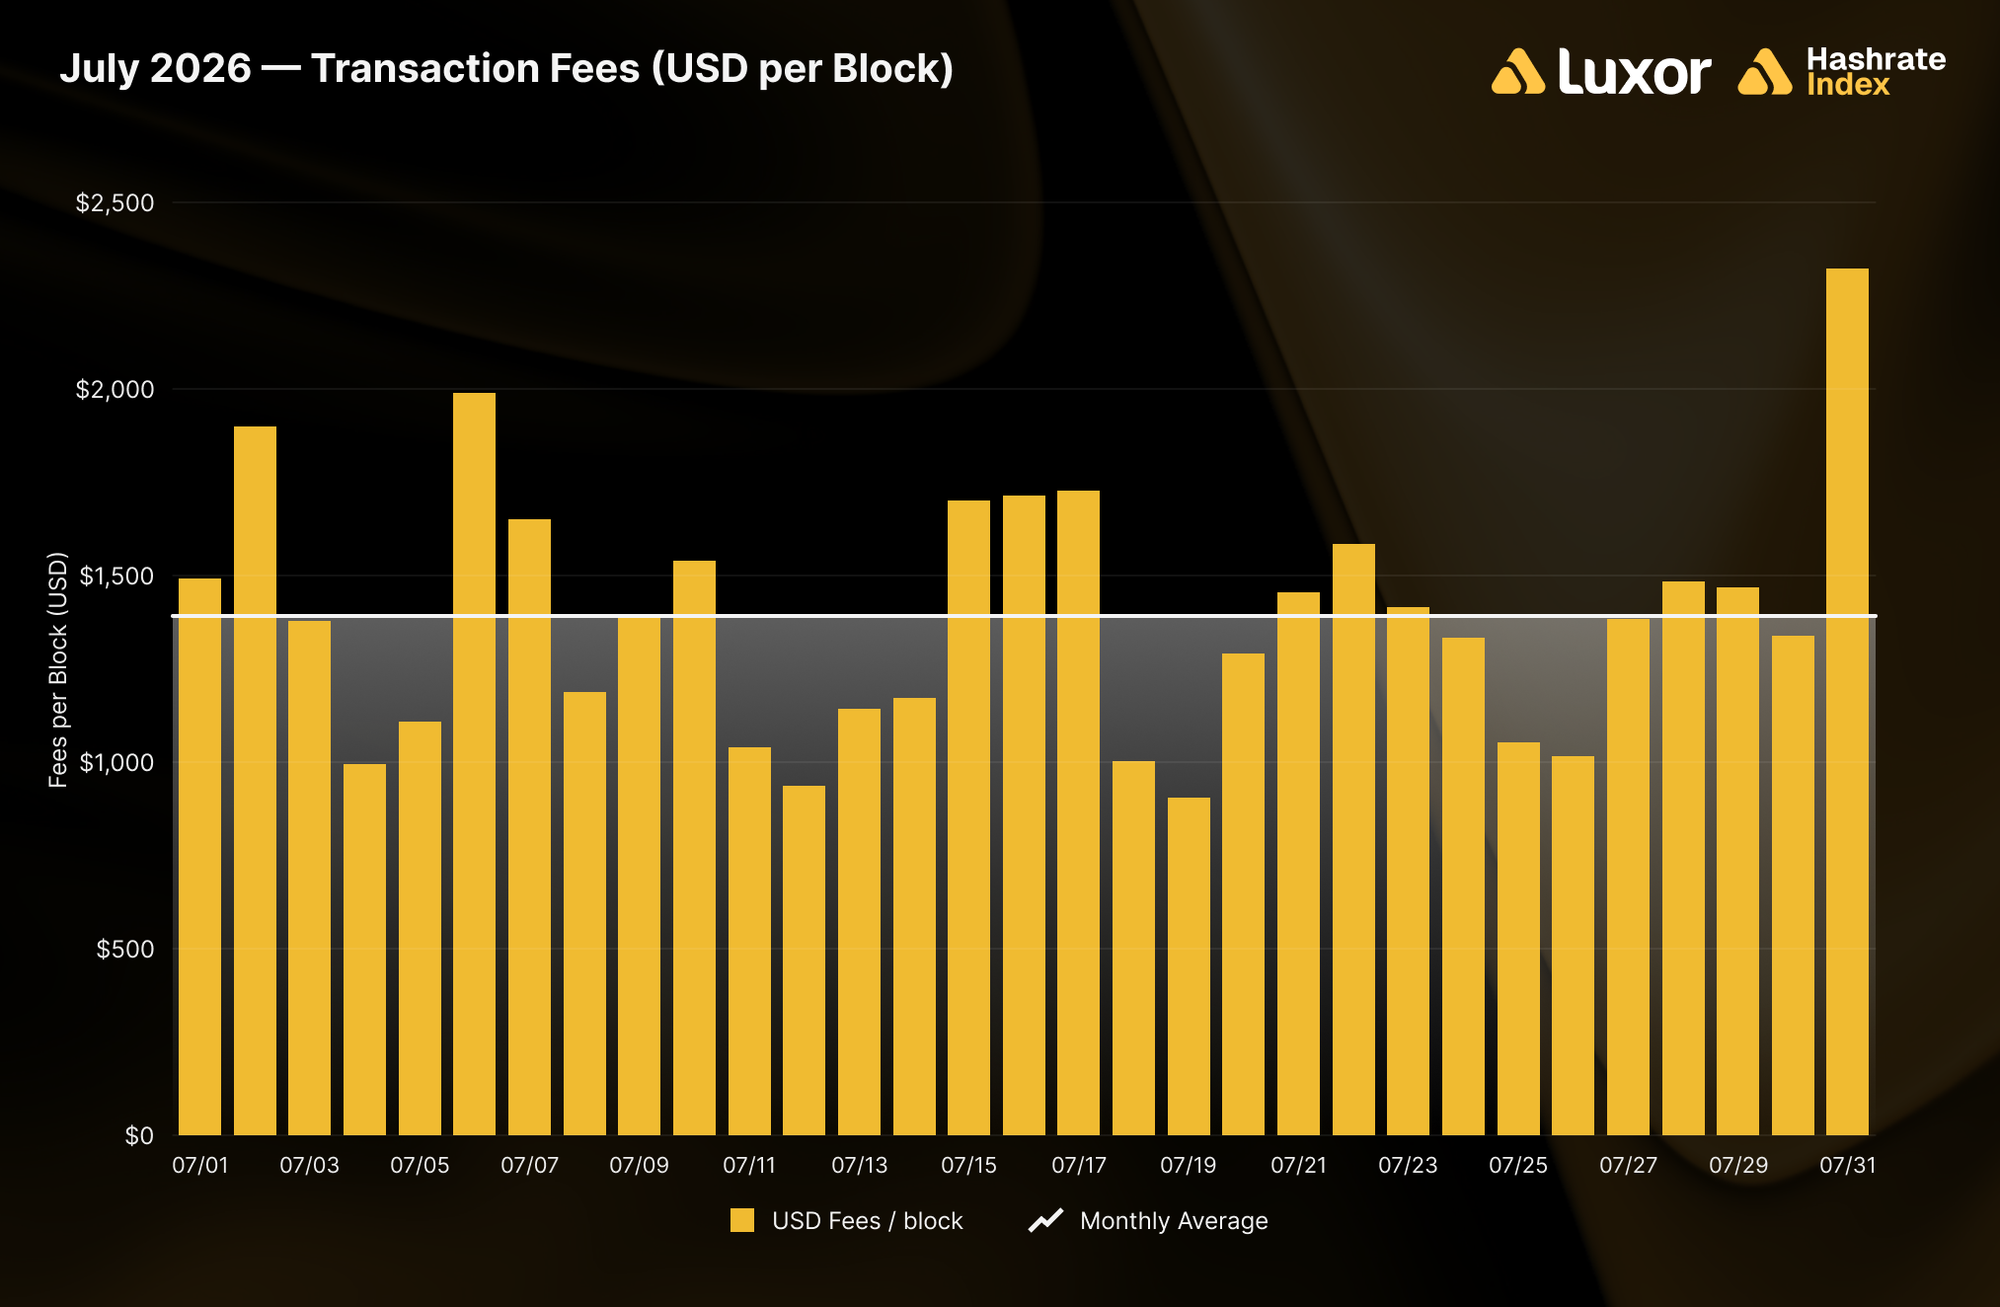
Average fee collection fell to 0.02185385 BTC per block in July (-8.3%), giving back most of June’s jump (+22.6%). Fees accounted for ~0.69% of total block rewards, down from ~0.76% in June and below 1% for a thirteenth consecutive month — an unbroken trend since July 2025. In USD terms, average fee revenue per block was ~$1,391 (-8.0%), and estimated network-wide fee revenue was ~$6.21M.
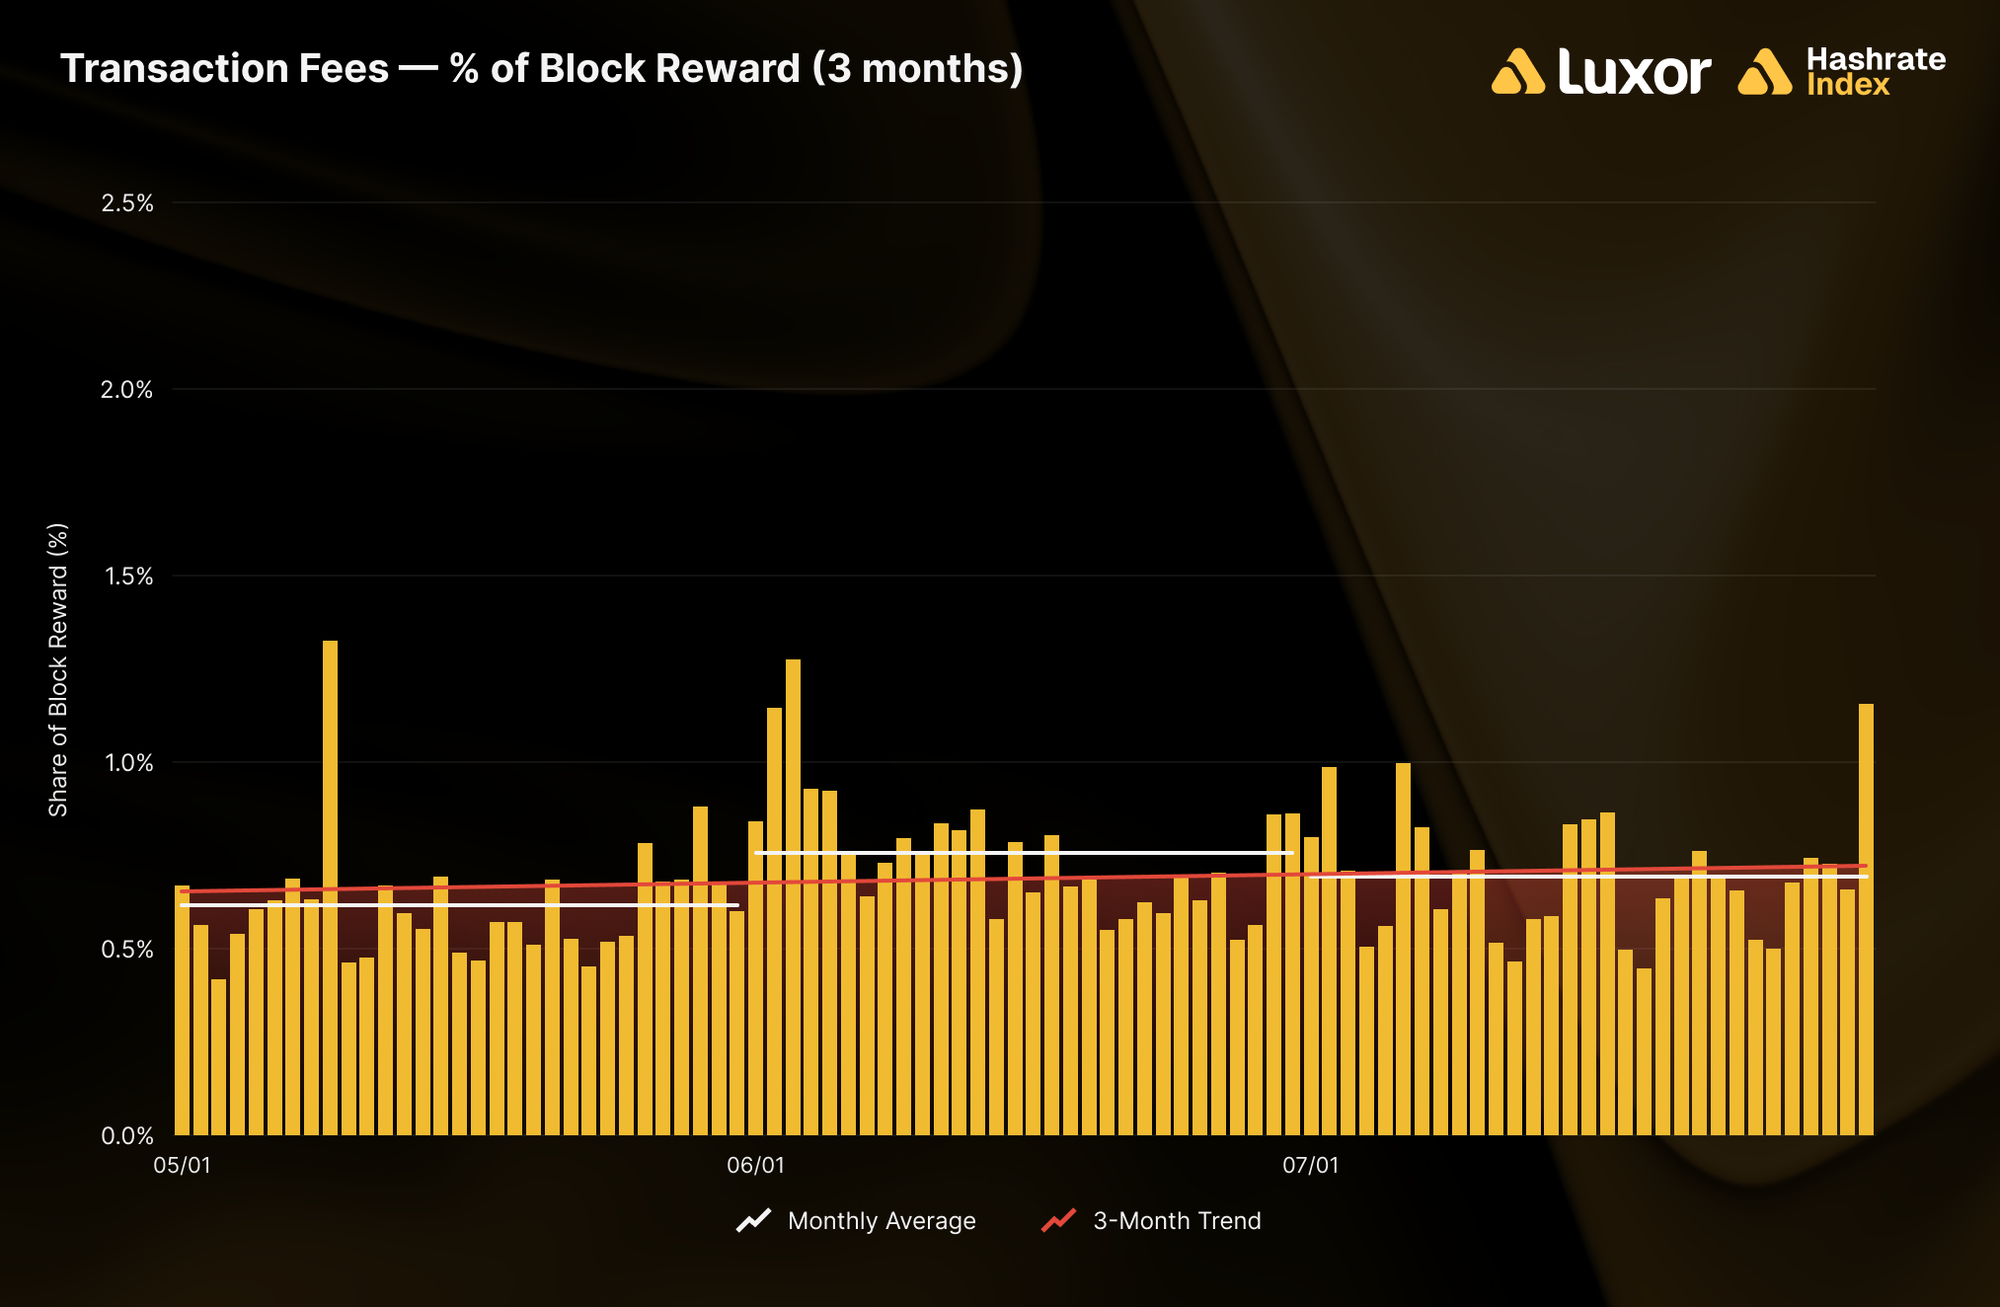
Transaction fee distribution was heavily skewed by a single day, and the cause was an exploit rather than organic demand. Fee collection peaked at 0.03652691 BTC per block on July 31, 67% above the monthly average.
On July 30, attackers began sweeping bitcoin out of wallets generated on vulnerable Coldcard hardware wallets, exploiting a firmware error released in March 2021 that made seed generation fall back to a weak software random number generator instead of the device's hardware entropy source. This effectively collapsed key strength from an intended 128–256 bits to as little as 40–80 bits on older devices, which could be brute-forced without physical access. It eventually happened.
The first sweep moved roughly 594 BTC out of about 500 wallets into a single consolidation address in 25 minutes, and three further waves followed over the next four days, reaching roughly 1,816 BTC (~$116M) from more than 5,200 addresses. This explains what would otherwise look contradictory: July 31 saw the month’s highest fee revenue per block with its lowest transaction count (3,891 versus a 4,678 monthly average). Sweeping thousands of compromised addresses into a handful of consolidation addresses produces a small number of input-heavy transactions, so blockspace was filled with few very large (heavy) transactions rather than many ordinary ones. Miners captured the fee competition either way. Funds are still being swept as of early August.
BTC Hashprice — At an 11-Month High
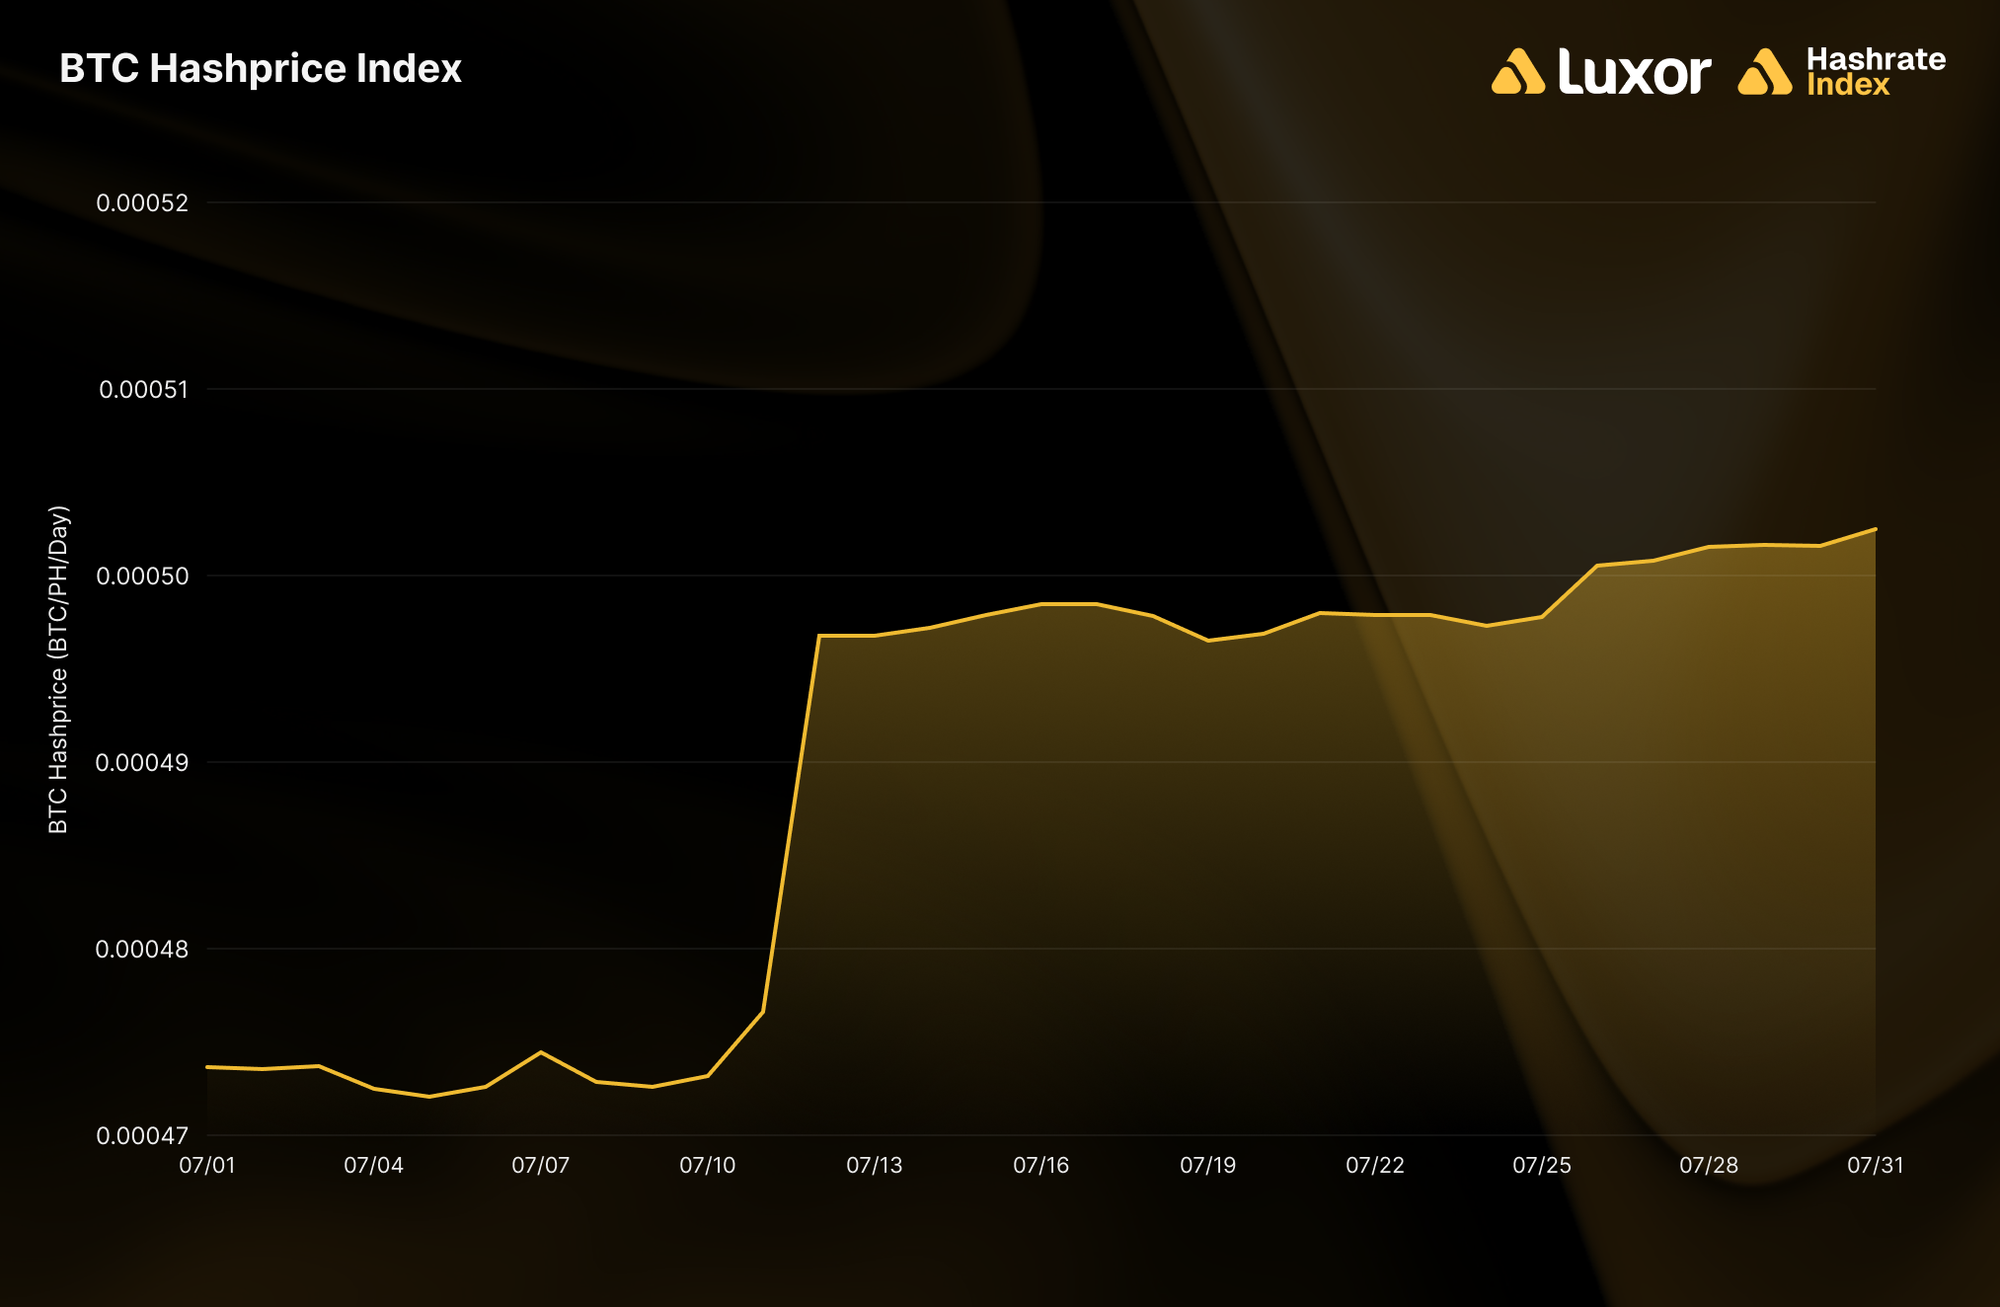
Monthly average BTC hashprice rose from 0.00048032 to 0.00048974 BTC per PH/s/day (+2.0%), its highest since August 2025’s 0.00049107 BTC. Two network parameters pulled in opposite directions: average difficulty fell -2.2%, more than offsetting the -8.3% decline in fees.
Intra-month, BTC hashprice tracked difficulty in steps. It opened at 0.00047363 BTC, dipped to a low of 0.00047208 BTC, stepped up at the July 11 adjustment, and closed at 0.00050247 BTC (+6.1%). Where June gave back two-thirds of its mid-month jump, July held every gain into the month-end.
July 2026 Hashrate Market Activity
Our analysis of the July 2026 hashrate market focuses on two key points: how the July 2026 hashrate contract traded in previous months and how the forward curve shifted in July, based on pricing for forward hashrate during the month.
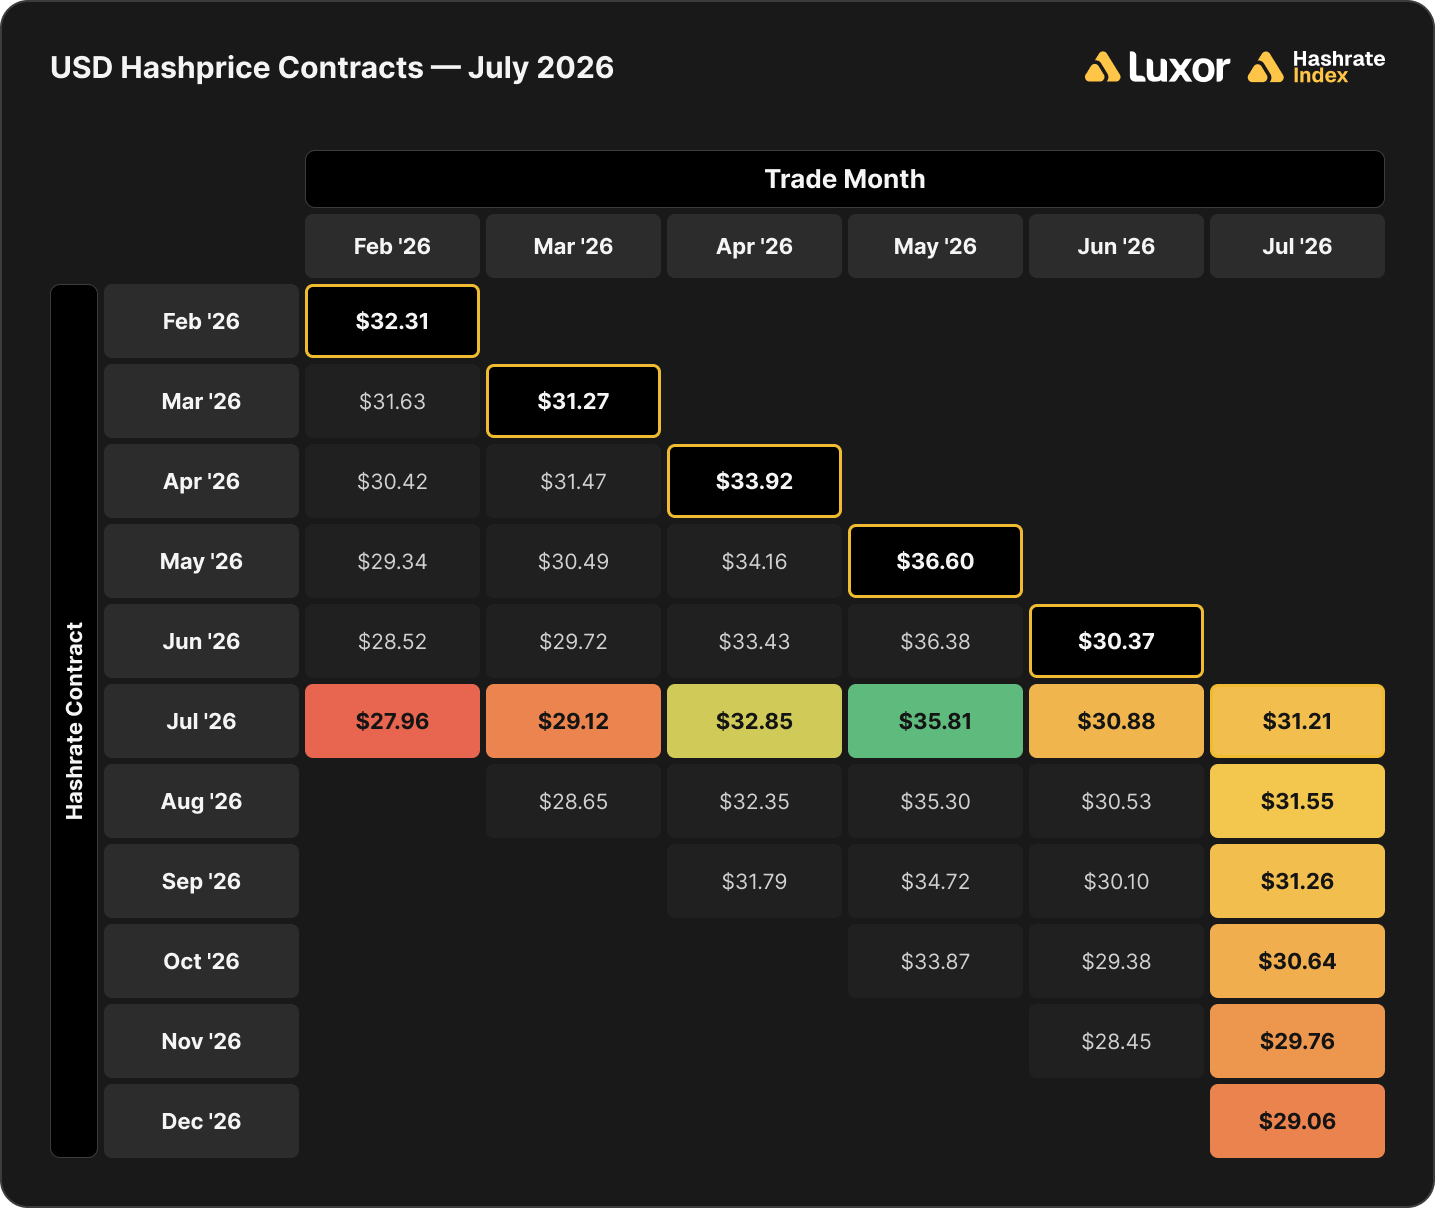
The two tables below show the evolution of Luxor’s USD and BTC-denominated hashrate forward markets from February 2026–July 2026. Rows represent specific monthly contracts, while columns represent each trading month. Cell values indicate the average monthly mid-market hashprice — except for the bold highlighted main diagonal — which shows actual spot hashprice settlement in each month.
This table summarizes both the trading history of the July 2026 USD-denominated contract (colored row) and the forward curve in July (colored column).
This table summarizes both the trading history of the July 2026 BTC-denominated contract (colored row) and the forward curve in July (colored column).
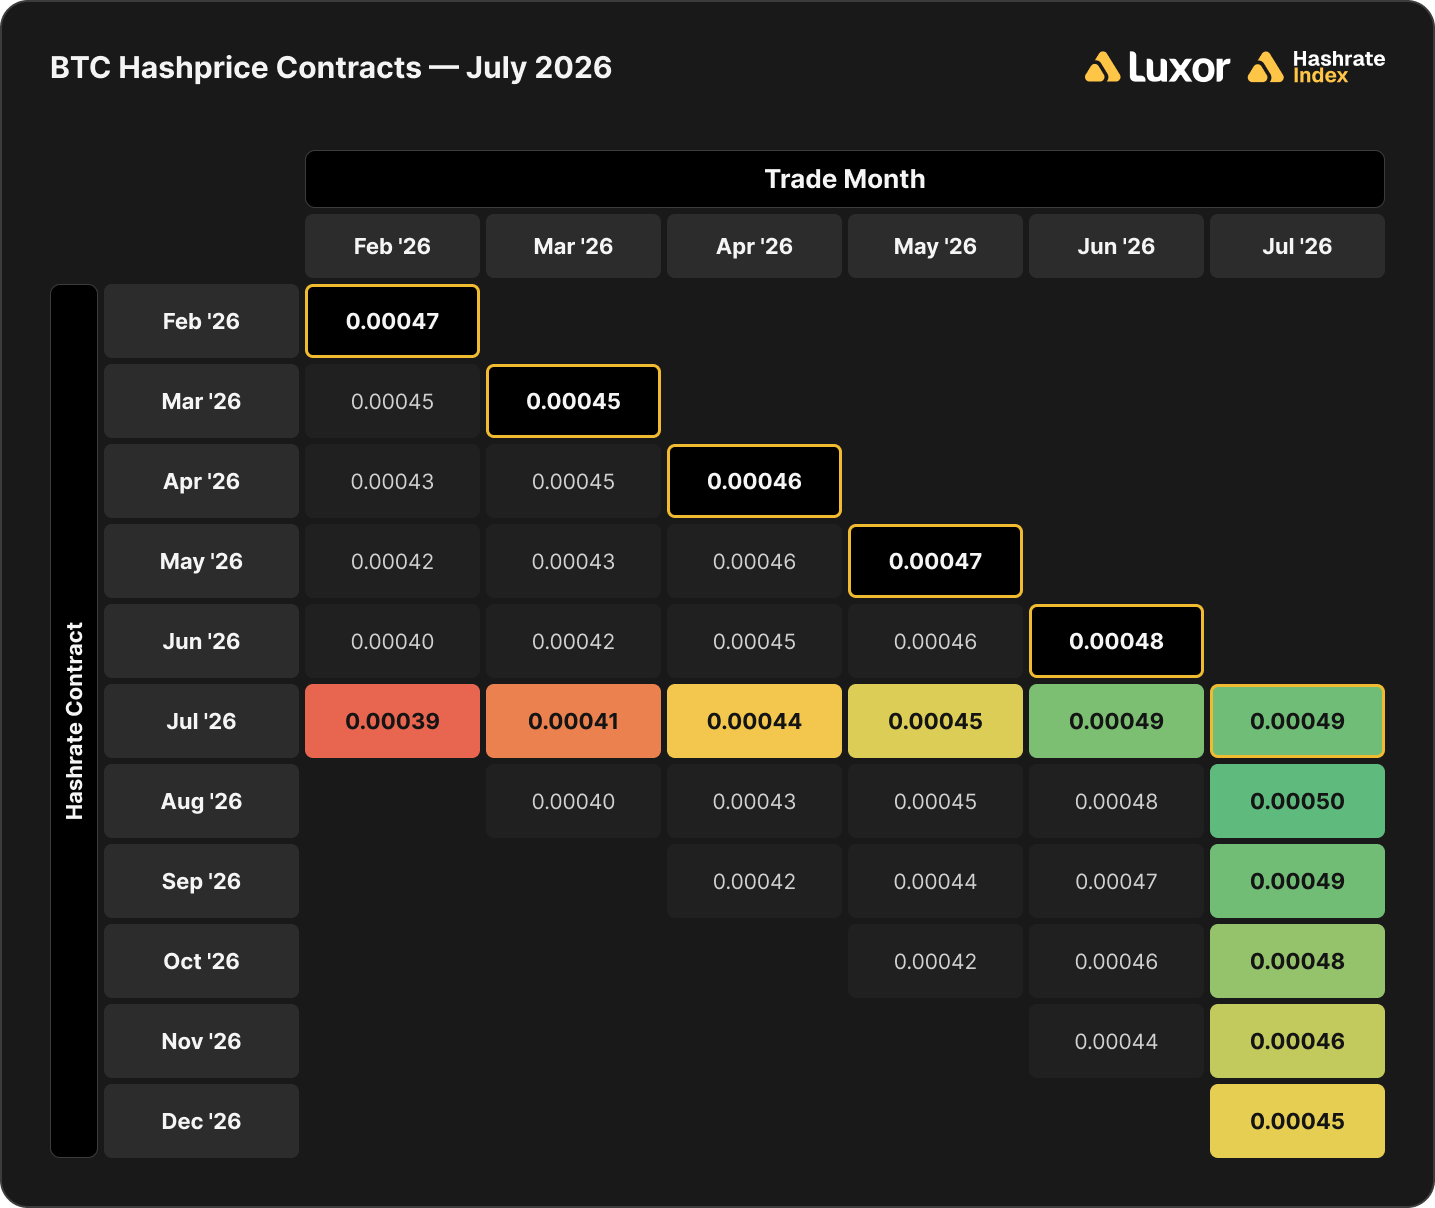
Note: all values (except for the bold highlighted main diagonal) shown in figures represent mid-market rates, the midpoint of the best bid and ask on Luxor's Non-Deliverable Hashrate Forward market. The bold highlighted main diagonal shows actual spot hashprice settlement in each month, measured by Luxor’s Bitcoin Hashprice Index.
The table below shows the type of market participants on the buy and sell side of Luxor’s deliverable (DF) and non-deliverable hashrate forward (NDF) market. In July, lenders were active on the buy side of the DF market, while public and private miners used the contract to sell forward, receive financing, and expand their fleet.
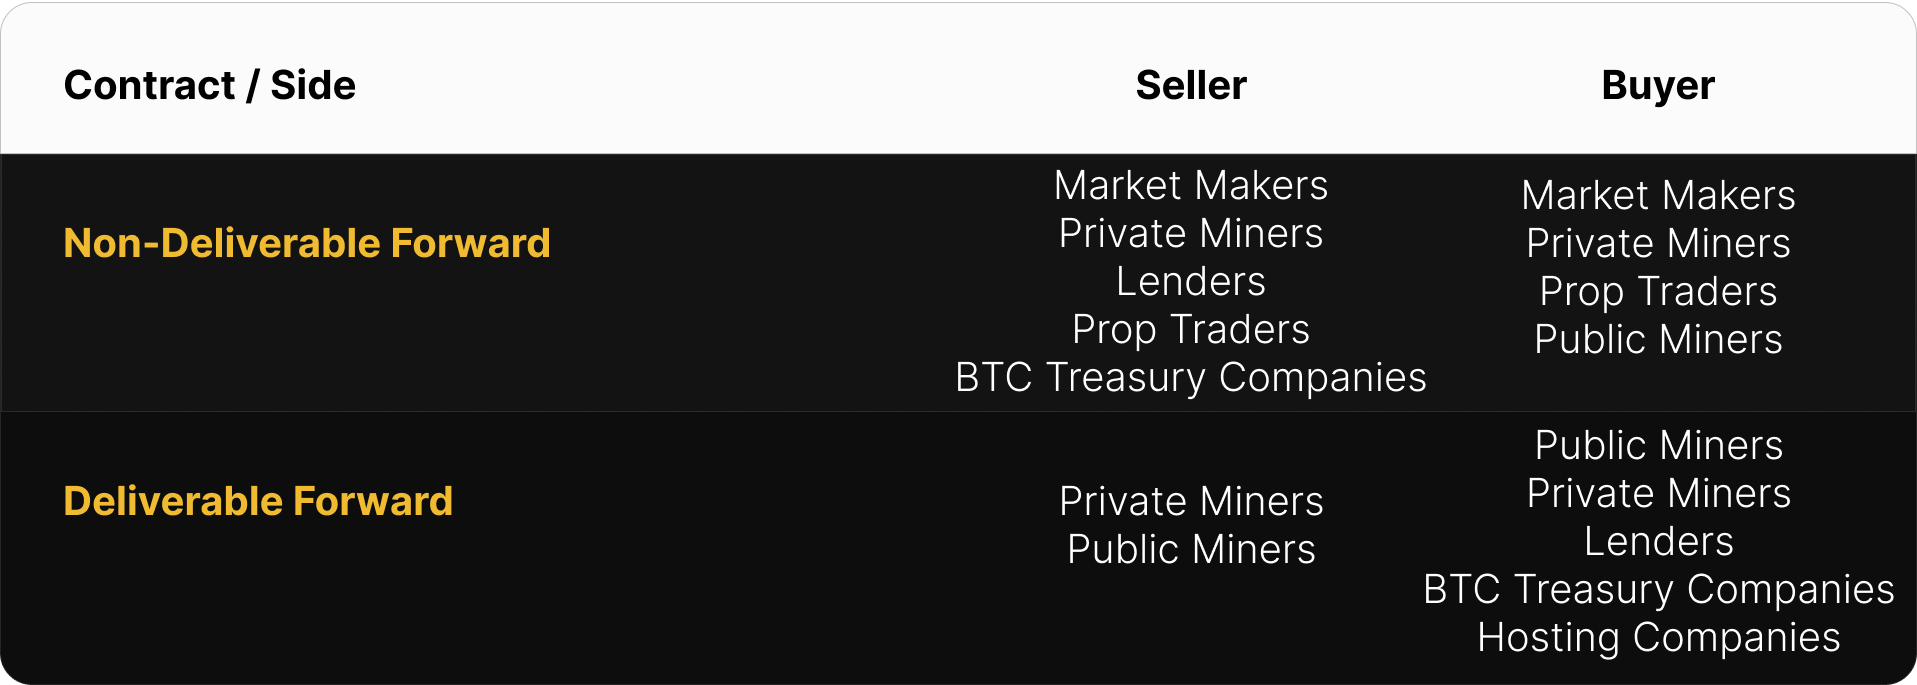
Because DFs are prepaid, they typically trade below NDFs to compensate buyers for credit risk and the cost of capital. Pairing a DF with an offsetting NDF can lock in that spread as a fixed BTC-denominated yield for lenders or a fixed financing cost for miners.
This strategy was used by lenders and Bitcoin treasury companies (buy DF & sell NDF) to earn a BTC-denominated return and by miners (sell DF & buy NDF) to obtain non-dilutive financing. In July 2026, that yield (cost of capital) was 6–13% annualized.
How July 2026 Hashrate Traded
July split the two contract denominations more sharply than June. USD sellers won at two of five horizons (hedges struck at April and May’s higher forward levels), while BTC sellers lost at all five as spot settlement came in at the highest BTC hashprice since August 2025.
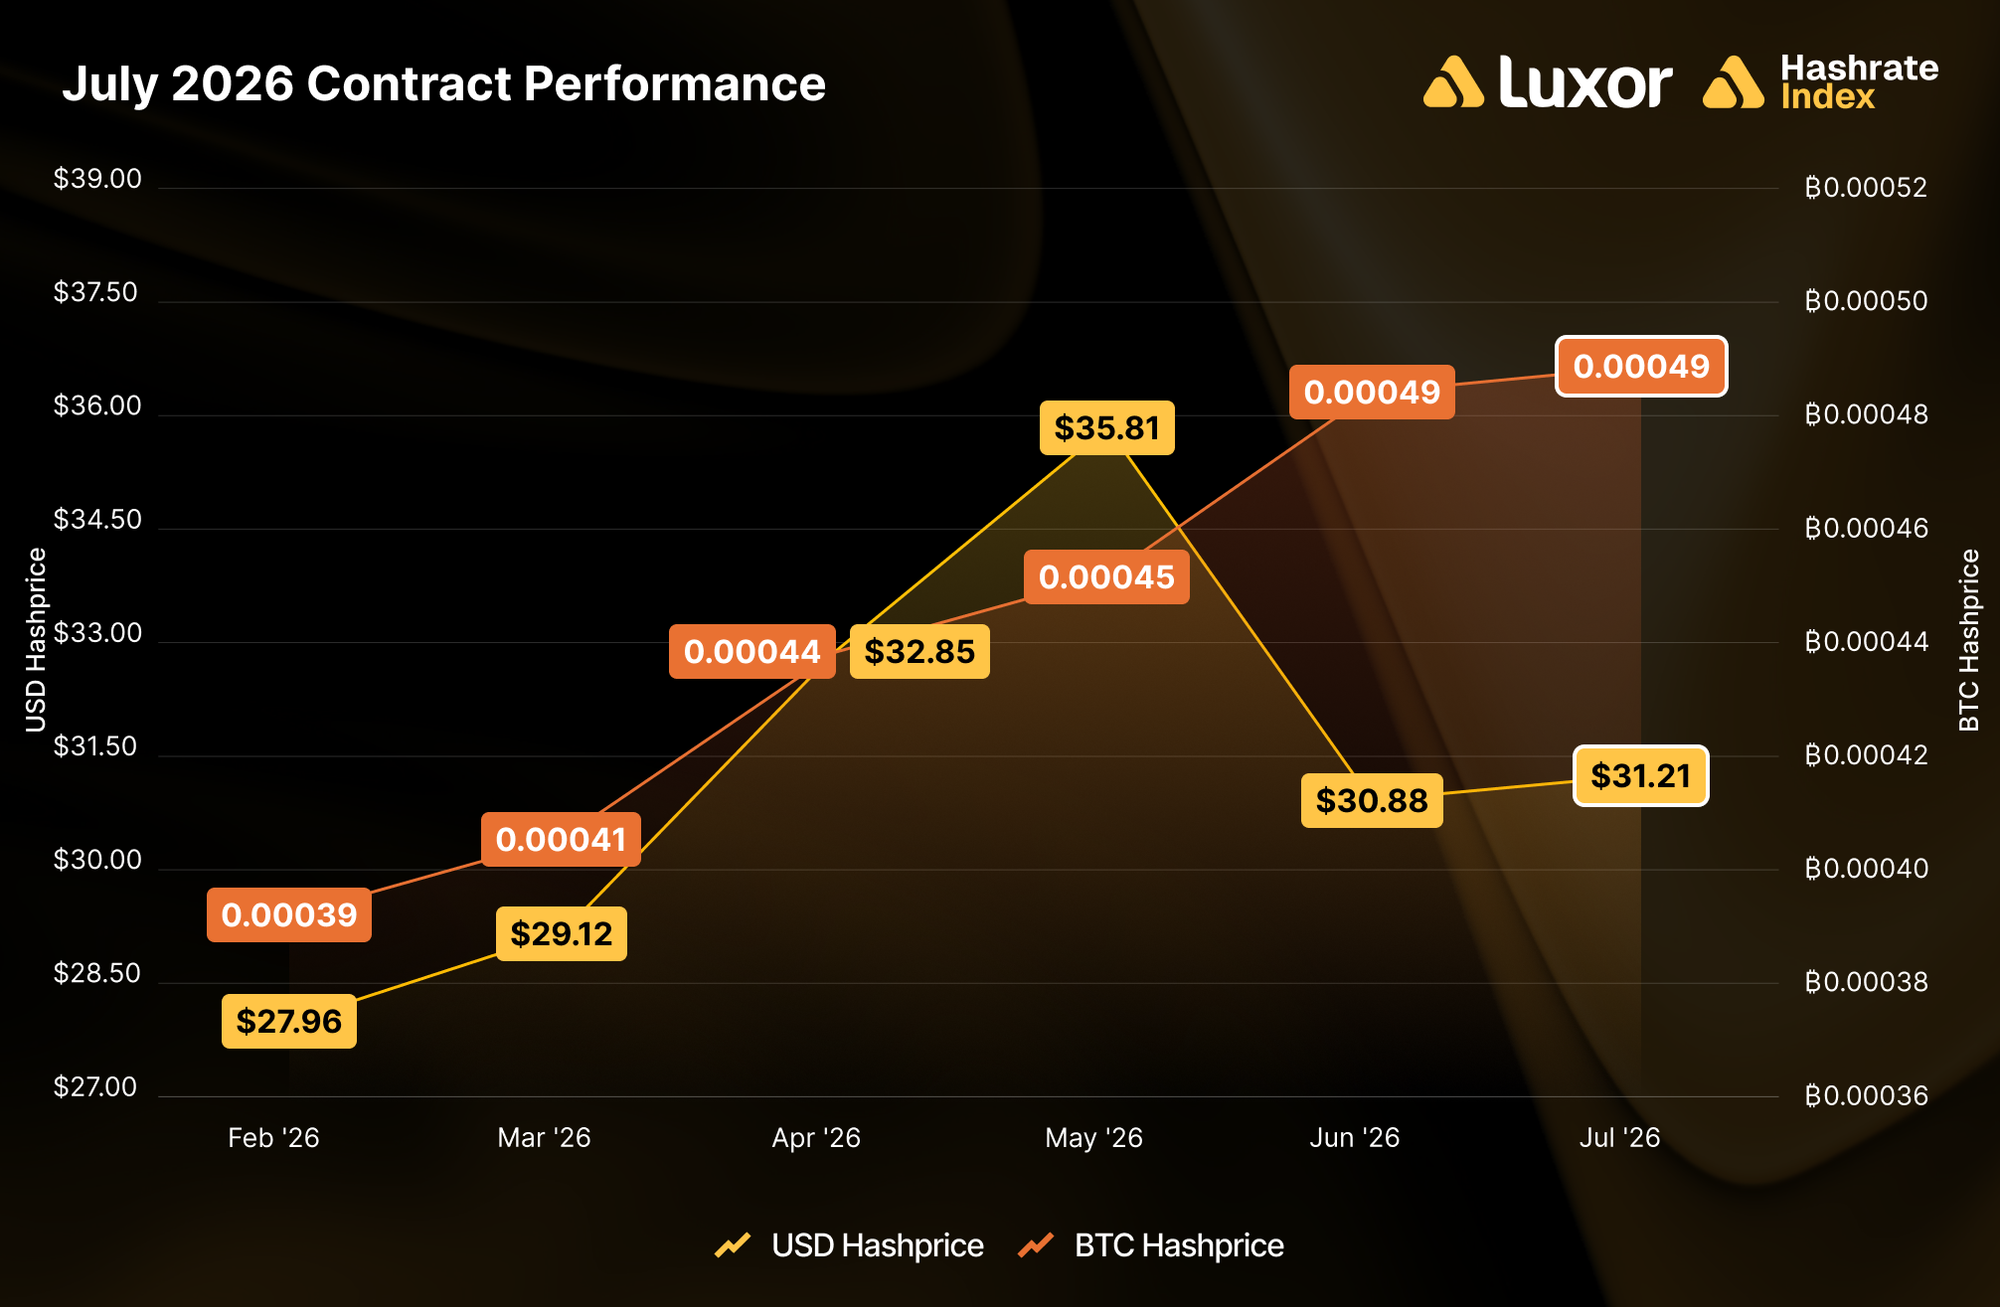
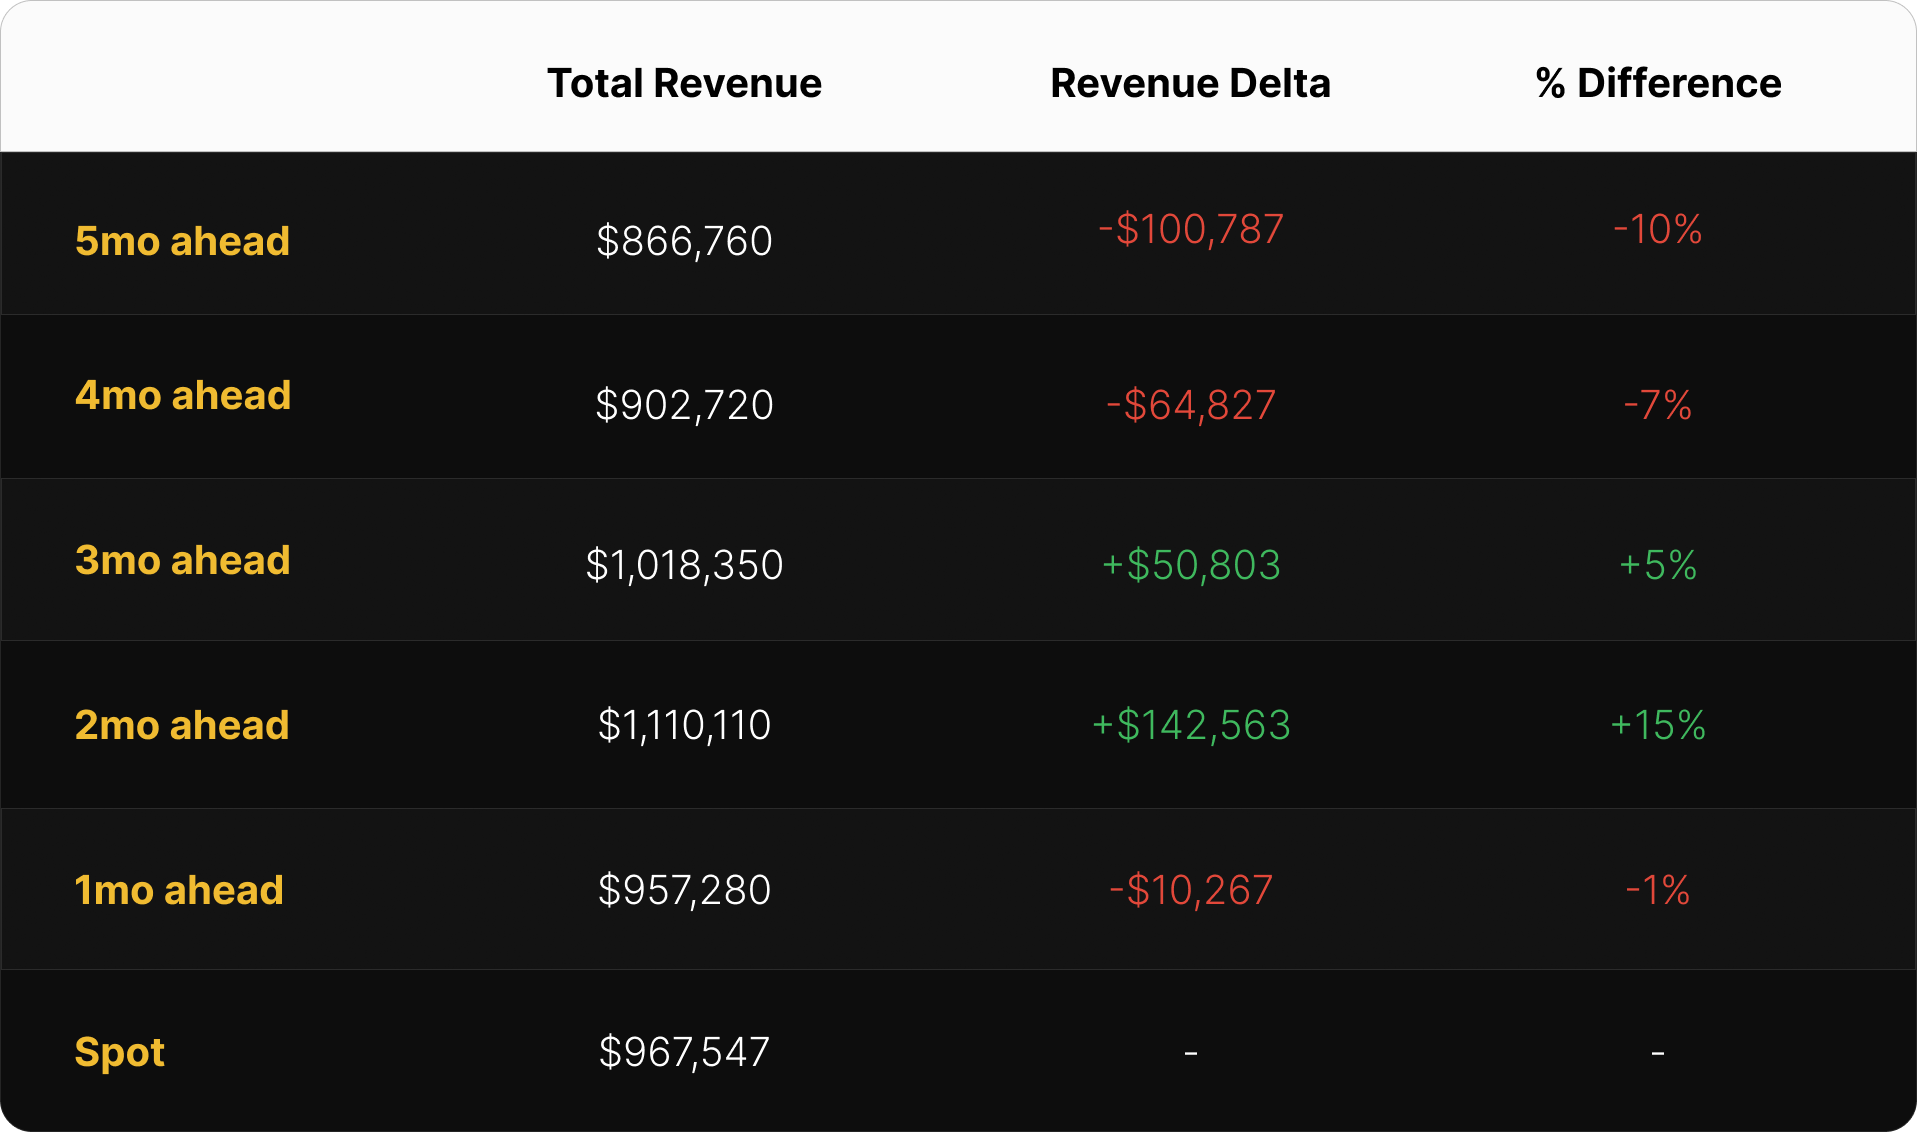
In USD-denominated contracts, sellers beat spot (FPPS) at two of five horizons. Forward sellers of the July 2026 contract locked in between $27.96 and $35.81 per PH/s/day against spot settlement of $31.21. The winners were the hedges struck before June’s capitulation repriced the forward curve:
- The two-month-ahead sale in May at $35.81 (+14.7%, or +$142,563 on 1 EH/s)
- The three-month-ahead sale in April at $32.85 (+5.3%, or +$50,803 on 1 EH/s)
The losers were hedges struck on either side of that: the five-month sale in February at $27.96 (-10.4%) and the four-month in March at $29.12 (-6.7%), both inside the February–March all-time-low trough, and the one-month sale in June at $30.88 (-1.1%), struck after June’s collapse had already marked the curve down. Selling forward paid only where the curve had not yet priced in the summer slowdown.
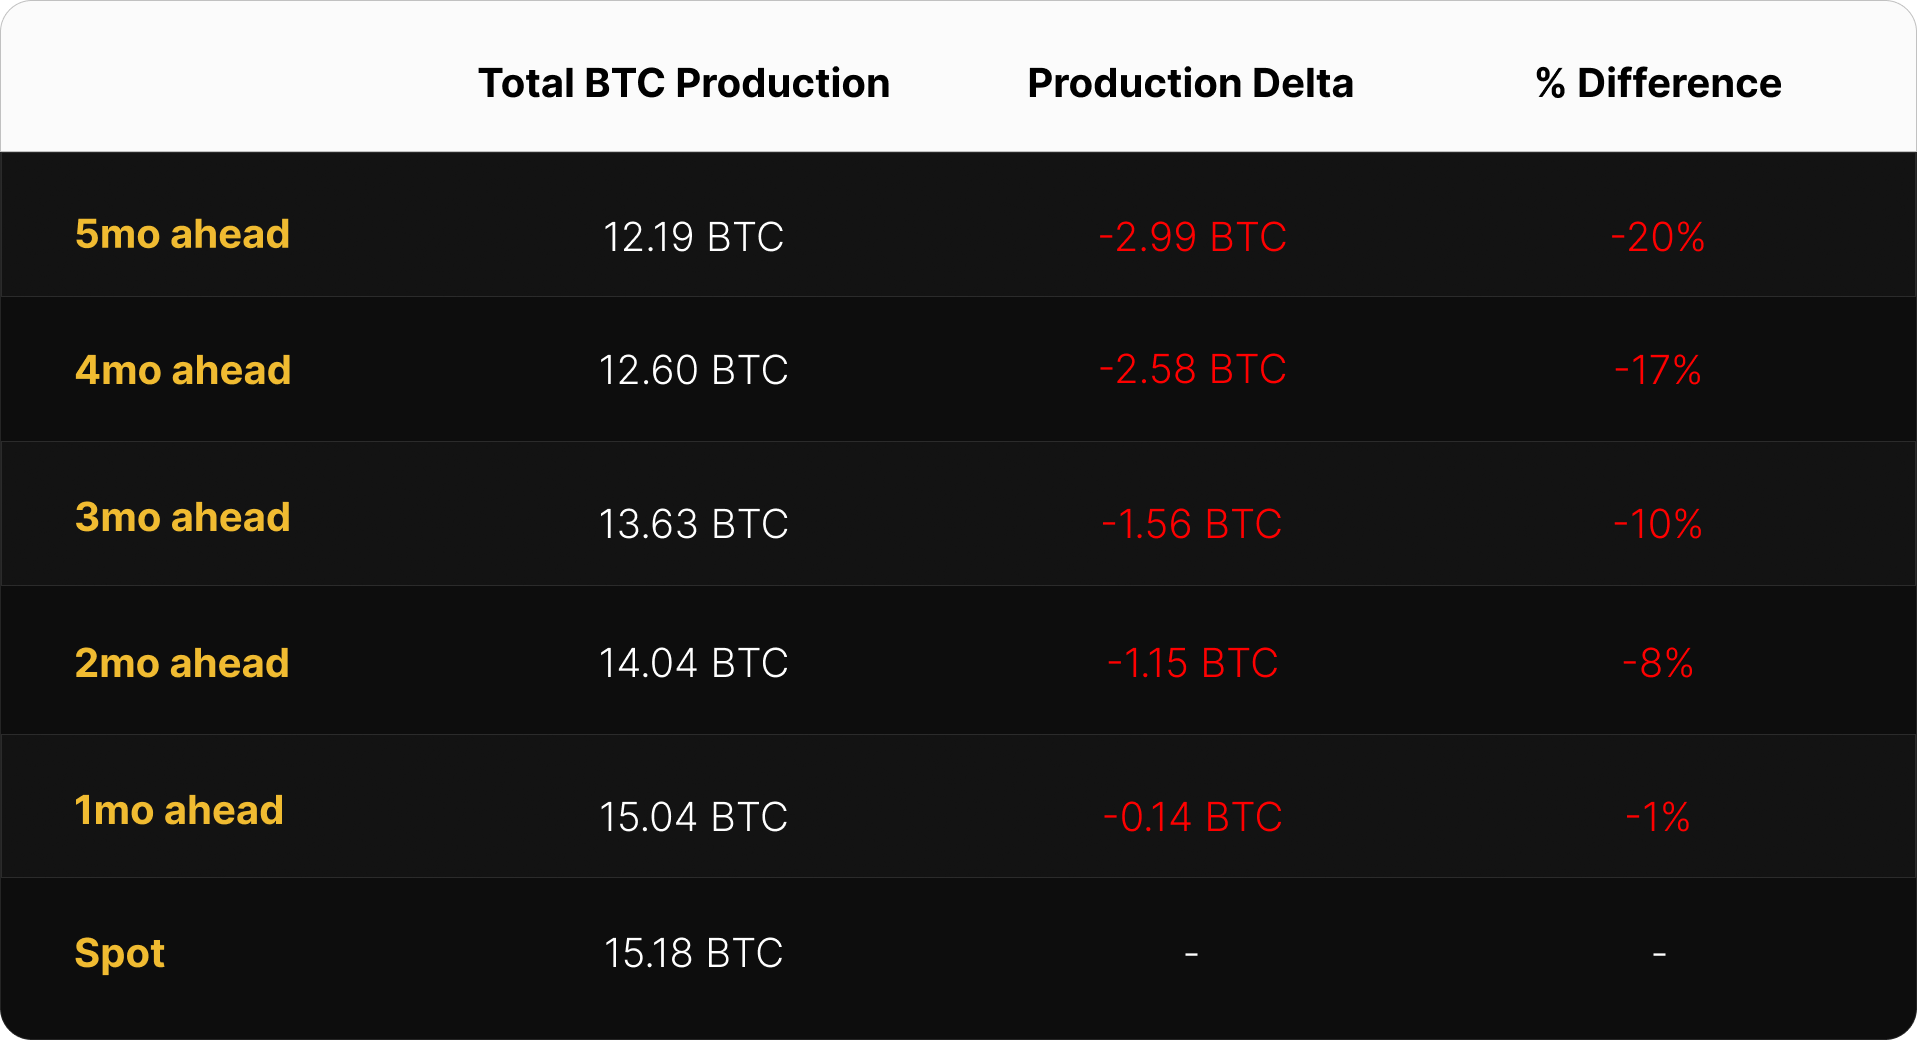
In BTC-denominated contracts, buyers won across the board for a fourth consecutive month, and by the widest margin of the four. Forward sellers received between 0.00039 BTC and 0.00049 BTC per PH/s/day, all below or at spot settlement of 0.00049 BTC. The -5.71% difficulty decline over July lifted BTC-denominated revenue faster than the forward curve had expected. The spread compressed sharply toward the front: five-month sellers (locked in February) gave up -19.7% versus spot, while one-month sellers (locked in June) gave up just -0.9%.
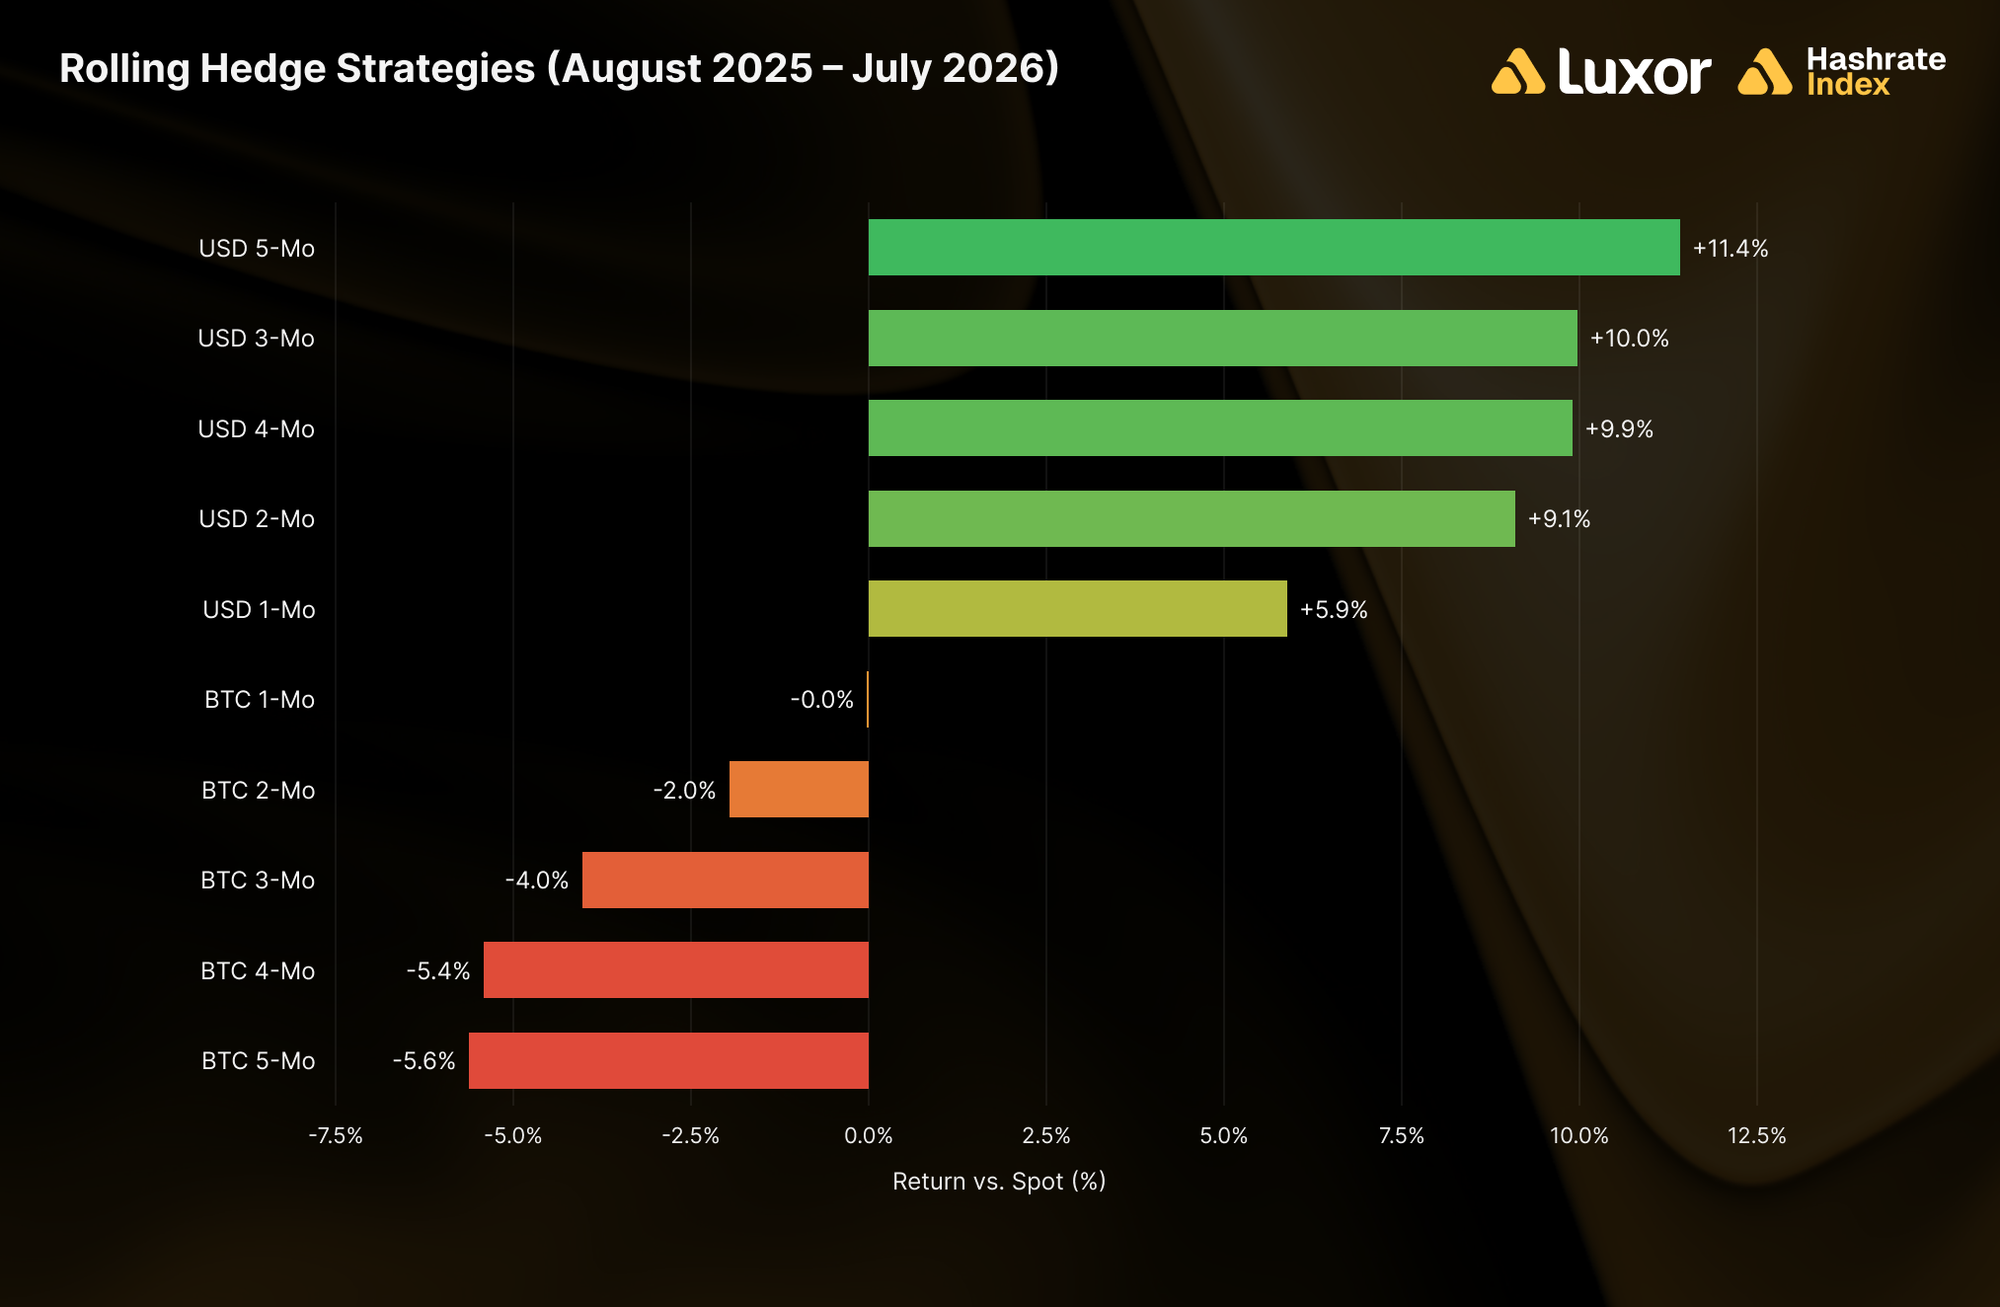
Zooming out, we examine rolling hedge performance across two windows: the trailing twelve months (August 2025–July 2026) and since the April 2024 halving (May 2024–July 2026).
Over the past year, rolling USD-denominated hedging strategies extended their sweep: every USD horizon beat spot (FPPS) mining, led by the 5-month (+11.4%) and 3-month (+10.0%) rolls.
Rolling BTC-denominated strategies were flat to negative at every horizon, from 0.0% (1-month) to -5.6% (5-month). The reversal has been building all year: in April, BTC rolls still clustered between +0.07% and +1.02%, and by May they had slipped to -1.3% to +0.7%. Two months of falling difficulty have now pushed BTC hashprice settlements decisively above where the forward curve let sellers lock it in.
Extending the window back to the 2024 halving, every one of the ten strategies remains ahead of spot (FPPS). BTC-denominated rolls lead at the long end (+8.5% for 5-month), while the five USD horizons cluster tightly between +1.8% and +2.8%. The BTC long end has given back a lot of ground: the same 5-month roll stood at +12.5% in March and +11.4% in April, as difficulty growth that once rewarded it has stalled.
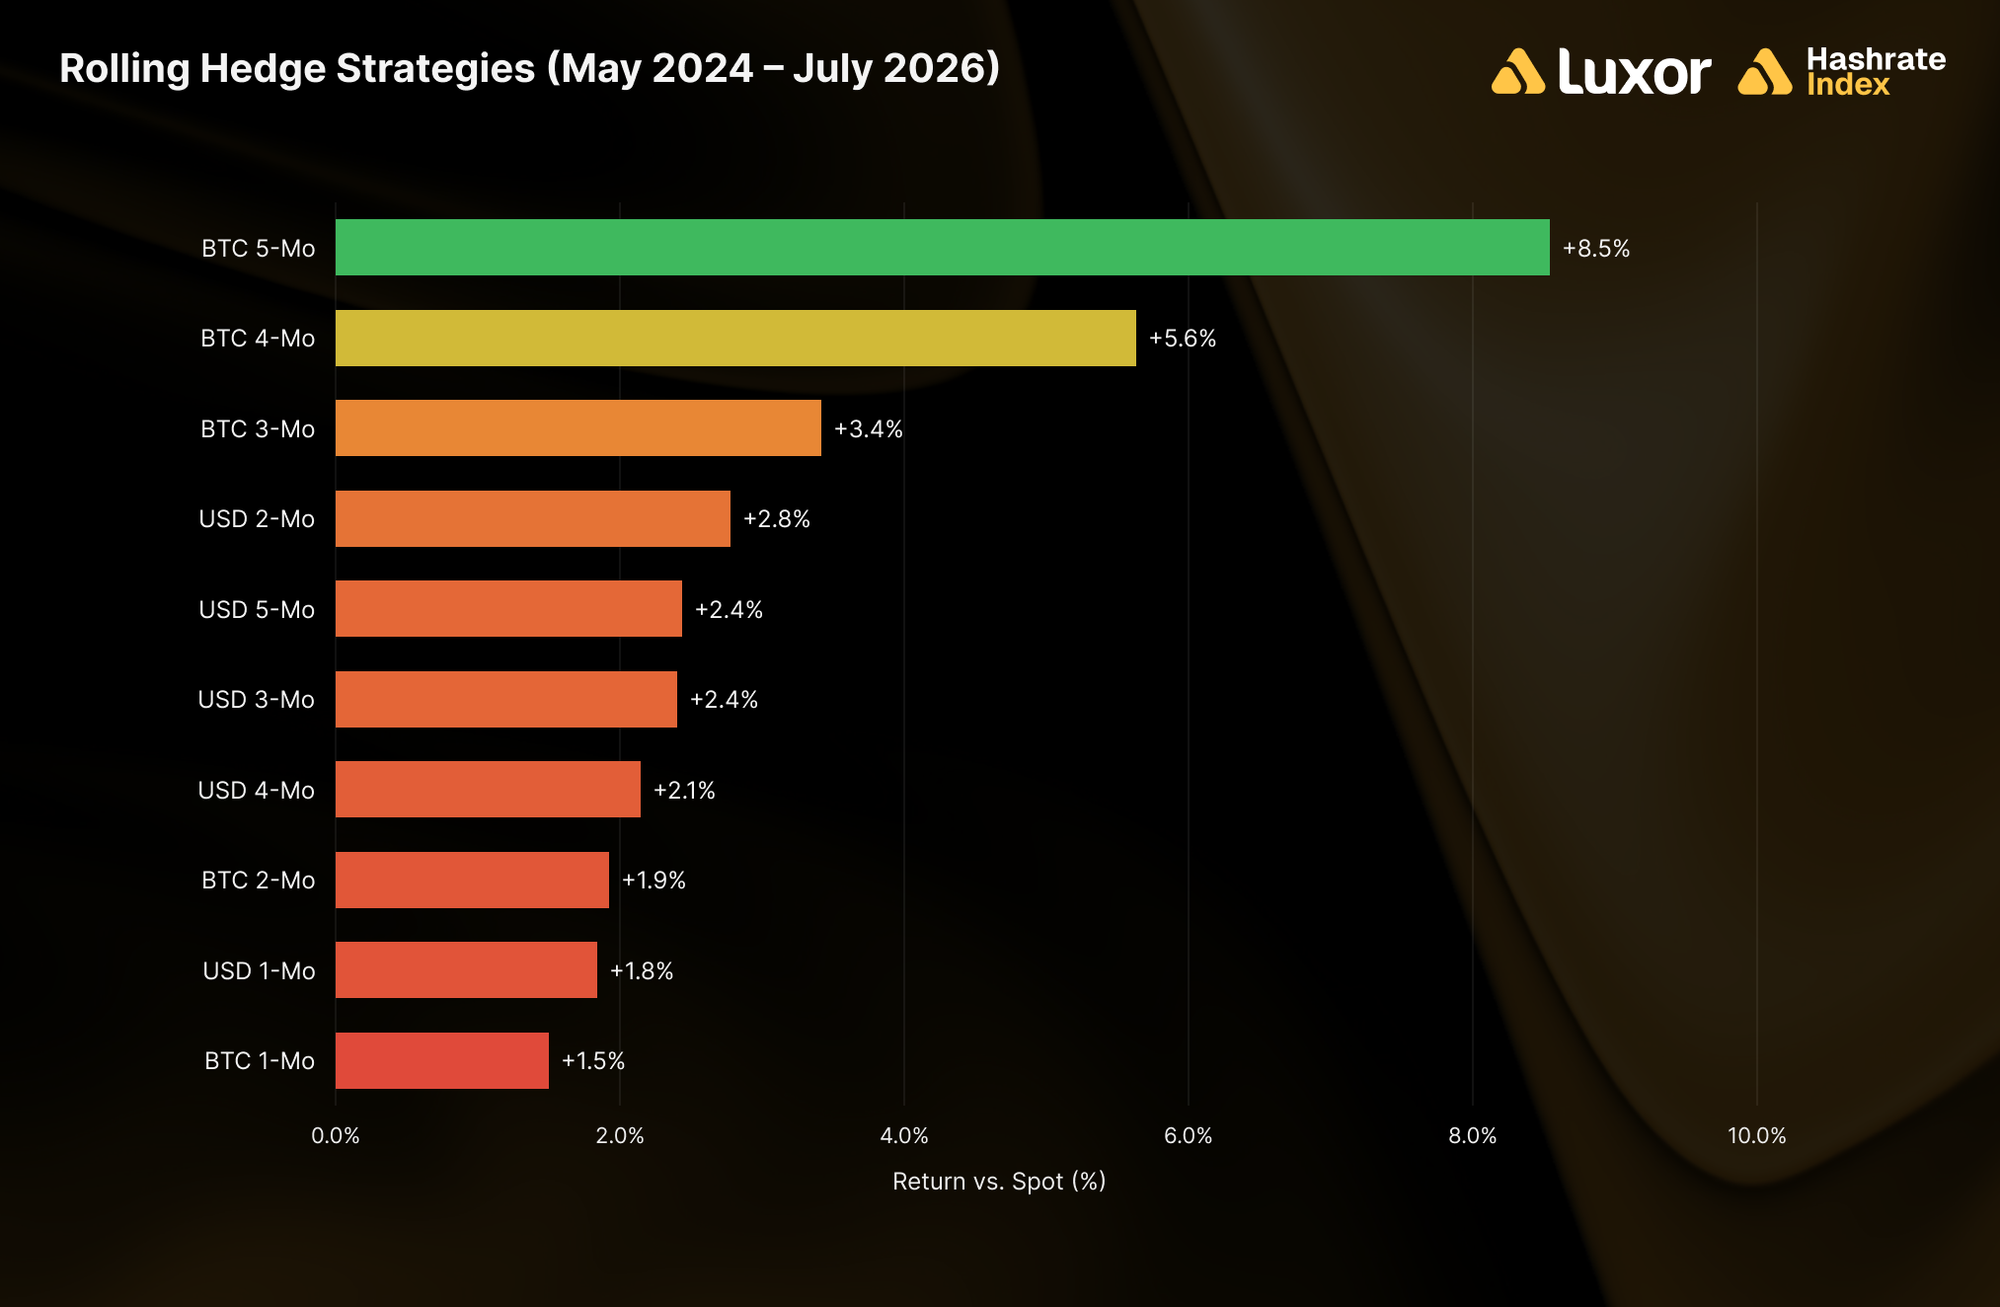
Which denomination outperforms when depends on whether BTC price or difficulty-plus-fees moves further than the forward market anticipated at the time of hedging. Through late 2025, difficulty outran expectations and BTC-denominated sellers captured the spread; since then, BTC price weakness has compressed USD hashprice below forward expectations and USD sellers have captured it. July is the clearest example yet of the second regime: a -5.71% difficulty decline handed BTC-denominated buyers every horizon, while USD sellers kept only the hedges struck before June repriced the curve. One observation across both windows continues to hold: as a group, forward sellers remain ahead of mining at spot (FPPS) since the halving.
Note: two important caveats apply to both windows. First, figures exclude fees and bid/ask spreads. Second, hedging is a cost of business rather than a revenue generation strategy. Hedgers willingly buy the certainty of predictable cash flows, which increases valuations, reduces capital costs, and ultimately attracts investments.
How Future Hashrate Traded in July 2026
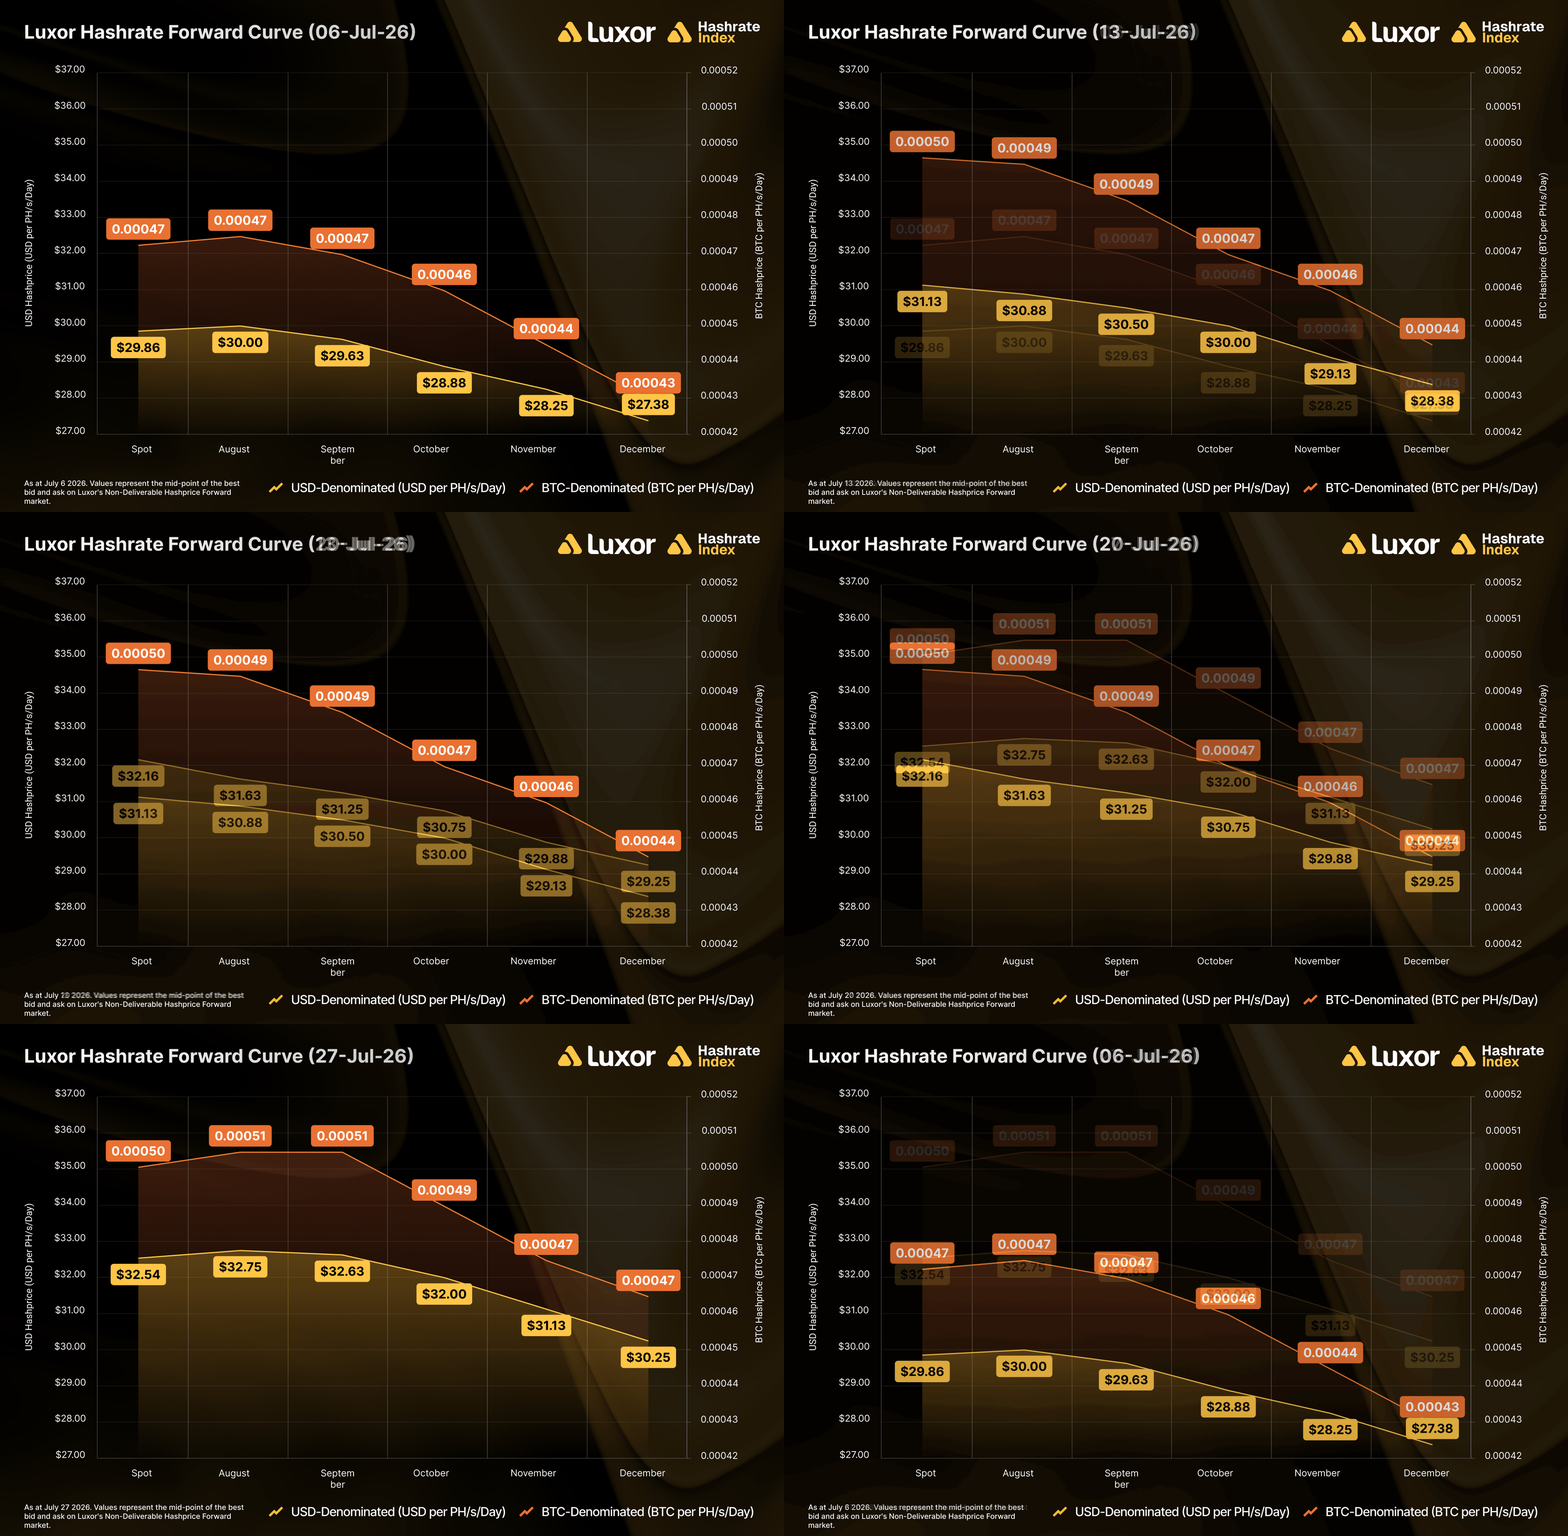
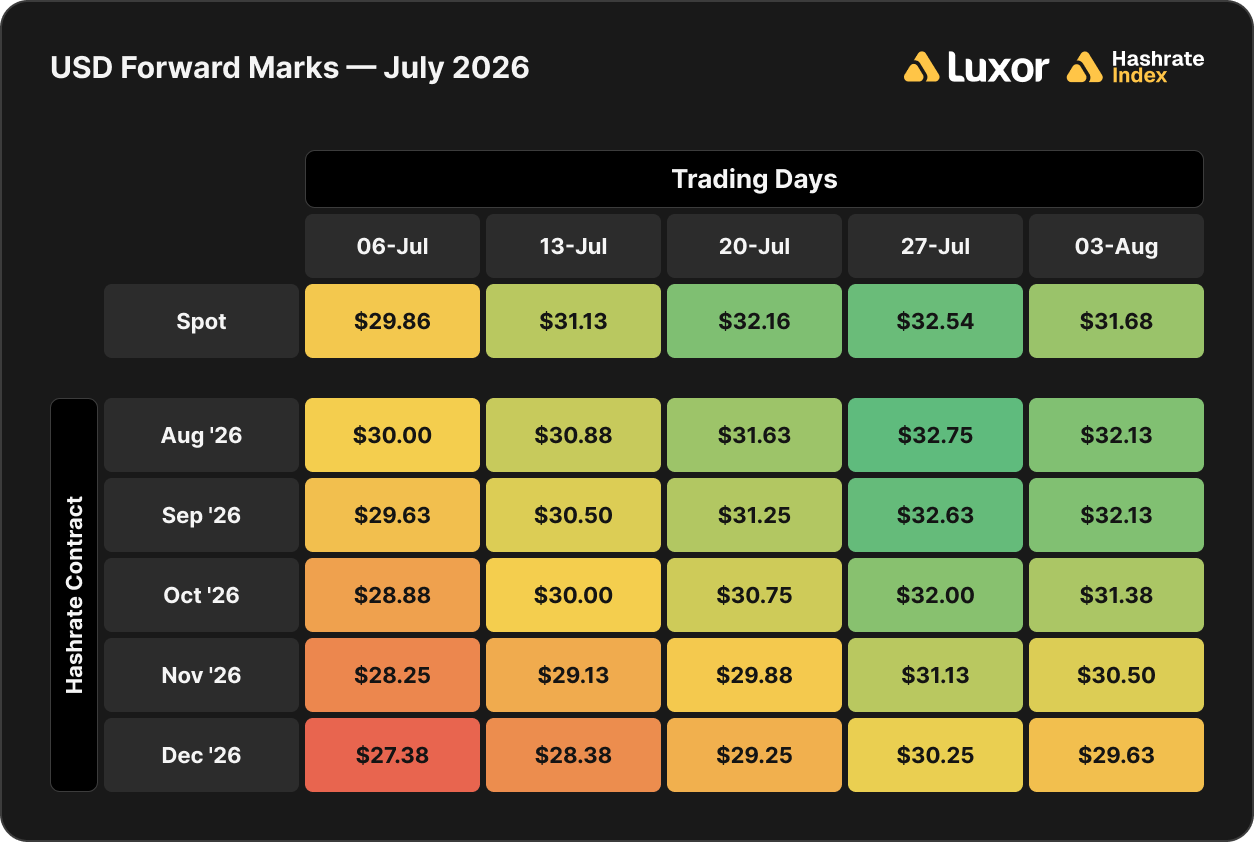
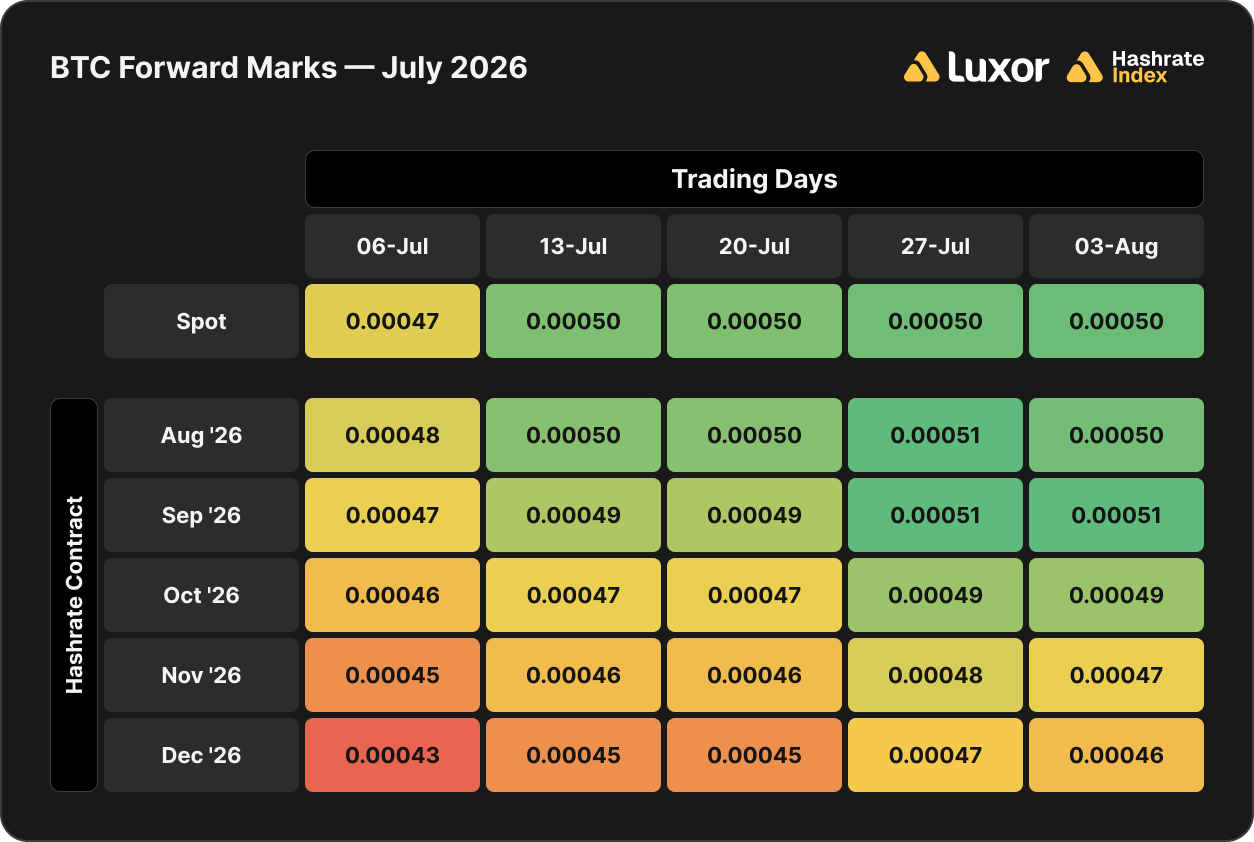
The two tables below summarize the evolution of hashrate forward markets during July 2026, for the subsequent five months from August 2026 to December 2026. Rows represent specific monthly contracts; columns represent specific trading days. Cell values are the average daily mid-market price, except for spot.
In July, the USD-denominated forward curve was marked up. Lock-in rates for August–December 2026 contracts rose +8.1% on average between July 6 and August 3 against a +6.1% gain in spot hashprice over the same span. Forwards rose faster than spot, indicating that the curve was not merely following hashprice, but rather raising its expectations for the months ahead.
The BTC-denominated curve moved the same way, rising +6.4% on average over the month. The forward market marked up its difficulty-and-fees path: after two consecutive downward adjustments, the curve conceded that the summer hashrate contraction it had only leaned toward in May and June was deeper and more persistent than initially expected.
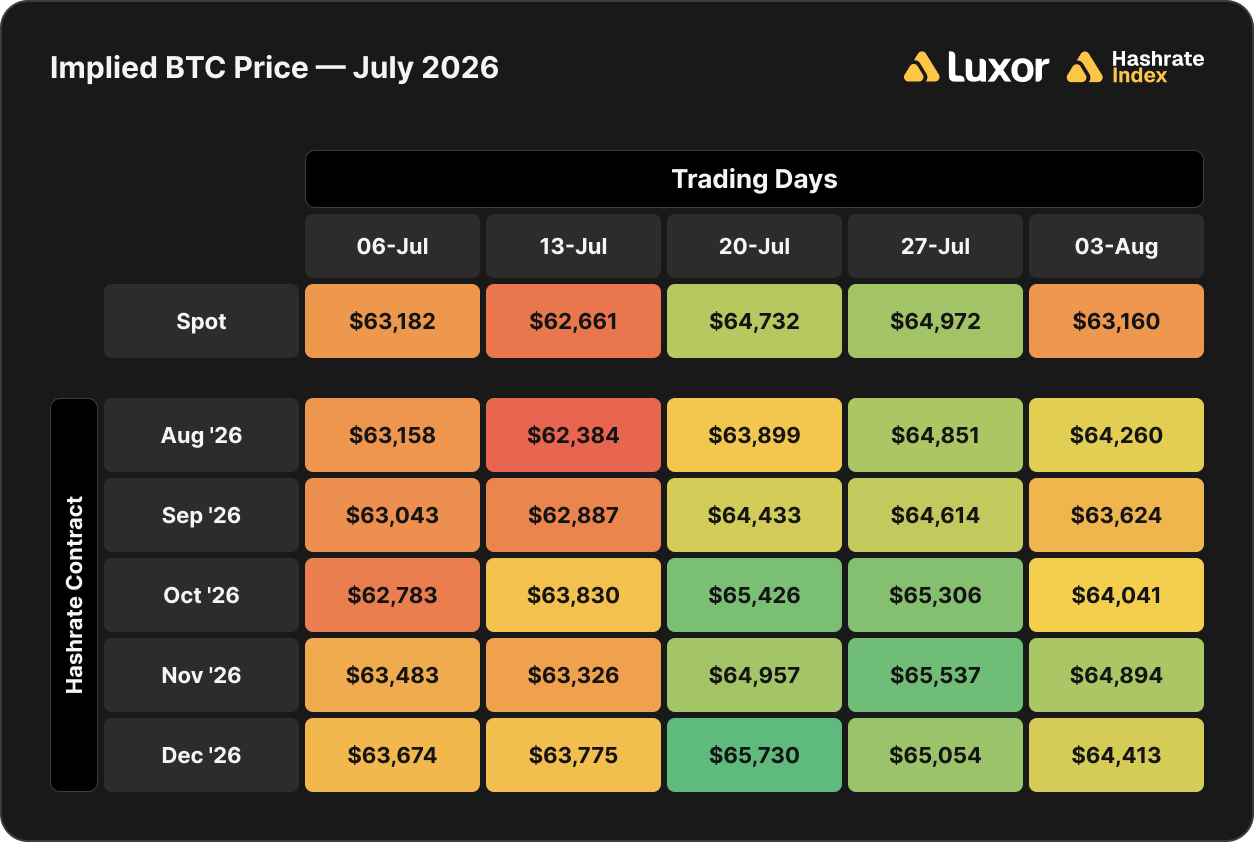
Dividing USD contract values by BTC contract values reveals the implied BTC price embedded in the forward hashrate market. Implied BTC prices rose across July in line with spot, ending near $64,000 across the front-end of the curve by August 3.
Assuming 0.0219 BTC per block in transaction fees (July’s monthly average), we can also back out implied difficulty and network hashrate expectations:
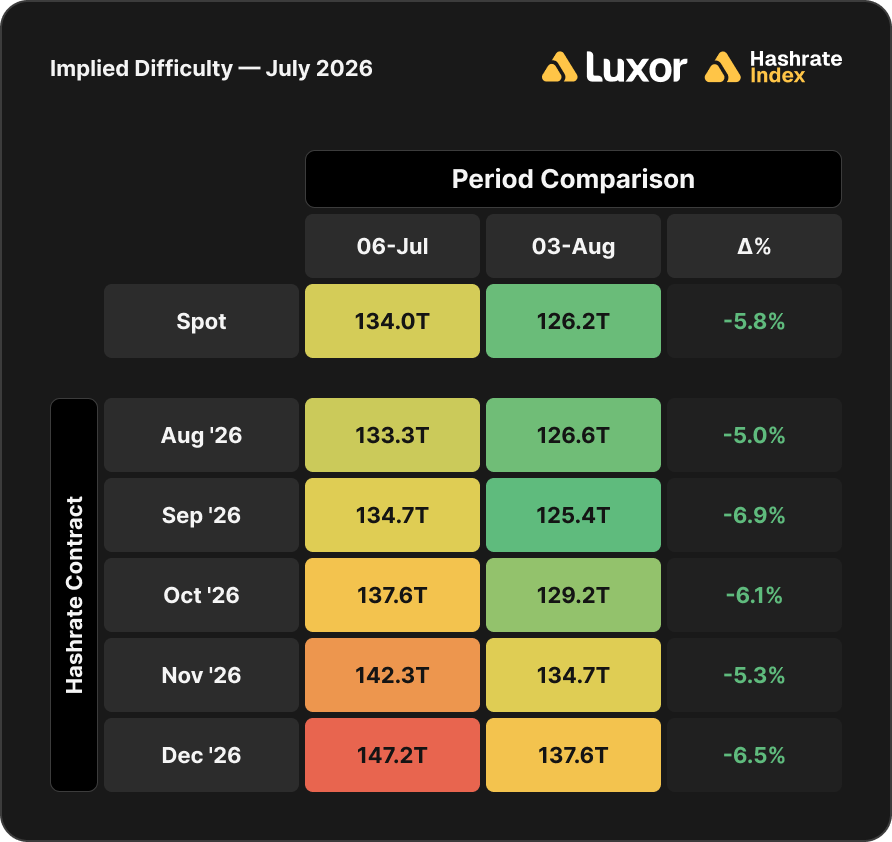
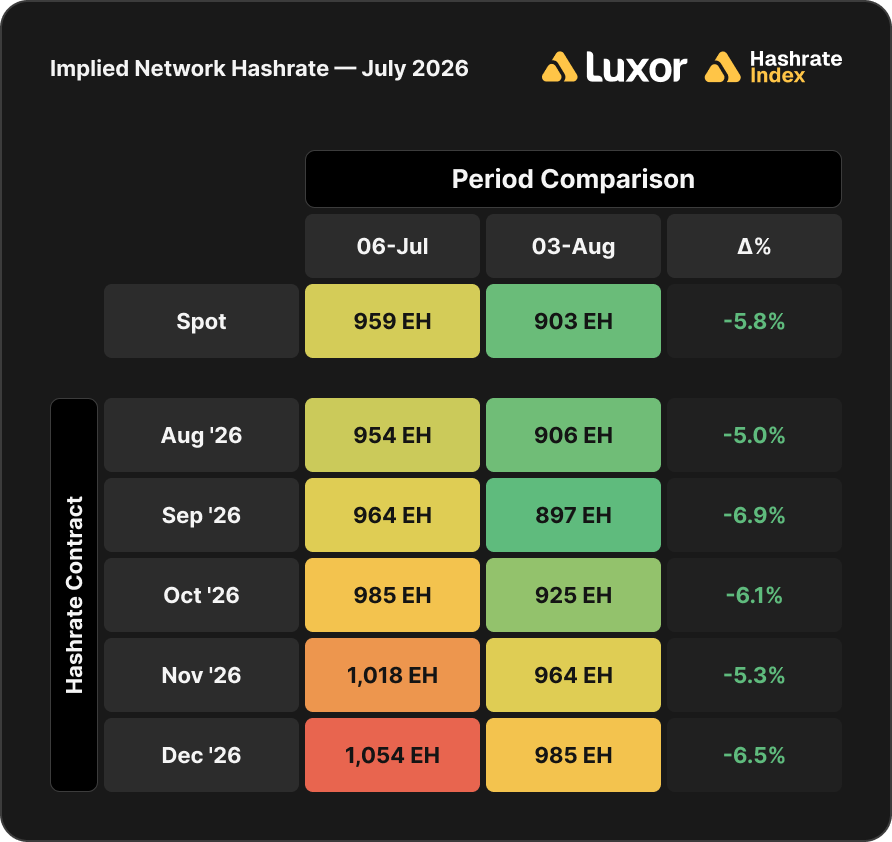
Note: figures assume 0.0219 BTC per block transaction fee collection.
Based on this analysis, the forward market lowered its difficulty and hashrate expectations again in July, deepening rather than reversing the reduction it made in June. Every contract from August through December fell by an average of −6.0% with September taking the largest cut. Implied network hashrate for December 2026 dropped from 1,054 EH to 985 EH. This is the arithmetic mirror of the +8.1% rise in USD forwards: at a roughly flat implied BTC price, a higher forward hashprice can only mean a lower expected difficulty.
The forward market still expects the same summer-bottom-to-autumn-rebound arc, but now from a lower level. The seasonal record supports this direction: October has been the strongest difficulty month of the year across 2022–2025, averaging +4.38%.
Concluding Thoughts and Looking Ahead
As of early August, spot hashprice is $32–33 per PH/s/day with BTC at $64,500. The first five days of August have averaged $31.87 and 0.00050193 BTC per PH/s/day; that BTC-denominated figure is already above August 2025’s 0.00049107, which could make August 2026 the strongest month for BTC hashprice in a year if it holds.
The 4CP Wager Paid Twice — Now Comes the Bigger Question
Last month we framed June as a test of the forward curve’s 4CP wager: front-end contango pricing in a summer slowdown in difficulty. June delivered it, and July delivered again — two more downward adjustments for a -5.71% net decline, without the record-low hashprice that drove June’s exodus.
That difference is the important part. June’s -10.09% drop stacked two causes: 4CP curtailment and economic shutdowns at sub-$28 hashprice. July’s decline came while hashprice rose +2.8%, which removed the economic layer. What was left was seasonal curtailment (miners cycling off during dispatch events and back on between them) rather than the economically forced shutdowns of June. The 25–38 J/TH tier spent a second month below the estimated ~$48/MWh network-average power cost, and difficulty ended July roughly 19% below its October 2025 peak.
Our Q3-2026 mining economics projections put the question in numbers. Total net ASIC capacity (every machine manufactured and not yet mechanically failed, modelled on a Weibull failure distribution) stands at approximately 1,153 EH for August, against active network hashrate near 926 EH/s implied by July’s 129.32T average difficulty. That leaves roughly 227 EH idle: economically unviable, curtailed, in transit, or under maintenance. Our model estimates the average operating cost at $0.048/kWh, with about half of network hashrate between $0.038 and $0.058, which puts breakeven efficiency at July’s $31.21 hashprice near 27 J/TH. Fleet average efficiency is estimated at 20.2 J/TH, so the marginal cohort is everything above roughly 27 J/TH — the same 25–38 J/TH tier that has sat below breakeven for two months.
BTC Price — Off the Lows, Still in Drawdown
July’s $63,577 close left BTC 48.9% below its October 2025 peak, up from June’s -52.6% trough but still the deepest sustained drawdown of this cycle. For scale, the 2021 cycle absorbed a -53% mid-cycle correction and a -62% COVID crash before making new highs, and the 2017 cycle saw 13 separate drawdowns beyond 10% with a largest correction of -39%. What distinguishes this cycle is the magnitude of the gains rather than the depth of the corrections: normalized to each cycle’s trough, 2017 peaked near 131x and 2021 near 22x, against roughly 8x for the current cycle from the $15,460 November 2022 low. The day-one low at $59,304 held for the rest of July, the first time since the drawdown began that a monthly low was set in the opening session and not revisited.
For miners, BTC in the $59,000–$66,000 band keeps USD hashprice in the $28–$33 range; above the level that triggered June’s marginal shutdowns, but not far enough above to bring the 25–38 J/TH tier back. At $40,000 BTC, our Q3 sensitivity tables put equilibrium hashprice near $25 per PH/s/day — only 17% below today despite a 33% price fall because ~200 EH/s exits and difficulty absorbs the rest. The price level that matters is around $33,000: below it, breakeven efficiency drops under the 20.2 J/TH average, and the median machine stops covering its power bill.
Looking Ahead
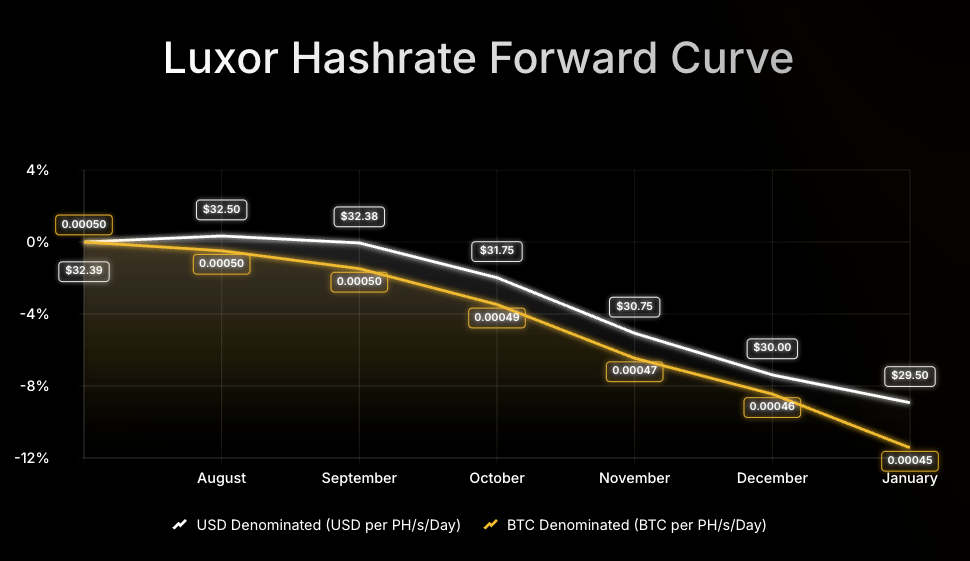
Looking forward, Luxor's Hashrate Forward Market is pricing in an average hashprice of $31.15 or 0.00048 BTC per PH/s/day over the August–January window. Sellers can currently secure this hashprice while buyers have the opportunity to lock in the same hashcost over the next six months.
If you’d like to learn more about Luxor’s Bitcoin mining derivatives, please reach out to [email protected] or visit https://www.luxor.tech/derivatives.
About Luxor Technology Corporation
Luxor delivers hardware, software, and financial services that power the global compute and energy industry. Its product suite spans Bitcoin Mining Pools, ASIC Firmware, Hardware trading, Hashrate Derivatives, Energy services, a Miner Management software, Commander, and a bitcoin mining data platform, Hashrate Index.
Disclaimer
This content is for informational purposes only, you should not construe any such information or other material as legal, investment, financial, or other advice. Nothing contained in our content constitutes a solicitation, recommendation, endorsement, or offer by Luxor or any of Luxor’s employees to buy or sell any derivatives or other financial instruments in this or in any other jurisdiction in which such solicitation or offer would be unlawful under the derivatives laws of such jurisdiction.
There are risks associated with trading derivatives. Trading in derivatives involves risk of loss, loss of principal is possible.




Hashrate Index Newsletter
Join the newsletter to receive the latest updates in your inbox.