Global Hashrate Heatmap Update: Q4 2026
Hashrate Index's Global Hashrate Heatmap tracks how Bitcoin mining compute power moves around the world.

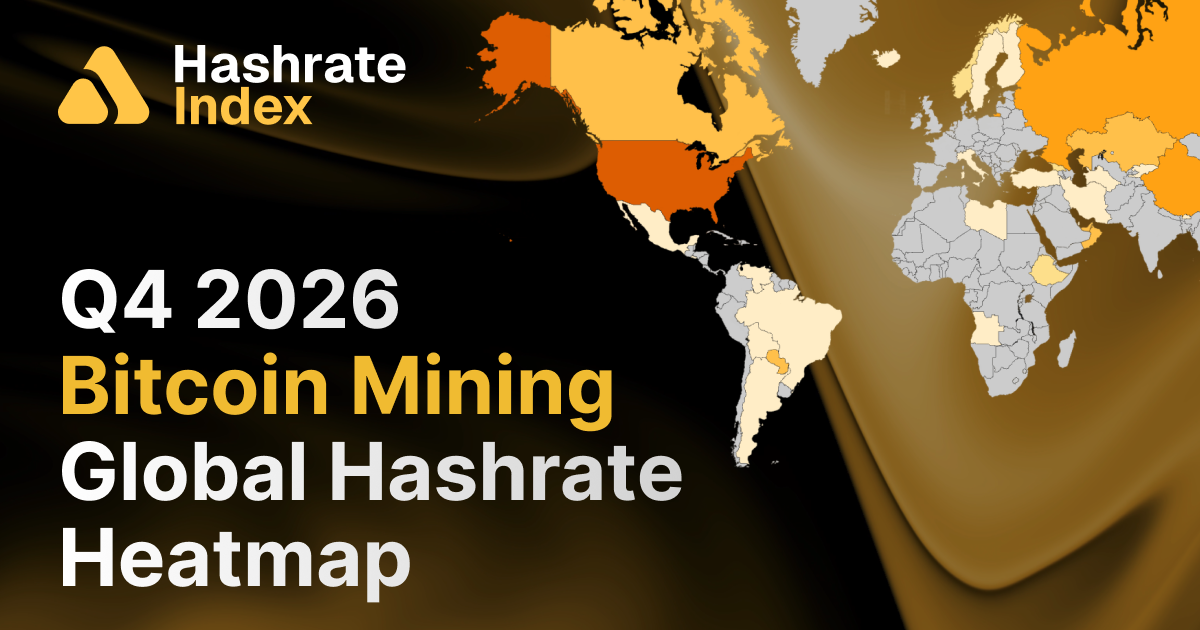
Hashrate Index's Global Hashrate Heatmap tracks how Bitcoin mining compute power moves around the world. This Q4 2026 update covers country-level market share and hashrate (EH/s), giving miners, investors, and industry observers a read on where the network's compute actually lives, and where it's going.
After two consecutive quarterly contractions, the Bitcoin network's hashrate stopped falling. Global hashrate finished Q3 2026 at ~941 EH/s, effectively flat against Q2's ~940. But a flat headline hides an unusually busy quarter underneath: the United States shed another 10 EH/s while Russia added 8 EH/s, Ethiopia gave back a third of its hashrate, and Pakistan more than tripled. The map is no longer shrinking, but it continues to redistribute. Here's how bitcoin mining compute power is distributed around the world as of Q4.
TLDR
- The contraction paused. Network hashrate held at ~941 EH/s, +0.1% QoQ after -6.3% and -5.8% in the prior two quarters. It remains -8.7% year-over-year and ~15% below the ~1,110 EH/s peak set in November 2025.
- The US kept shedding, Russia kept adding. The US fell to ~335 EH/s, from 36.7% to 35.6% share, its third straight decline. Russia climbed to ~170 EH/s and 18.1%, its highest share in this series.
- Concentration eased slightly. The top three countries now hold 65.4%, down from 66.2%. The top 10 is the same ten countries as Q3, reshuffled.
- The frontier came back. Pakistan (+220% QoQ) and Venezuela (+67% QoQ) drove most of the quarter's upside, alongside Indonesia's move into the top eight.
- Ethiopia reversed hard, and the worst isn't in this number yet. From ~23 EH/s to ~15 EH/s (-35% QoQ) after the state utility cut miners to 23% of contracted power on September 15. The cut landed twelve days before our measurement window closed.
From Falling to Flat
Following two quarters of decline, Q3 2026's network hashrate came in flat. The 30-day SMA registered ~941 EH/s against Q2's ~940 — the first quarter in 2026 in which the number did not fall.
Flat is not the same as recovering. The network is still 8.7% smaller than it was a year ago (~1,031 EH/s in Q4 2025) and roughly 15% off its November 2025 peak. What changed is the rate of the bleed: marginal machines that were going to switch off at current hashprice have largely switched off already, and difficulty has adjusted down far enough to keep survivors above water.
That leaves the interesting activity at the country level. Five countries moved more than 4 EH/s in either direction. In a quarter where the total barely budged, that is pure redistribution. Bitcoin's compute capacity relocated.
Top 10 Countries by Market Share (Q4 2026)
Bitcoin mining remains highly concentrated, with the top three countries commanding roughly two-thirds of global hashrate:
- United States — 35.6% (~335 EH/s)
- Russia — 18.1% (~170 EH/s)
- China — 11.7% (~110 EH/s)
- Paraguay — 4.8% (~45 EH/s)
- Oman — 3.0% (~28 EH/s)
- United Arab Emirates — 2.8% (~26 EH/s)
- Canada — 2.3% (~22 EH/s)
- Indonesia — 2.1% (~20 EH/s)
- Norway — 1.7% (~16 EH/s)
- Ethiopia — 1.6% (~15 EH/s)
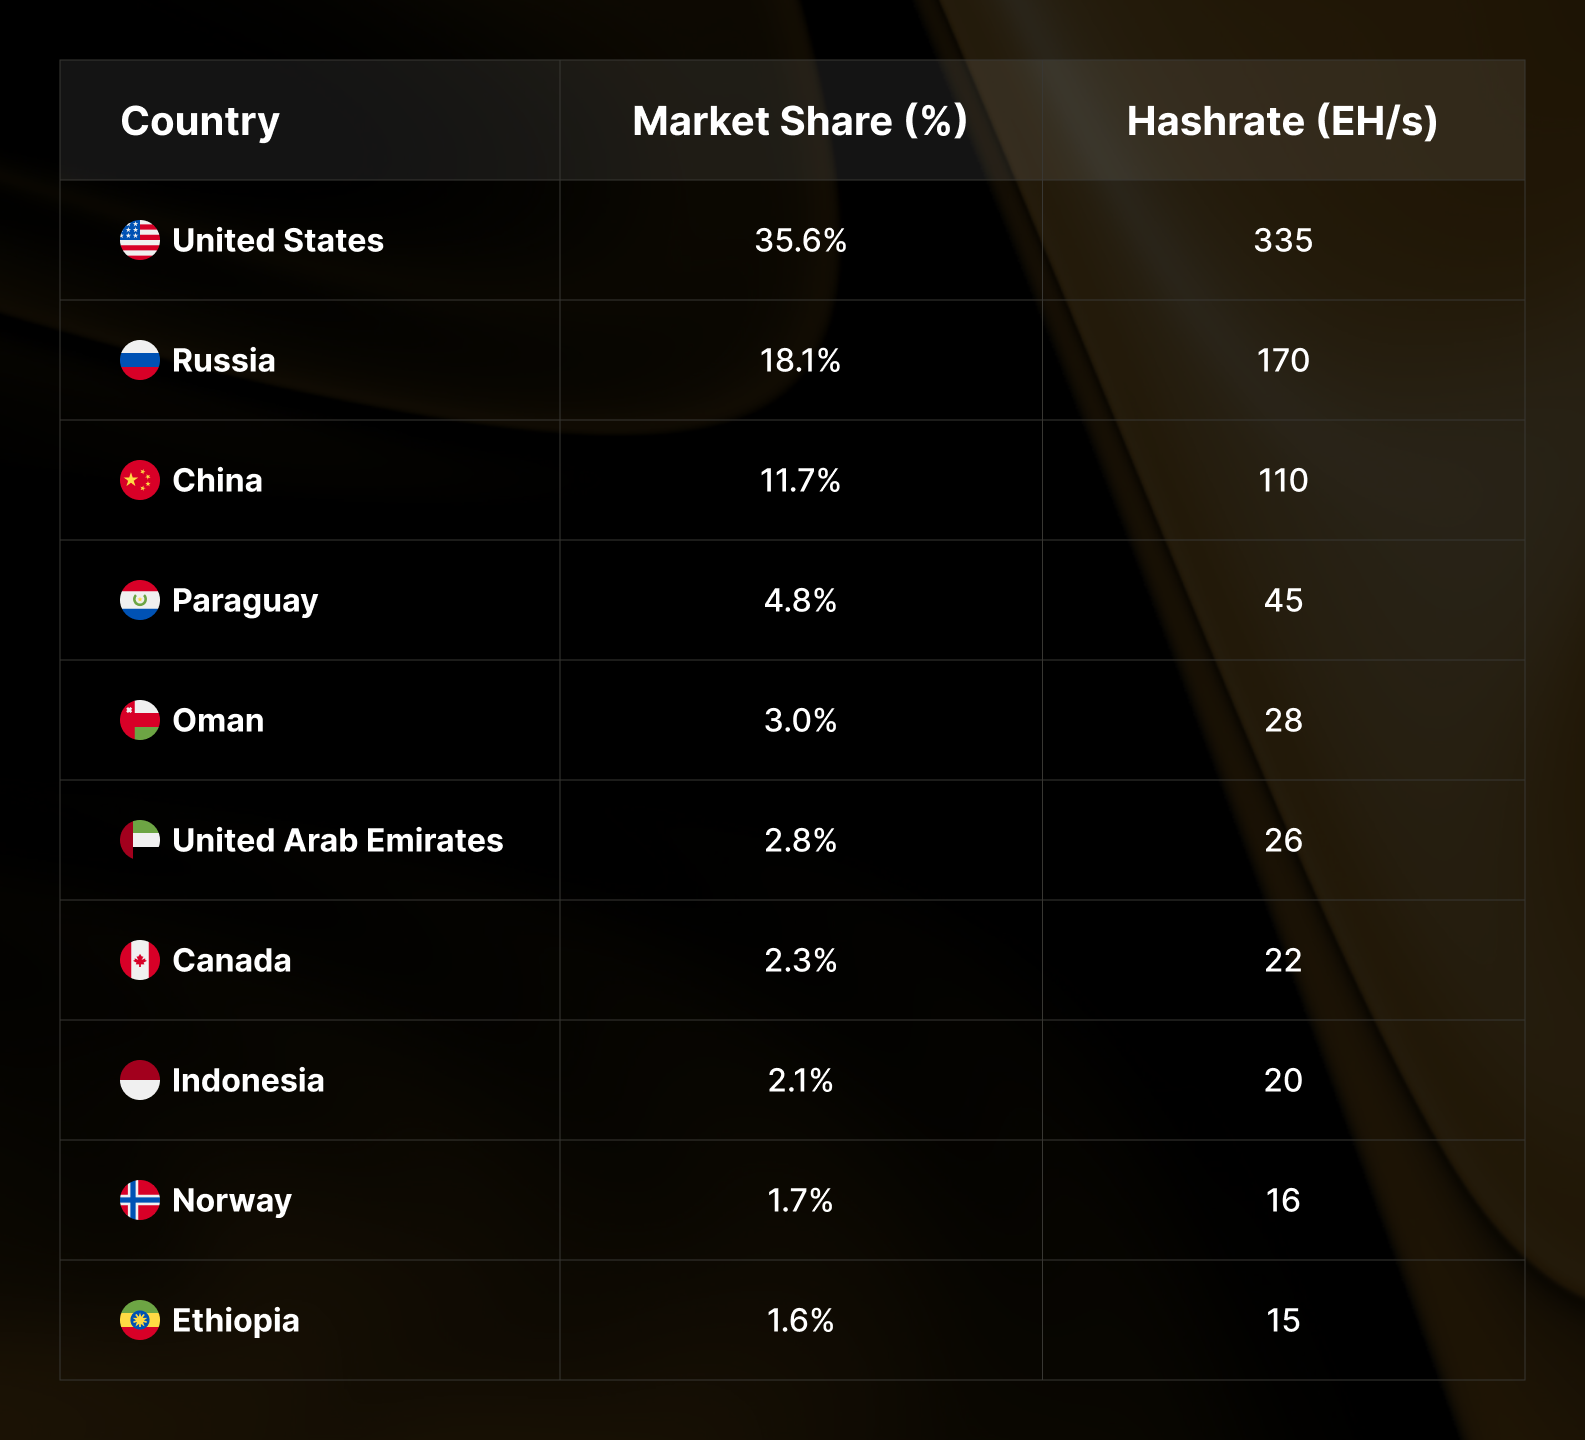
The group is identical to Q3 but five of the ten ranks changed hands. Oman passed the UAE for fifth. Indonesia climbed from ninth to eighth on a genuine 3 EH/s gain. Ethiopia fell from eighth to tenth. Kazakhstan sat at #11 on ~15 EH/s for a second straight quarter, close enough to Ethiopia that the two are effectively tied for the last top-10 slot heading into Q1 2027.
Top-three concentration slipped from 66.2% to 65.4%, the second consecutive drop. The US is giving up share faster than Russia is taking it.
Quarter-over-Quarter Movers
Comparing Q4 2026 to Q3 2026, the map split cleanly between a shrinking developed core and a growing frontier.
Notable decliners (by hashrate):
- United States: -10 EH/s (-3%), from 345 EH/s to 335 EH/s
- Ethiopia: -8 EH/s (-35%), from 23 EH/s to 15 EH/s
- China: -5 EH/s (-4%), from 115 EH/s to 110 EH/s
- Canada: -2 EH/s (-8%), from 24 EH/s to 22 EH/s
- United Arab Emirates: -2 EH/s (-7%), from 28 EH/s to 26 EH/s
The gainers:
- Russia: +8 EH/s (+5%), from 162 EH/s to 170 EH/s
- Pakistan: +5.5 EH/s (+220%), from 2.5 EH/s to 8 EH/s
- Venezuela: +4 EH/s (+67%), from 6 EH/s to 10 EH/s
- Indonesia: +3 EH/s (+18%), from 17 EH/s to 20 EH/s
- Oman: +2 EH/s (+8%), from 26 EH/s to 28 EH/s
Unlike the last two quarters, the gainers are not rounding errors. Pakistan's +5.5 EH/s is larger in absolute terms than anything it has added before, and Venezuela's +4 EH/s makes it a ~10 EH/s market (bigger than Laos, Finland, or Malaysia).
Year-over-Year Perspective: The Long View
Annual changes strip out quarterly noise and show which trends are durable.
Biggest YoY gainers:
- Pakistan: +2,567% — 0.3 → 8 EH/s (off a negligible base, but no longer negligible)
- Kyrgyzstan: +167% — 1.5 → 4 EH/s
- Venezuela: +122% — 4.5 → 10 EH/s
- Bolivia: +33% — 3 → 4 EH/s
- Malaysia: +27% — 5.5 → 7 EH/s
- Indonesia: +18% — 17 → 20 EH/s
- Paraguay: +12% — 40 → 45 EH/s
Biggest YoY decliners:
- Iran: -62% — 8 → 3 EH/s
- Kazakhstan: -32% — 22 → 15 EH/s
- Canada: -27% — 30 → 22 EH/s
- Argentina: -25% — 4 → 3 EH/s
- Ethiopia: -25% — 20 → 15 EH/s
- China: -24% — 145 → 110 EH/s
- United Arab Emirates: -21% — 33 → 26 EH/s
- United States: -14% — 389 → 335 EH/s
The twelve-month picture is clearer than the quarterly one. Every market that grew is a low-cost or stranded-power story.
The decliners are not the mirror image of that. Canada and the UAE are not expensive places to mine. Canadian hashrate sits largely on Quebec, Manitoba and BC hydro; Abu Dhabi runs on gas, solar and nuclear-backed supply. Neither market lost hashrate because power got expensive.
They lost it because the power found a better use. Both jurisdictions host operators well advanced in the AI/HPC pivot that defined 2026, and the economics are not close: AI compute generates anywhere from $1,500 to $3,500 per megawatt-hour against a range of $50 to $150 for Bitcoin mining.
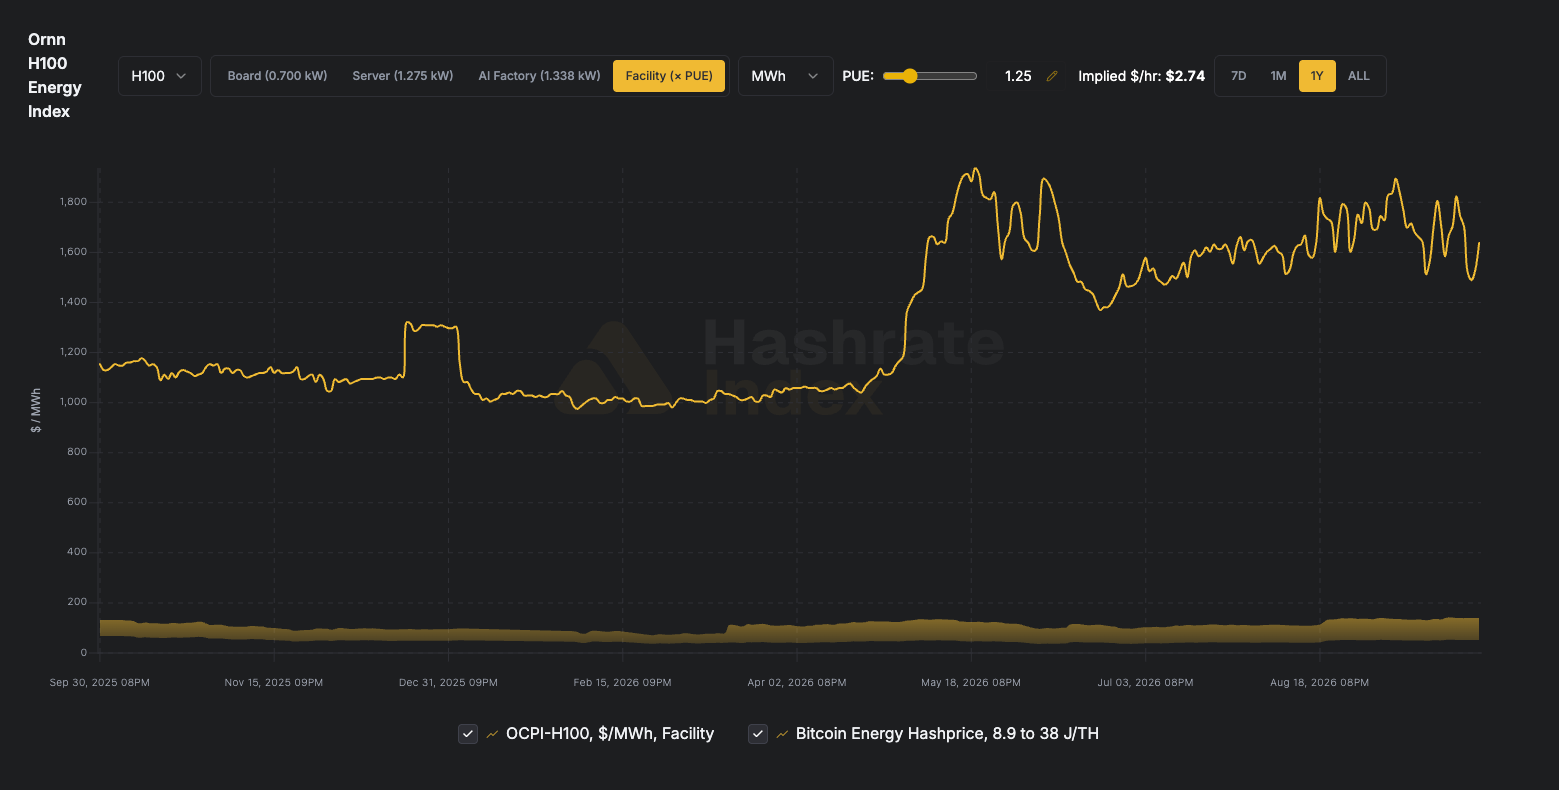
That distinction matters for what comes next. A marginal machine that went offline because hashprice fell can be switched back on. Power committed to a multi-year AI tenant cannot, even if Bitcoin rallies and difficulty falls.
So the decliners split three ways: capacity converting to AI/HPC (United States, Canada, UAE), regulatory pressure (Kazakhstan, China, Iran), and macro impairment (Argentina). Ethiopia belongs to none of them, which is why it gets its own section.
Standouts: Where Hashrate Is Sticking
Paraguay continues to anchor the group that grows through a down-cycle, adding another 1 EH/s to reach ~45 EH/s (#4 globally, +12% YoY) on Itaipú hydropower. Indonesia is the quarter's clearest structural gainer (~20 EH/s and a top-8 slot, +18% YoY), built on the same Southeast Asian hydro diversification that has been visible in this series for a year.
Norway has held at exactly ~16 EH/s for four straight quarters, since Q1 2026. In a network that is no longer shrinking, holding flat no longer accrues market share the way it did in Q3.
The real reversal story is Ethiopia.
Ethiopia: When the Water Doesn't Show Up
Ethiopia fell from ~23 to ~15 EH/s, a 35% quarterly decline that drops it from #8 to #10 and returns it to mid-2025 levels. Measured from its Q1 2026 peak of ~27.5 EH/s, the market is down 45% in three quarters. The cause is documented, and it is not a policy reversal.
On September 15, Ethiopian Electric Power cut electricity supplied to Bitcoin miners to roughly 23% of contracted volume (a reduction of about three-quarters) after reservoir inflows fell around 20% under El Niño-driven dry conditions. Bloomberg's Fasika Tadesse first reported the cut.
Three things made Ethiopia unusually exposed:
- The grid is water. EEP's installed capacity is roughly 95% hydroelectric, and the Grand Ethiopian Renaissance Dam (GERD) alone supplies a little over half of national generation. Installed capacity actually rose 23% to 9.73 GW this year, but utilization fell to about 60% against a 67% target. The plants exist, the water doesn't. Capacity growth offers no protection when inflows are the binding constraint.
- Miners were the largest customer, which made them the easiest to cut. Mining companies generated about 35% of EEP's revenue in the last fiscal year and consumed close to a third of national output. That looks like leverage until rationing starts, at which point a single interruptible customer class representing a third of load is exactly where a utility finds its megawatts. EEP CEO Ashebir Balcha had stated the priority order plainly at last year's annual review: households and strategic industries come first. September saw that policy being executed.
- The hashprice cycle removed the cushion. Bitcoin traded near $77,000 on the day of the cut, with the network already 15% off its November 2025 peak. Operators facing a 77% power reduction at a better hashprice might have absorbed it, relocated machines, or paid up for the remaining allocation. At current margins, curtailed machines in Addis Ababa simply stop hashing and earning.
Ethiopia's hashrate is expected to continue falling further in Q1 2027 unless inflows recover. EEP said it would reassess allocations in October; if reservoirs stay low, further cuts are on the table, along with restrictions on electricity exports to neighbors.
The Frontier Reaccelerates
Pakistan and Venezuela together added ~9.5 EH/s this quarter, nearly offsetting the US decline on their own.
Pakistan went from ~2.5 to ~8 EH/s. Its previous peak in this series was ~4 EH/s in early 2026, which it then unwound. This quarter takes it well past that — a genuine step change rather than a rebound, putting it level with Bhutan and ahead of Finland and Malaysia, though still behind Laos at ~9 EH/s.
Venezuela crossed into double digits at ~10 EH/s, +122% YoY, and it did so under a blanket prohibition on mining that has been in force since mid-2024. Our own read of the geolocated traffic describes the surviving activity as legitimate or semi-legitimate rather than state-run, and Venezuelan coverage of the heatmap has characterized it as principally informal.
Iran Iran ticked up for the first time since tensions escalated with the U.S. in February 2026, moving from ~2 to ~3 EH/s.
Regional Dynamics
North America — The US remains dominant at 35.6% but posted a third consecutive decline, down to ~335 EH/s (-14% YoY). It peaked at ~400 EH/s in Q1 2026. Canada continued to slide to ~22 EH/s (-27% YoY), the sharpest annual decline of any developed market.
Europe & Central Asia — Russia was the quarter's largest absolute gainer, up 8 EH/s to ~170 EH/s and 18.1% share. Kazakhstan stabilized at ~15 EH/s after a year of losses, sitting just outside the top 10. Norway held at ~16 EH/s and Georgia at ~11 EH/s.
Asia-Pacific — China eased further to ~110 EH/s (-24% YoY), continuing its steady multi-quarter bleed. Indonesia (~20 EH/s, +18% YoY) and Malaysia (~7 EH/s, +27% YoY) keep absorbing regional diversification, and Laos added 1 EH/s to reach ~9 EH/s.
Middle East — Oman reversed course, adding 2 EH/s to ~28 and overtaking the UAE, which fell to ~26 (-21% YoY). Iran's modest recovery to ~3 EH/s is the region's other movement.
Latin America — Paraguay leads at ~45 EH/s and keeps growing. Venezuela's climb to ~10 EH/s is the region's headline. Bolivia rose to ~4 EH/s (+33% YoY); Argentina continued to decline to ~3 EH/s on macro instability.
Africa — Ethiopia's -35% quarter takes the continent's flagship market down to ~15 EH/s and a #10 ranking, its first material reversal in this series, on the September power cut described above. Nothing else on the continent is large enough to offset it.
Emerging Players (<1% Global Share)
- Laos — ~9 EH/s (+12% YoY), hydro-powered and steadily growing
- Finland — ~7 EH/s, flat for two quarters after easing from ~8 EH/s
- Malaysia — ~7 EH/s (+27% YoY), the quarter's quiet Southeast Asian riser
- Kyrgyzstan — ~4 EH/s (+167% YoY), pinned at exactly 4 for four straight quarters
- Bolivia — ~4 EH/s (+33% YoY), still volatile on subsidized gas
Key Takeaways
- The bleed stopped, but nothing recovered. +0.1% QoQ after two sharp declines means the marginal capacity is already offline. Near-future moves depend on hashprice.
- Redistribution replaced contraction. Five countries moved more than 4 EH/s while the total stayed flat. Compute capacity is relocating, not leaving the network.
- The US-Russia gap is narrowing for the first time. The US at 35.6% and Russia at 18.1% is the closest this series has recorded, driven by US decline rather than Russian acceleration.
- The frontier is back, and bigger. Pakistan at ~8 EH/s and Venezuela at ~10 are no longer rounding errors. Both are now larger than several established European markets.
- Ethiopia is a hydrology warning, not a policy one. A 20% shortfall in reservoir inflows cost the continent's flagship market a third of its hashrate in one quarter.
The Global Hashrate Heatmap is updated at the start of each new quarter on Hashrate Index. Access the full interactive dataset and historical comparisons under Data > Network Data > Global Hashrate Heatmap.
Review previous quarterly analysis:
— Happy Hashing!
About Luxor Technology Corporation
From Bitcoin mining to AI infrastructure, Luxor delivers the hardware, software, finance and energy tools that power the world's compute. Its Bitcoin product suite spans Mining Pools, ASIC Firmware, Hardware trading, Hashrate Derivatives, Energy services, a Miner Management software, Commander, and a bitcoin mining data platform, Hashrate Index; its AI product suite spans Hardware, Compute, and Tenki: cloud infrastructure for code and agents.
Disclaimer
This content is for informational purposes only; you should not construe any such information or other material as legal, investment, financial, or other advice.

Hashrate Index Newsletter
Join the newsletter to receive the latest updates in your inbox.