Global Hashrate Heatmap Update: Q3 2026
Hashrate Index's Global Hashrate Heatmap tracks how Bitcoin mining compute power moves around the world.

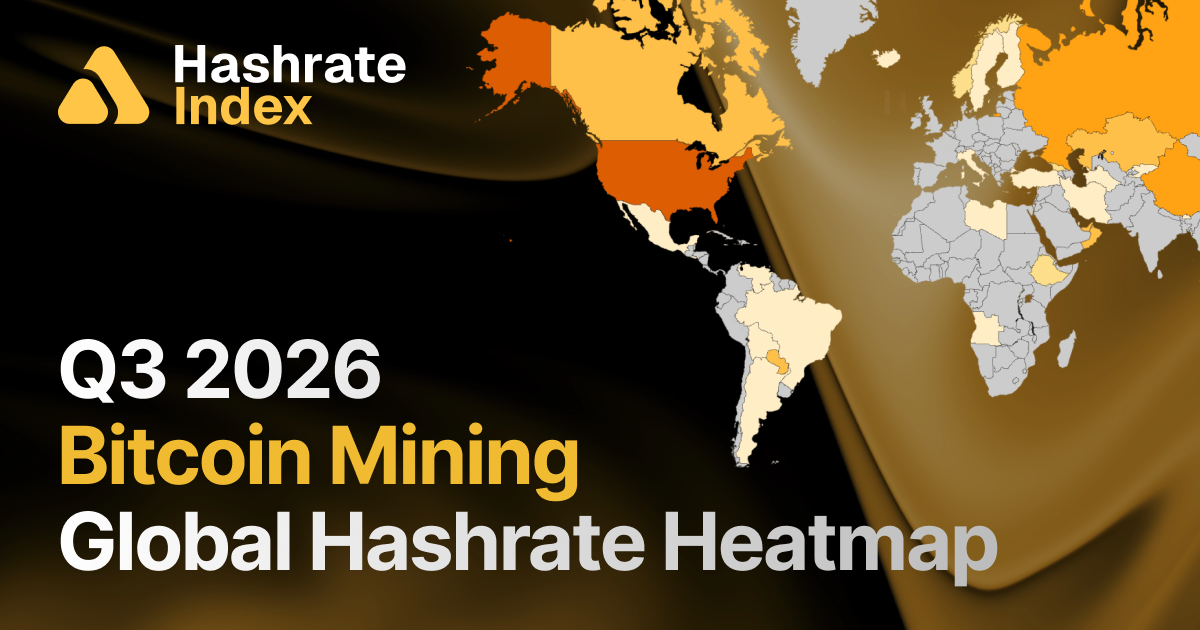
Hashrate Index's Global Hashrate Heatmap tracks how Bitcoin mining compute power moves around the world. This Q3 2026 update covers country-level market share and hashrate (EH/s), giving miners, investors, and industry observers a read on where the network's compute actually lives, and where it's going.
Bitcoin's mining map is being redrawn by two forces at once: an economic down-cycle that keeps pushing marginal machines offline, and a wave of capital rotating from SHA-256 hashing toward AI. Layered on top, geopolitics is doing visible damage in specific corners of the map. The result is a network that is smaller than it was six months ago, still highly concentrated, and quietly reshuffling underneath.
TLDR
- Network hashrate fell 6.3% QoQ — the second consecutive quarterly drop and roughly -12% below the ~1,066 EH/s peak set in December 2025.
- Economics remain the primary driver. With hashprice stuck near record lows in the low-$30s per PH/s/day and BTC trading ~50% below its October 2025 high, older, less-efficient machines keep going dark.
- The AI/HPC trade is the structural overlay. Listed miners have announced $70B+ in AI/HPC contracts, with some operators projected to earn most of their 2026 revenue from non-mining workloads.
- Concentration is steady (~66% top 3) but the composition is churning. Kazakhstan dropped out of the top 10 for the first time in this series; Norway is in.
- Geopolitics moved the map. Iran remains pinned near a ~2 EH/s floor (-71% YoY), while Venezuela grew 20% despite reaffirming a nationwide mining ban.
The Down-Cycle Deepens: Economics Still Drives the Map
Bitcoin mining's headline number is still an economic one. The 30-day simple moving average (SMA) network hashrate declined to ~940 EH/s in Q3 2026, down from ~1,004 EH/s in Q2 and ~1,066 EH/s in Q1 — a -6.3% quarter-over-quarter move and the second straight quarterly contraction. The network now sits roughly 12% below its December peak.
The cause hasn't changed since last quarter; it has intensified. Bitcoin fell about 50% from its ~$126K October 2025 high into the low-$60Ks by mid-2026, dragging hashprice down to the low-$30s per PH/s/day, at or below breakeven for many operators depending on power cost and machine efficiency. Difficulty has repeatedly adjusted downward as unprofitable capacity leaves, giving surviving miners some relief but confirming the contraction. This is the market's mechanics at play: the least efficient hashrate switches off first.
Underneath the cycle is a structural shift. "This is a structural shift, not just a cyclical low," says Ethan Vera, COO of Luxor.
"Miners everywhere are being revalued as energy and AI infrastructure, and with mining margins compressed and AI economics far stronger, that's where the capital is heading."
That rotation is well underway among public miners, several of whom are funding GPU buildouts by selling down the Bitcoin they once accumulated.
It also reframes the value of a mining site. As Vera puts it:
"Miners are worth more to the grid than people realize. They are flexible loads that can power down in an instant when supply is tight, something the AI capacity replacing them can't yet do."
That flexibility is part of why the down-cycle looks less like an exodus and more like a reallocation. Power and land is put while the workload on top of it changes.
For operators weighing whether to keep hashing or not, the calculus comes down to hardware. "It comes down to efficiency," says Vera.
"Operators with the newest hardware and cheapest power can still mine profitably through a low hashprice; those on older machines are usually better off curtailing until it recovers."
The geographic data below is largely a map of who cleared that bar this quarter.
Top 10 Countries by Market Share (Q3 2026)
Bitcoin mining remains highly concentrated, with the top three countries commanding roughly two-thirds of global hashrate:
- United States — 36.7% (~345 EH/s)
- Russia — 17.2% (~162 EH/s)
- China — 12.2% (~115 EH/s)
- Paraguay — 4.7% (~44 EH/s)
- United Arab Emirates — 3.0% (~28 EH/s)
- Oman — 2.8% (~26 EH/s)
- Canada — 2.6% (~24 EH/s)
- Ethiopia — 2.4% (~23 EH/s)
- Indonesia — 1.8% (~17 EH/s)
- Norway — 1.7% (~16 EH/s)
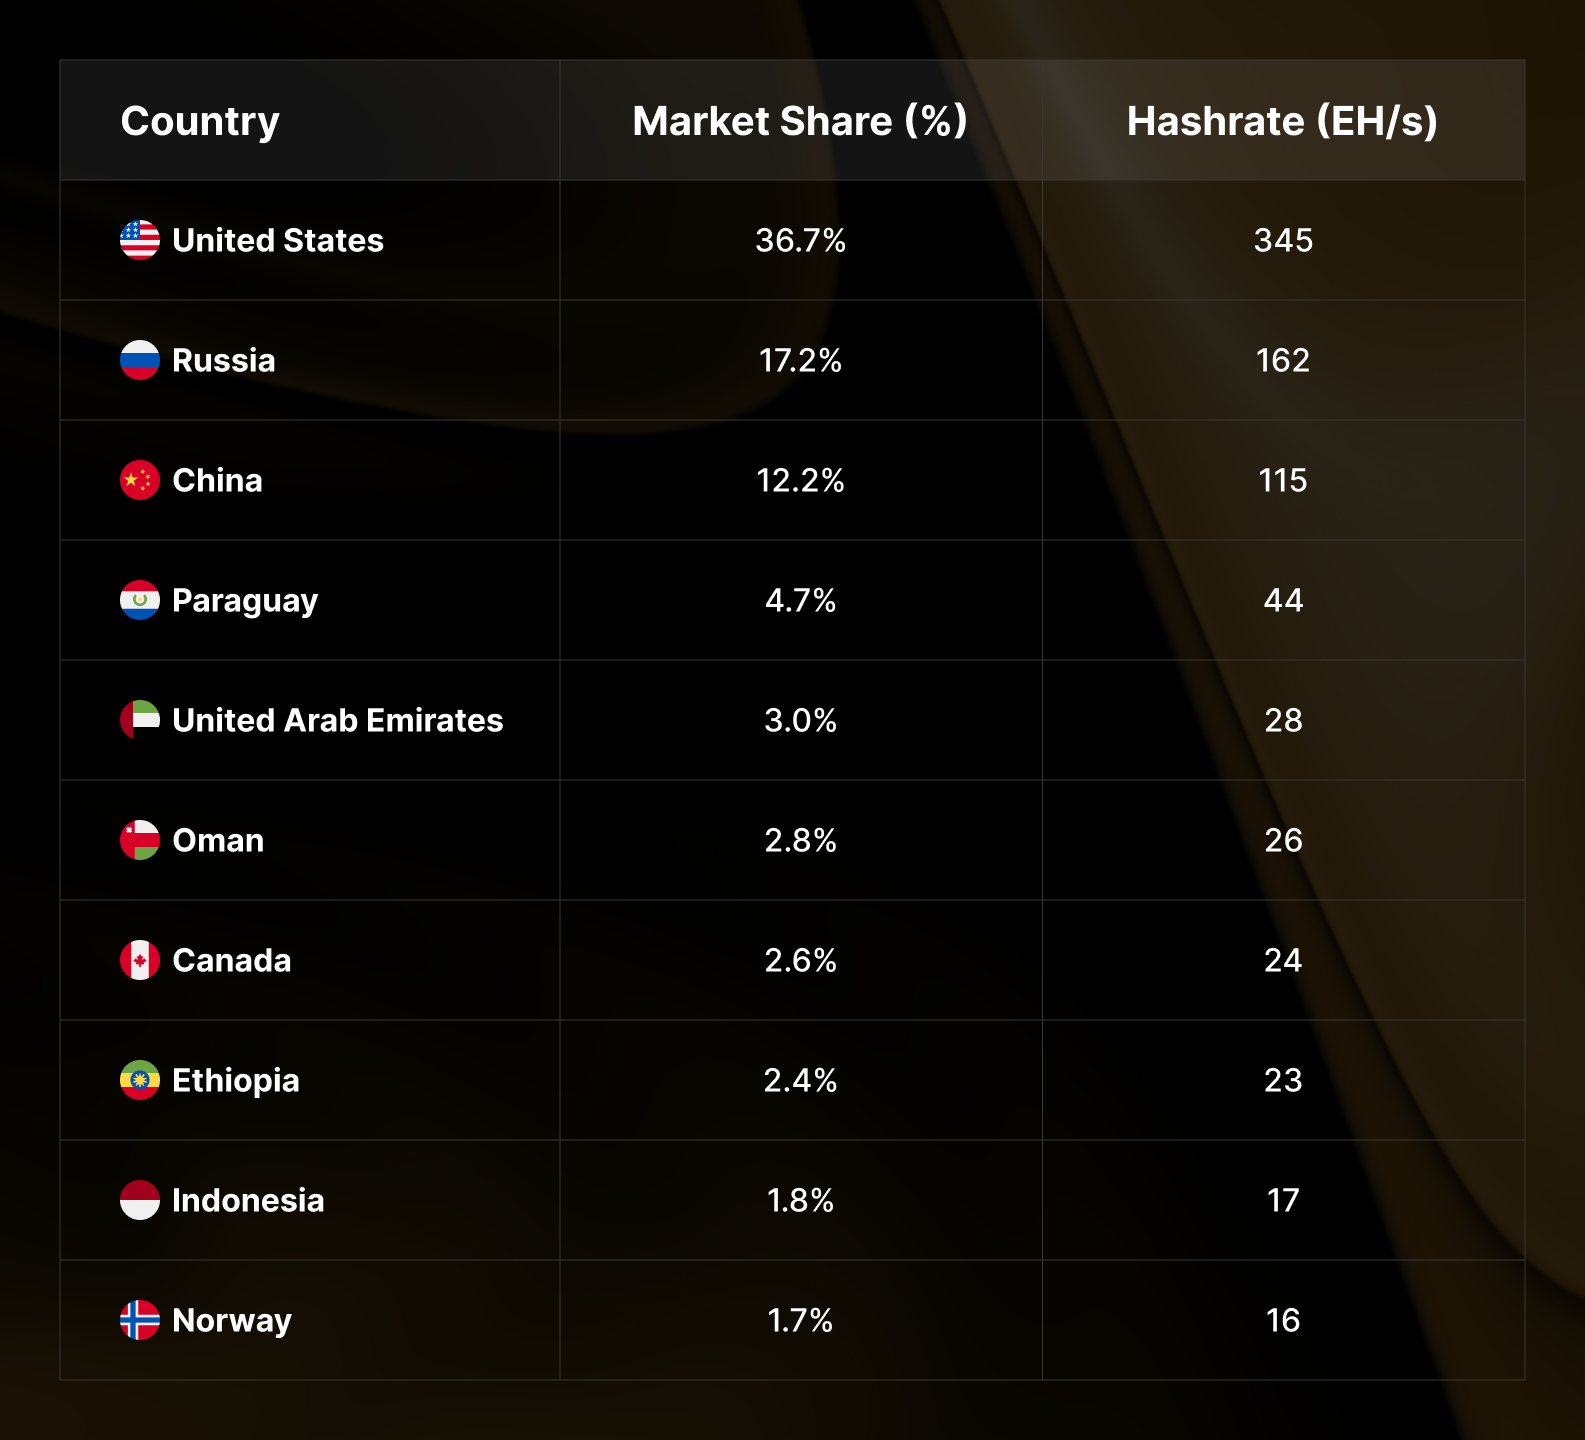
The top three still hold ~66% of global hashrate, roughly flat versus Q2. But the back half of the list moved: Kazakhstan fell out of the top 10 for the first time in years (down to #11 at ~15 EH/s), and Norway backed into tenth place — not by adding hashrate, but by holding steady at ~16 EH/s while others contracted. It's a small illustration of the Bitcoin network's design: in a shrinking hashrate environment, standing still is enough to gain ground.
Quarter-over-Quarter Movers
Comparing Q3 2026 (June) to Q2 2026 (March), almost everyone contracted. The real question was by how much.
Notable decliners (by hashrate):
- United States: -30 EH/s (~-8%) — 375 → 345 EH/s; the single biggest contributor to the network's decline, though still #1 by a wide margin
- Russia: -8 EH/s (~-5%) — 170 → 162 EH/s
- China: -5 EH/s (~-4%) — 120 → 115 EH/s
- Oman: -4 EH/s (~-13%) — 30 → 26 EH/s
- Kazakhstan: -3 EH/s (~-17%) — 18 → 15 EH/s
The few gainers:
- Venezuela: +1 EH/s (~+20%) — 5 → 6 EH/s
- Paraguay: +1 EH/s (~+2%) — 43 → 44 EH/s
- Bolivia: +0.5 EH/s (~+20%) — 2.5 → 3 EH/s
The pattern is consistent with a margin-driven washout rather than a policy story. "It's a combination of factors" says Kaan Farahani, Research Analyst at Luxor. "The least-efficient machines switch off first, while the capacity that stays online continues to migrate toward wherever power is cheapest." That's why the losses cluster in higher-cost or higher-tariff jurisdictions.
Year-over-Year Perspective: The Long View
Annual changes strip out quarterly noise and show which trends are durable.
Biggest YoY gainers:
- Pakistan: +733% — 0.3 → 2.5 EH/s (off a tiny base, and now cooling)
- Bolivia: +300% — 0.75 → 3 EH/s
- Kyrgyzstan: +167% — 1.5 → 4 EH/s
- Laos: +60% — 5 → 8 EH/s
- Ethiopia: +35% — 17 → 23 EH/s
- Paraguay: +26% — 35 → 44 EH/s
- United States: +7% — ~323 → 345 EH/s
Biggest YoY decliners:
- Iran: -71% — 7 → 2 EH/s
- Kazakhstan: -29% — 21 → 15 EH/s
- Argentina: -30% — 5 → 3.5 EH/s
- United Arab Emirates: -12% — 32 → 28 EH/s
- China: -8% — 125 → 115 EH/s
The takeaway: the cheapest power markets (Paraguay, Ethiopia, Laos) are still up meaningfully even through a down-cycle, while the sharpest annual declines cluster around regulatory pressure (Kazakhstan), macro instability (Argentina), and geopolitics (Iran).
When Geopolitics Moves the Map
Bitcoin's network is resilient in aggregate, but at the country level it still follows cheap power into politically fragile places, which means geopolitical shocks show up directly in the data. Two stories stood out over the past few months.
Iran: pinned to the floor after February's strikes
Iran has effectively fallen off the map. Its hashrate collapsed from roughly 9 EH/s to ~2 EH/s and has stayed near that floor through Q3 — a -71% year-over-year decline representing tends of thousands of machines. The trigger was the late-February 2026 US and Israeli strikes on Iranian military and energy infrastructure, which introduced the kind of grid instability and emergency load-shedding that a state-linked, power-hungry industry cannot operate through. Iran had used heavily subsidized energy to convert electricity into bitcoin as a sanctions workaround; when the grid came under emergency management, that machine largely stopped.
A reported US–Iran ceasefire since mid-2026 has eased oil markets, but whether Iranian hashrate recovers depends on grid repair, not headlines — and even at its peak, Iran was under ~1% of the global network.
Venezuela: a modest climb against the grain
Venezuela is the stranger story. Its estimated hashrate rose from ~5 to ~6 EH/s (+20% QoQ) — one of only a few gains this quarter — even as the country reaffirmed a total ban on digital mining on May 7, 2026 amid a nine-year peak in electricity demand and chronic grid strain. That came months after a major political rupture, the removal of Nicolás Maduro in early 2026.
How does hashrate rise under an active ban? The answer lies in who is doing the mining. According to El Sultán, who authored our Bitcoin Mining Around the World: Venezuela report, the overwhelming majority of Venezuela's hashrate is state-operated rather than private or underground, which reframes the increase entirely.
"This rise is more likely the state expanding, or getting better at capturing its stranded energy, than a wave of new private miners. The government continues crackdown on mining from the residential grid in an attempt to keep it stable."
That squares the apparent contradiction: the ban and the ongoing crackdowns target private operators pulling from the residential grid to protect stability, while the state continues to mine on generation-side, stranded power the national grid can't otherwise use. What's still unclear is whether the Q3 uptick means new machines actually arrived or the state simply got better at capturing energy it already had. Either way, Venezuela remains a giant with world-class stranded energy but without the rule-of-law framework to attract at-scale foreign capital — a reminder that hashrate is hard to fully switch off wherever cheap, stranded power exists.
Standouts: Where Hashrate Is Sticking
While most of the map contracted, a few countries held or grew — and they share a profile: modern hardware and genuine energy advantages, not policy accommodation.
Paraguay anchored the group, holding steady at ~44 EH/s (#4 globally, +26% YoY) on cheap Itaipú hydropower and professional operators. Ethiopia stayed at ~23 EH/s (+35% YoY) on Grand Ethiopian Renaissance Dam hydro, though it has eased off its ~27.5 EH/s peak as a mid-2025 freeze on new mining permits finally caps expansion. Both illustrate Farahani's point on flat-but-holding markets: "In a shrinking network, holding flat is a win — it usually signals stable, low-cost operations that don't need to curtail, and standing still while others contract means picking up market share."
The other side of that coin is the cooling frontier. Pakistan has unwound from its ~4 EH/s peak to ~2.5, and Kyrgyzstan has flattened at ~4 EH/s. "A lot of the frontier boom was subsidized or stranded power finding a temporary home," says Farahani. "As that gets absorbed and operators face their true costs, the easy growth cools." The regions that last, he notes, are the ones with a durable energy edge rather than a one-off subsidy.
Regional Dynamics
North America — The US remains dominant at 36.7% but shed the most hashrate of any country (-30 EH/s QoQ), a mix of margin-driven curtailment and capacity converting to AI/HPC rather than an exodus. Canada slipped to ~24 EH/s (-8% QoQ) with similar dynamics.
Europe & Central Asia — Kazakhstan's slide out of the top 10 (-29% YoY) reflects years of tightening: electricity rationing, mandatory AIFC coin sales, and a crackdown on illegal operators — even as Astana just signed a pro-crypto decree adding tax exemptions and gas-powered mining provisions that could reshape the picture in 2027. Russia held #2 at ~162 EH/s but continues to give up share. Norway (~16 EH/s) entered the top 10 by attrition, having shifted policy against new mining facilities in 2025.
Asia-Pacific — China eased to ~115 EH/s (-8% YoY), the only top-three country down year-over-year, as Xinjiang enforcement continues to bleed underground capacity. Indonesia (~17 EH/s, +13% YoY) and Laos (~8 EH/s, +60% YoY) keep capturing Southeast Asian diversification on hydro resources.
Middle East — UAE (~28 EH/s, -12% YoY) and Oman (~26 EH/s, -13% QoQ) both softened after a long run of state-backed growth — the down-cycle reaching even well-capitalized, government-supported hubs. Iran's collapse (covered above) dominates the region's numbers.
Latin America — Paraguay leads and holds; Bolivia ticked up to ~3 EH/s (+300% YoY) but remains volatile on subsidized gas; Argentina continued to decline (-30% YoY) on macro instability and site closures. Venezuela's ban-defying climb (above) is the region's wildcard.
Africa — Ethiopia's ~2.4% share (#8) remains a milestone for the continent, now increasingly a state-led project as Ethiopian Investment Holdings pursues direct ownership stakes in new facilities.
Emerging Players (<1% Global Share)
Several smaller markets are worth watching:
- Laos — ~8 EH/s (+60% YoY), hydro-powered and steady
- Finland — ~7 EH/s (+40% YoY), cold-climate efficiency
- Malaysia — ~6 EH/s, a potential Southeast Asian hub
- Bolivia — ~3 EH/s (+300% YoY), high-growth but volatile
- Georgia — ~11 EH/s (+22% YoY), a quiet Caucasus riser
Key Takeaways
- The decline is the headline, and economics own it. A -6.3% QoQ contraction — the second straight — is driven by hashprice near record lows, not by policy or geopolitics. Bitcoin's market cycle, not geography, determines whether machines stay online.
- Concentration masks churn. ~66% held by the top three is roughly flat, but composition is shifting: Kazakhstan out of the top 10, Norway in, and the US shedding the most hashrate while still leading comfortably.
- The AI overlay is structural, not cyclical. With $70B+ in AI/HPC contracts announced, the map increasingly reflects where power and capital can earn the most — and for now, that's tilting toward compute.
- Geopolitics leaves fingerprints. Iran's -71% YoY collapse and Venezuela's ban-defying climb show hashrate follows cheap power into fragile places, and that regional shocks redistribute capacity rather than remove it from the network.
- Cheap, firm power still wins. Paraguay, Ethiopia, Laos, and Finland held or grew through the down-cycle. Durable energy advantages, not subsidies, separate the markets that last from the ones that spike and fade.
On what comes next, Vera expects the pressure to persist near-term:
"More marginal capacity switching off and hashrate drifting lower until BTC price recovers and mining economics improve. The bigger unknown is how much of that capacity migrates to AI for good rather than come back."
Farahani sees the geography following suit: "Hashrate concentrating where energy is cheapest and most reliable, and more countries going flat or slightly lower while mining economics stay under pressure."
The Global Hashrate Heatmap is updated at the start of each new quarter on Hashrate Index. Access the full interactive dataset and historical comparisons under Data > Network Data > Global Hashrate Heatmap.
Review previous quarterly analysis:
— Happy Hashing!
About Luxor Technology Corporation
Luxor delivers hardware, software, and financial services that power the global compute and energy industry. Its product suite spans Bitcoin Mining Pools, ASIC Firmware, Hardware trading, Hashrate Derivatives, Energy services, a miner management platform, Commander, and a Bitcoin mining data platform, Hashrate Index.
Disclaimer
This content is for informational purposes only; you should not construe any such information or other material as legal, investment, financial, or other advice.

Hashrate Index Newsletter
Join the newsletter to receive the latest updates in your inbox.