
Luxor Hashrate Lookback Series – November 2025
November 2025’s hashrate and hashprice trends, forward market participation, trading activity and contract performance.
Luxor’s Monthly Lookback Series is a deep dive into Bitcoin hashrate market activity. In this post, we cover November 2025’s hashrate market and hashprice trends, forward market participation, trading activity and contract performance.
Summary
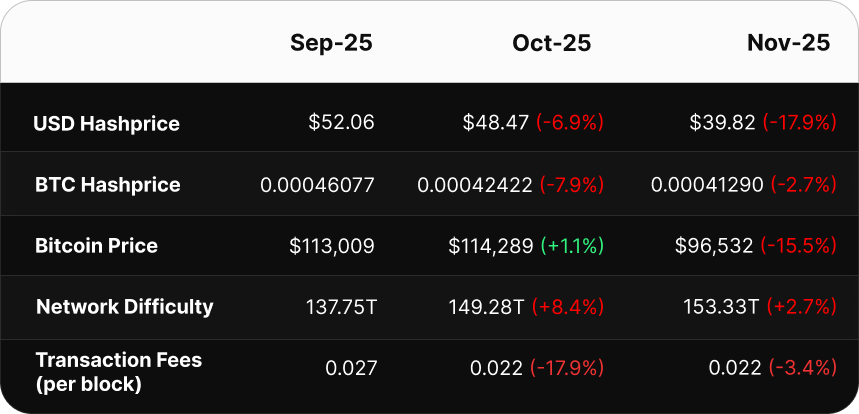
- No-luck November: Bitcoin fell hard in November, with the monthly average price dropping to $96,532 (-15.5%) and erasing YTD gains. Meanwhile, network difficulty kept climbing to a monthly average of 153.33T (+2.7%), despite two negative adjustments.
- Hashprice Dips Into The Deep End: USD hashprice averaged $39.82 (-17.9%), hitting a new all-time low of $35.06 on November 22. BTC hashprice averaged 0.00041 BTC (-2.7%), cushioned slightly by downward difficulty adjustments on November 12 (-2.37%) and November 26 (-1.95%).
- Fixed Pool Payouts Dominate: Early USD-denominated forward sales (June–August) outperformed spot (FPPS) by 30–40%, while later hedges in September–October delivered +22%. BTC-denominated sellers locked in 10–14% more BTC than spot, with even 1-month sales posting +2% outperformance.
- Forward Curves Signal Weak Economics Ahead: Between November 3 and December 1, USD forwards for Dec 2025 – Apr 2026 fell by 16–18%, while BTC forwards rose by 5–8%. The forward hashrate market expects weaker near-term USD mining revenues and network-side relief via slower difficulty growth.
November 2025 Spot Hashprice & Its Constituents
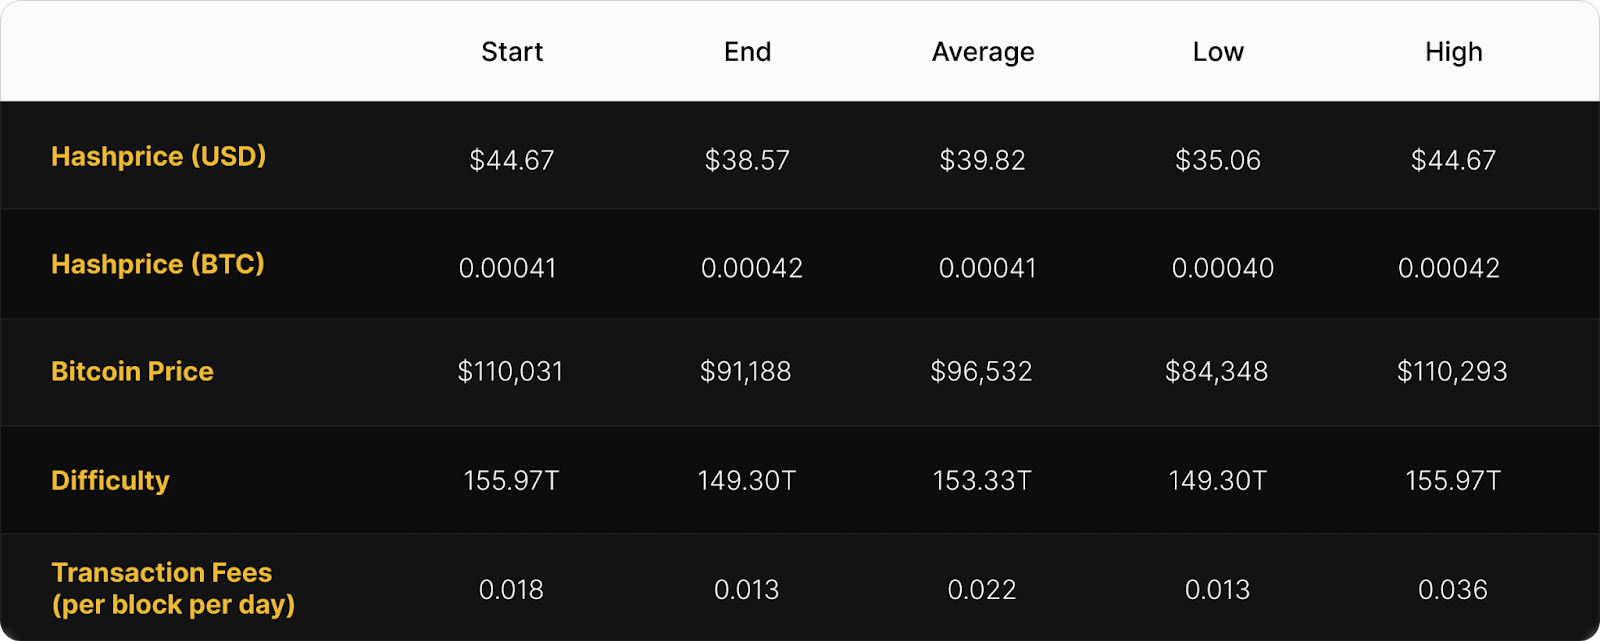
In November, Bitcoin mining economics took a turn for the worse. USD-denominated hashprice averaged $39.82 (-17.9%), and BTC-denominated hashprice averaged 0.00041 BTC (-7.9%) per PH/s/Day. This trend was driven by a significant downturn in bitcoin price (-15.5%). Meanwhile, monthly average network difficulty rose (+2.7%), and transaction fees fell (-3.4%), still remaining at near all-time lows in BTC terms.
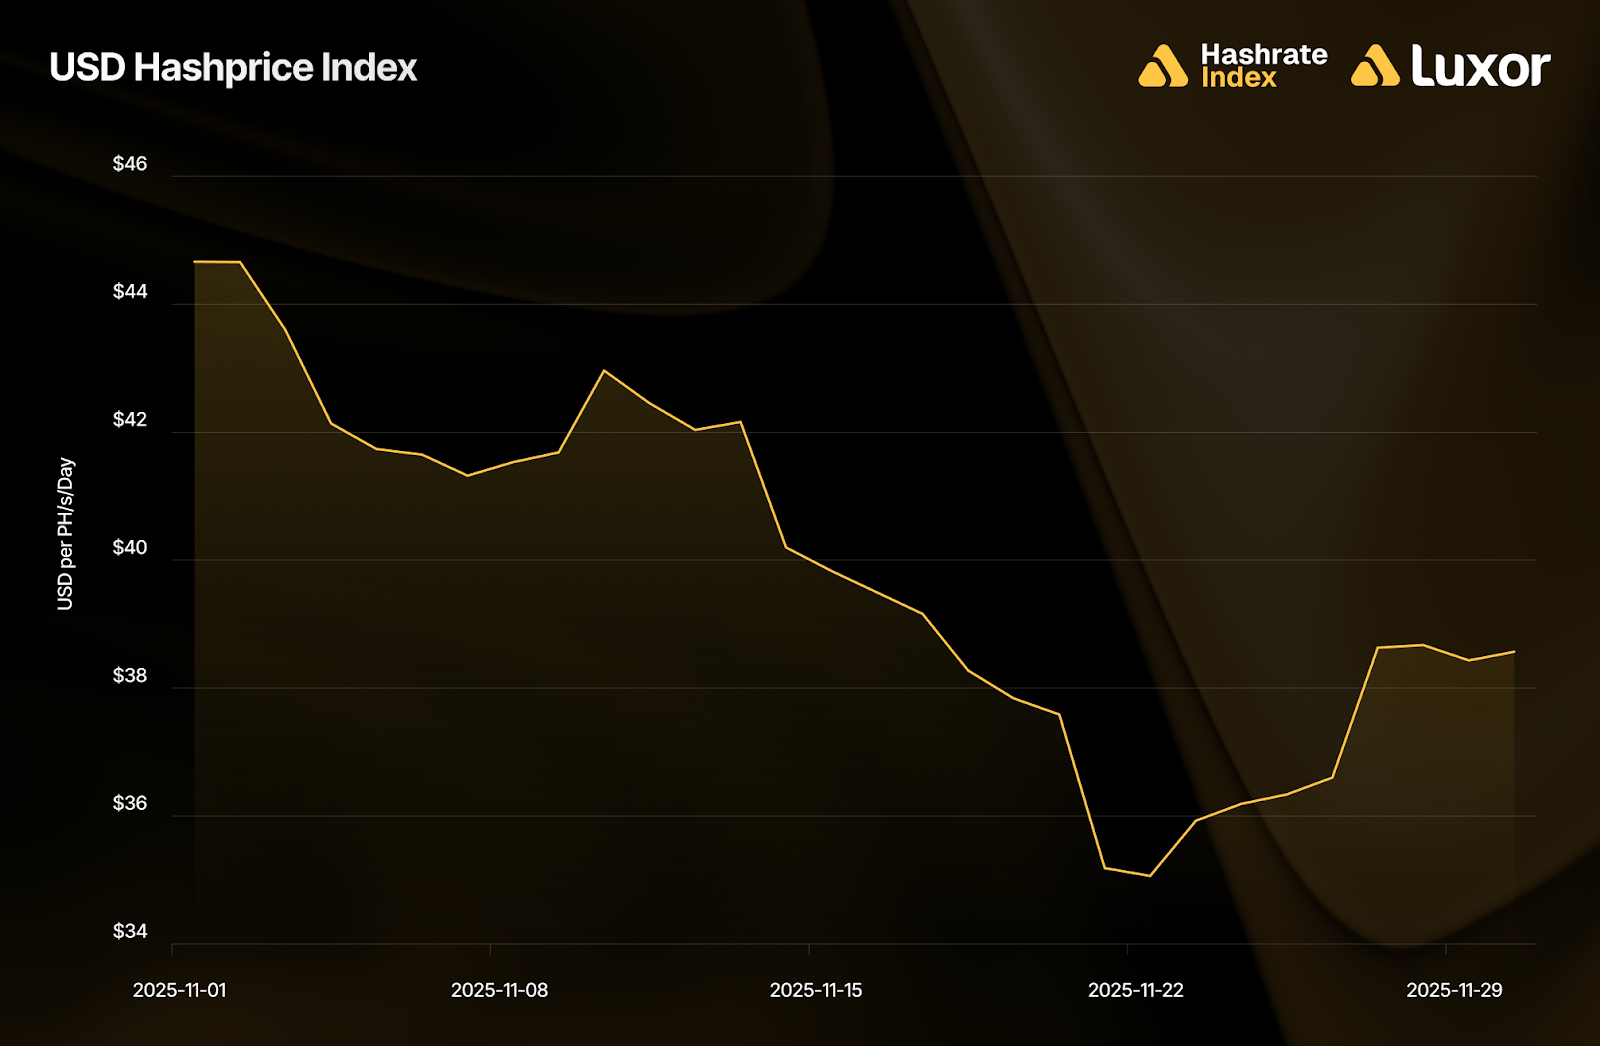
USD hashprice started November at $44.67 per PH/s/Day and trended down to $35.06 on November 22, a new all-time low. It closed the month at $38.57, ranging between $35.06–$44.67, with a monthly average of $39.82 (-17.9%). This marks the largest USD hashprice drawdown since September 2022 (-20.8%), and the 20th largest on record since inception of Luxor’s Bitcoin Hashprice Index in 2017.
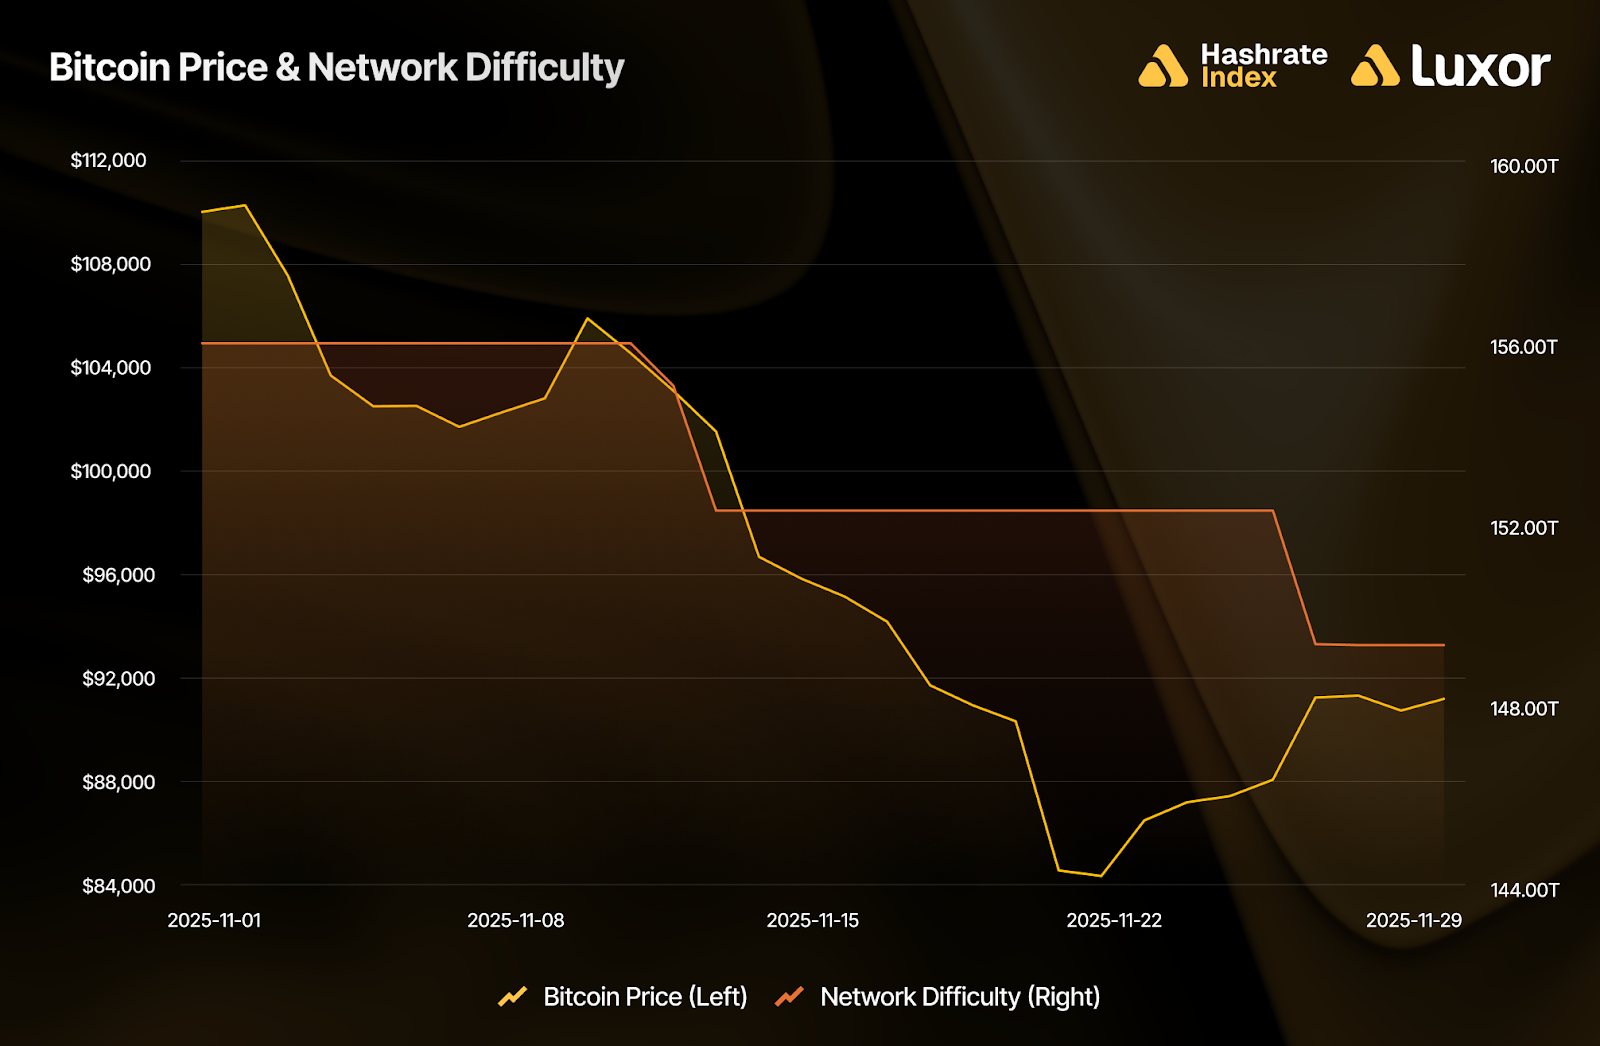
Average bitcoin price was down bad in November. BTC opened at $110,031 and slid to $91,188 by month-end, erasing year-to-date (YTD) gains and leaving a monthly average of $96,532 (-15.5%). This drawdown was the steepest since June 2022 (–23.3%), and stands as the 12th largest monthly decline since 2017.
Network difficulty reached a new all-time high of 155.97T in early November. This was driven by an upward adjustment (+6.31%) on October 29, the second-largest increase of the year. It then retreated to 149.30T after two negative adjustments on November 12 (-2.37%) and November 26 (-1.95%), marking the third difficulty decrease since July and bringing the year’s tally to 8 downward adjustments versus 16 upward. The monthly average difficulty experienced by operators came in at 153.33T (versus 149.28T in October) — a 2.7% increase.
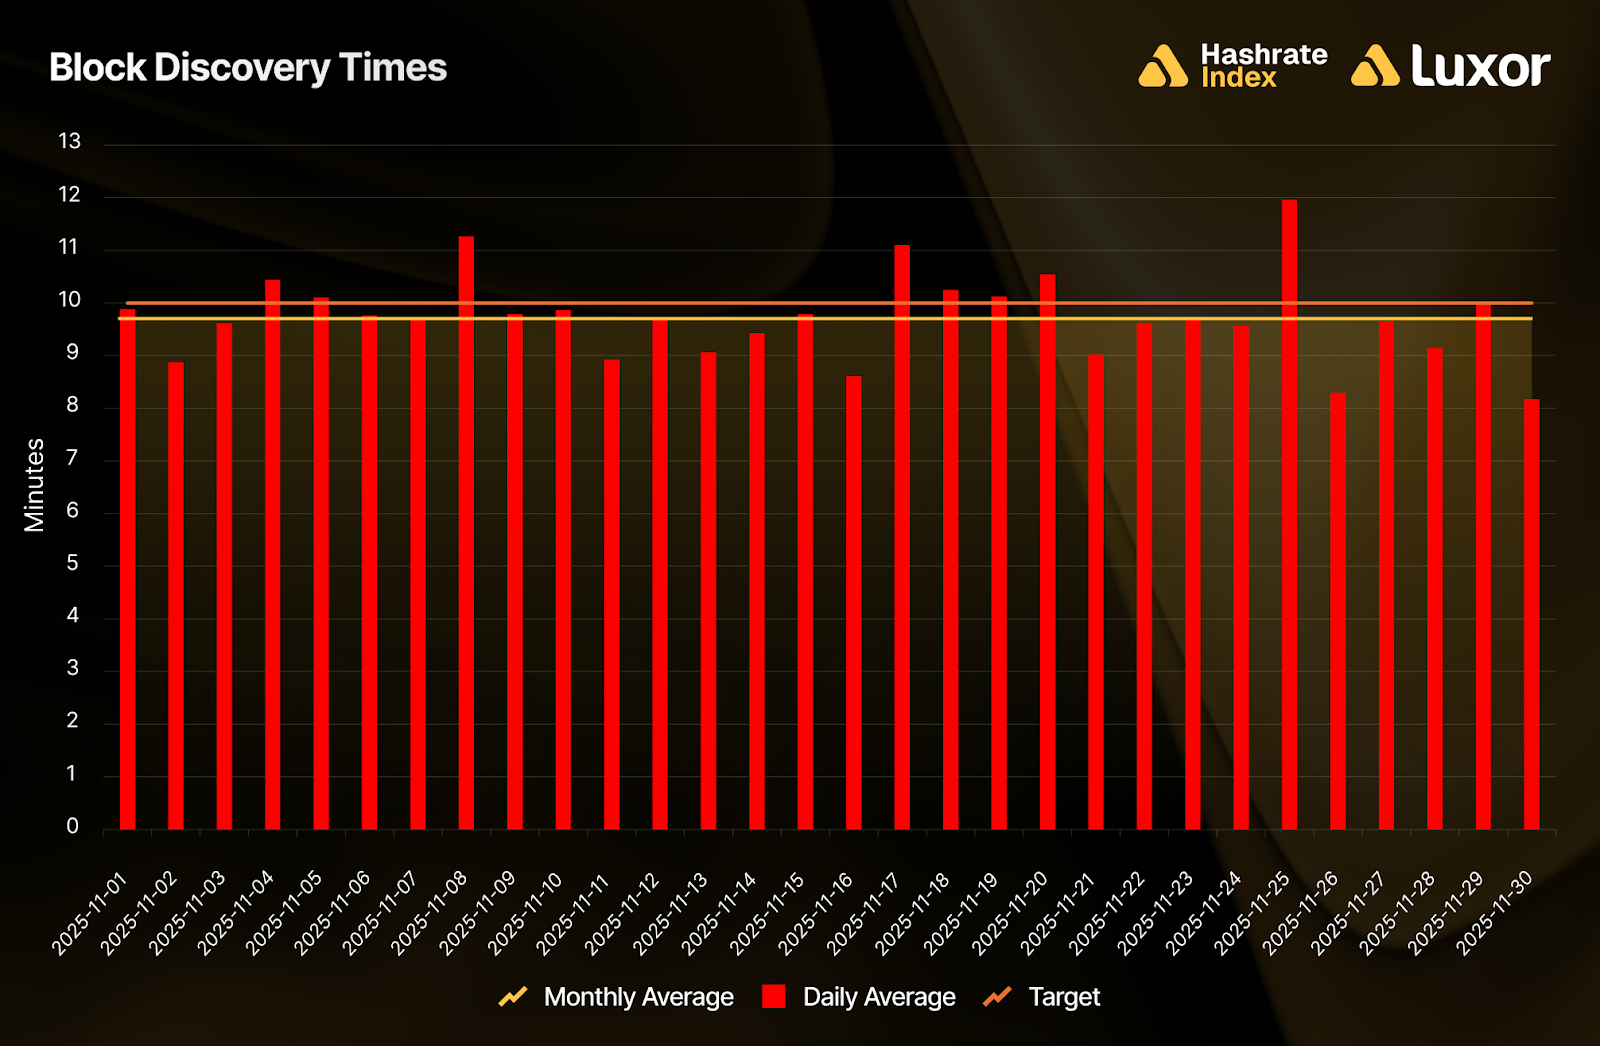
The negative difficulty adjustments were caused by slower-than-target block times, as marginal hashrate dropped off the network in response to hashprice. 9 out of 30 days (30%) in November averaged block times above the 10-minute target, coming in at a monthly average of 9 minutes 44 seconds per block.
Back in early October, Bitcoin briefly hit a new all-time high of $124,485 before its price reversal. Since then, network hashrate (7D-SMA) has declined by ~9%. In comparison, Hashrate Index’s base case scenario for Q4-2025’s mining economics projections estimates ~8% of marginal hashrate dropping offline due to unprofitability given a BTC price drop from $125,000 to $92,500.
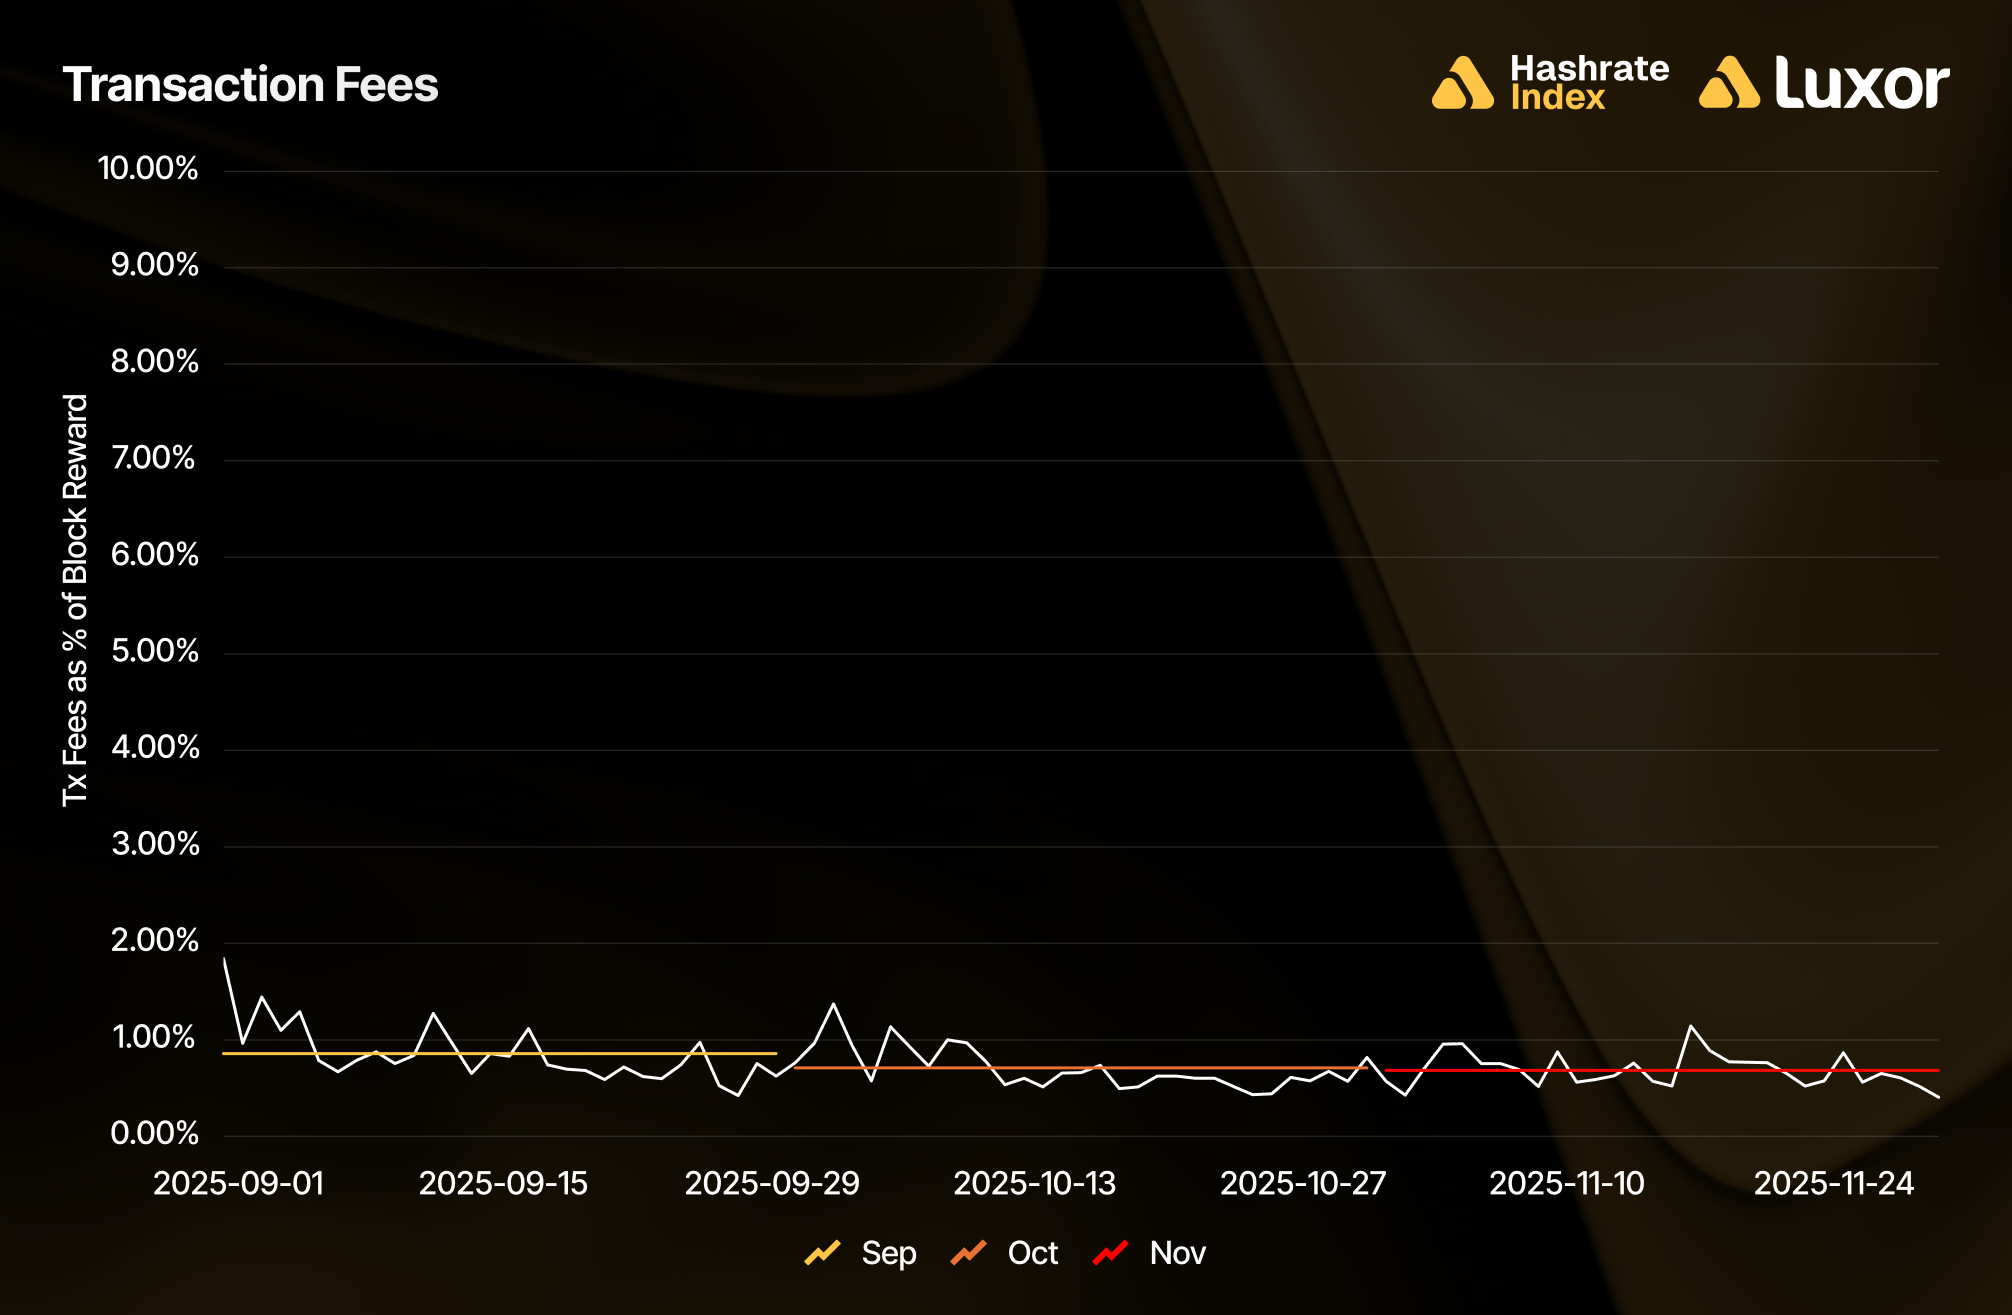
Transaction fees saw a slight decline in November. On a BTC-denominated basis, miners collected an average of 0.022 BTC (per block per day), a 3.4% decrease from October, and still the lowest since February 2011.
With bitcoin price action deep in the red, the picture was much worse on a USD-denominated basis: average fee collection came out to $2,080 per block per day (versus $2,573 in October), a 19.2% decrease. Overall, transaction fees constituted 0.68% of total block rewards, compared to 0.71% in the prior month.
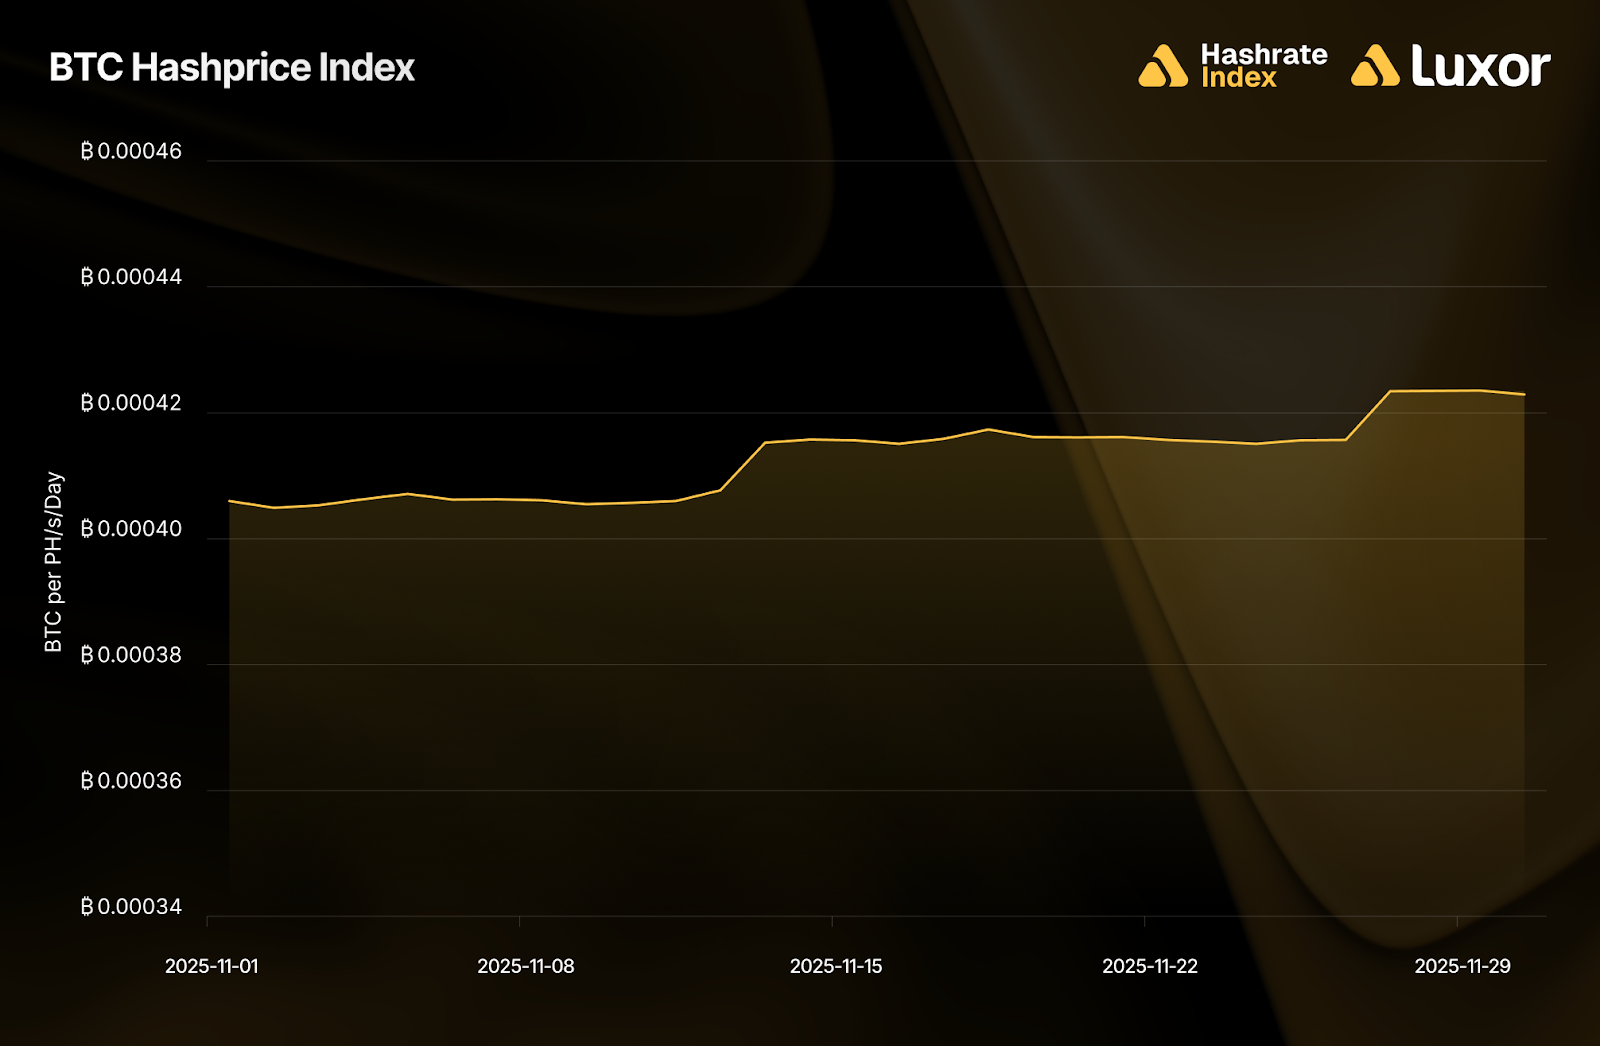
BTC-denominated hashprice mostly reflected network difficulty adjustments in November. It began at 0.00041 BTC per PH/s/Day and slightly ticked up to close the month at 0.00042 BTC, following the two negative difficulty adjustments on November 12 and November 26. Overall, BTC hashprice averaged 0.00041 BTC per PH/s/Day, declining 2.7% month-over-month.
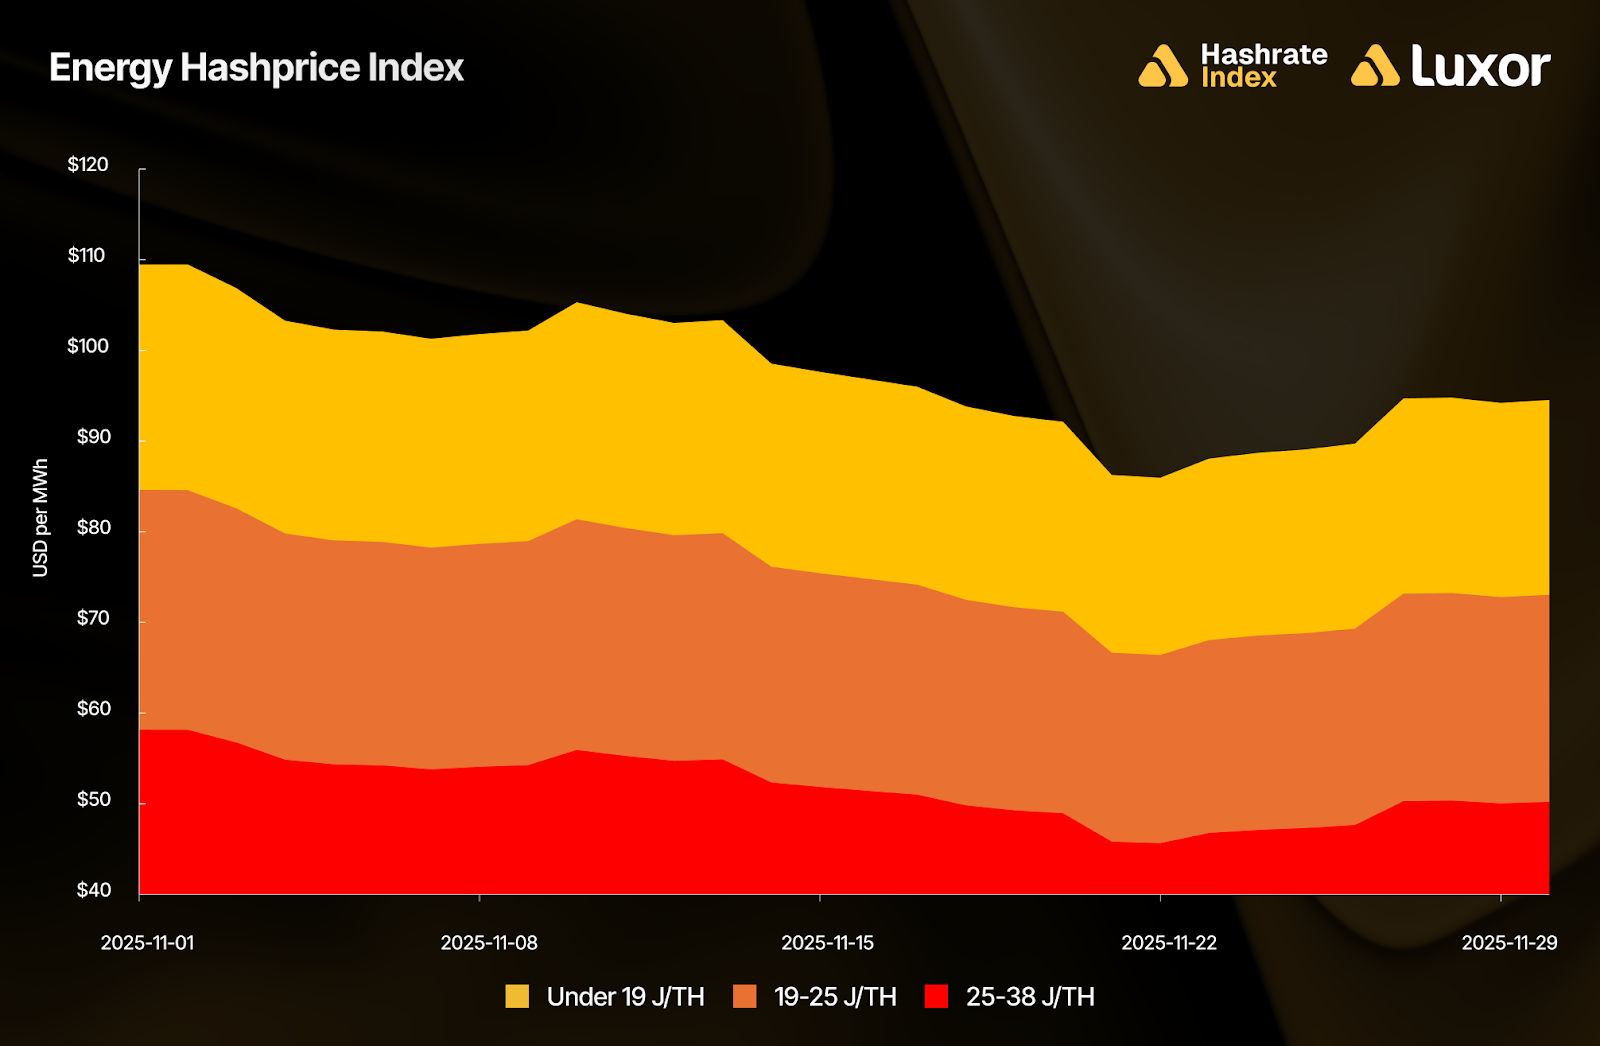
In November, operations with sub-19 J/TH fleets earned approximately $98 per MWh in mining revenues, whereas miners in the 19–25 J/TH tier earned $75 per MWh and the 25–38 J/TH tier earned $52 per MWh, respectively.
For fleets running 25–38 J/TH machines, November revenues of roughly $52 per MWh sit near the estimated average network electricity cost, placing these machines on the verge of shutdown. When mining revenues fall below power cost, the rational response is curtailment, and the network behaved accordingly: marginal fleets very likely turned off in November, contributing to the two difficulty drops observed over the period as block times slowed. On the other hand, since new-generation fleets offer wider operating margins, there is still a strong compute revenue-per-watt incentive for miners to continue deploying those machines.
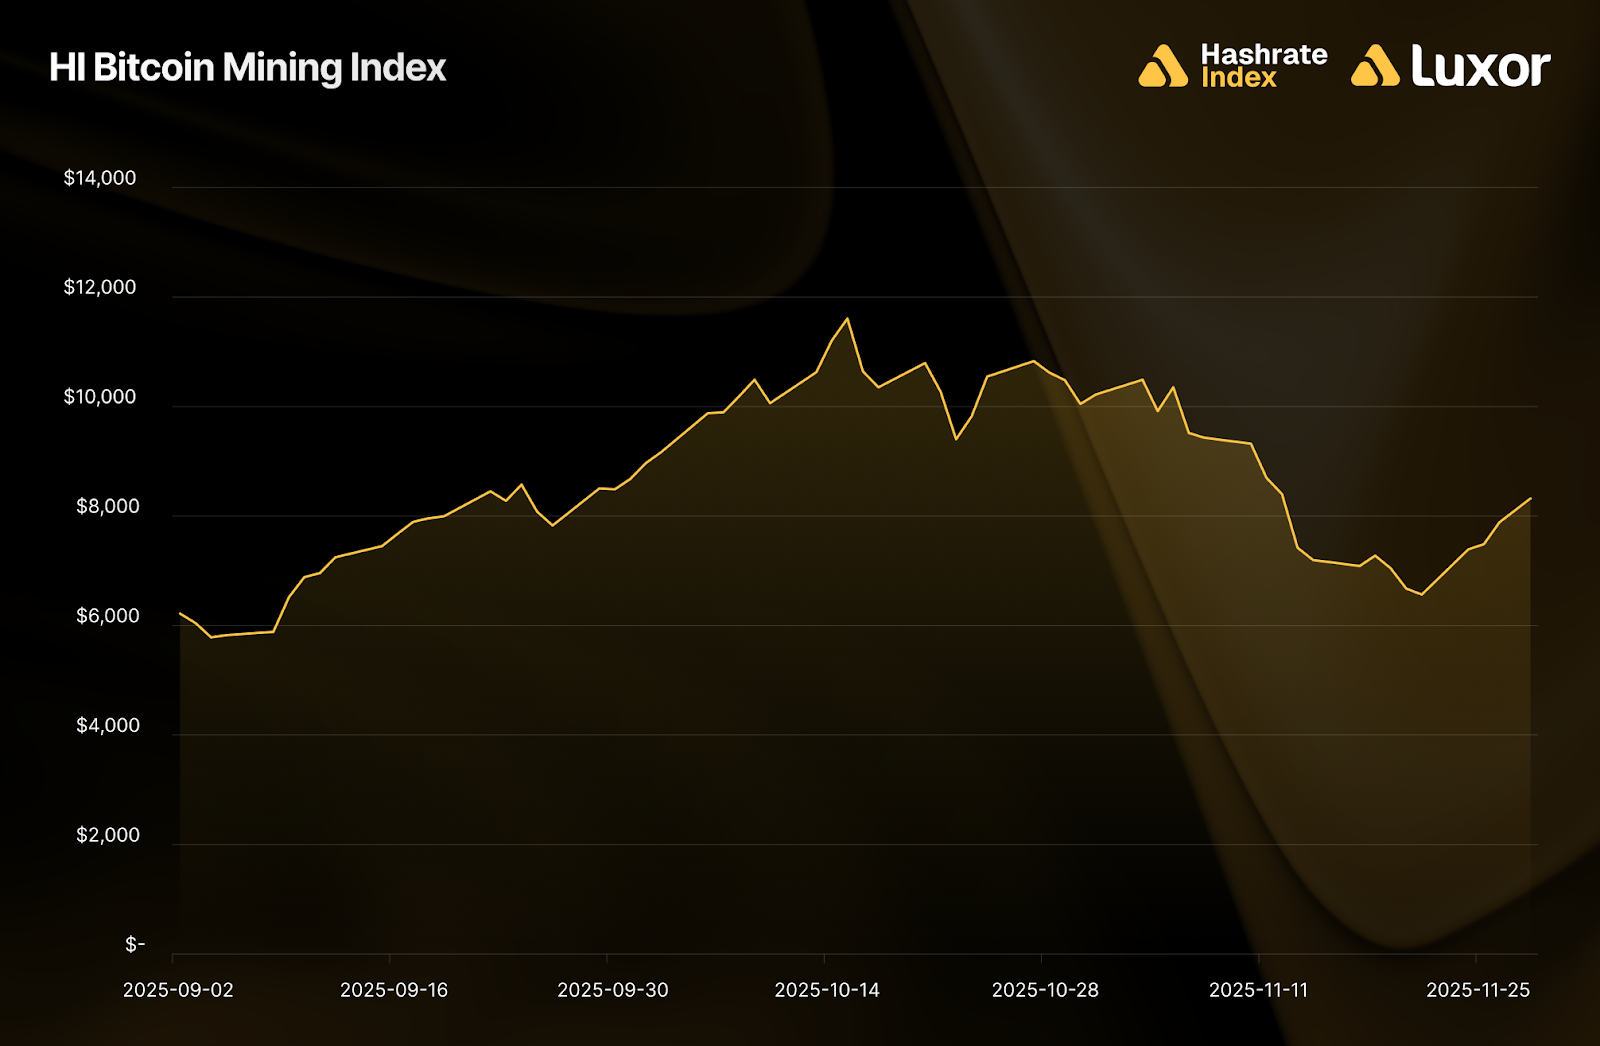
Bitcoin mining equities surged back in September, pushing Hashrate Index’s Bitcoin Mining Stock Index above its prior 2021 all-time high. The bid was broad but uneven: AI/HPC-pivoting miners saw the most aggressive re-pricing, while the sector as a whole appeared to benefit. However, that momentum stalled by mid-October. After peaking at $11,606 on October 15, the index reversed and retraced 39.5% by end of November, closing at $8,317. This reversal tracks the collapse in hashprice, rising network difficulty, and the resultant compression in mining margins, in addition to a broader pullback in technology-related equities through November.
November 2025 Hashrate Market Activity
Our analysis of the November 2025 hashrate market focuses on two key points: how the November 2025 hashrate contract traded in previous months and how the forward curve shifted in November, based on pricing for forward hashrate during the month.
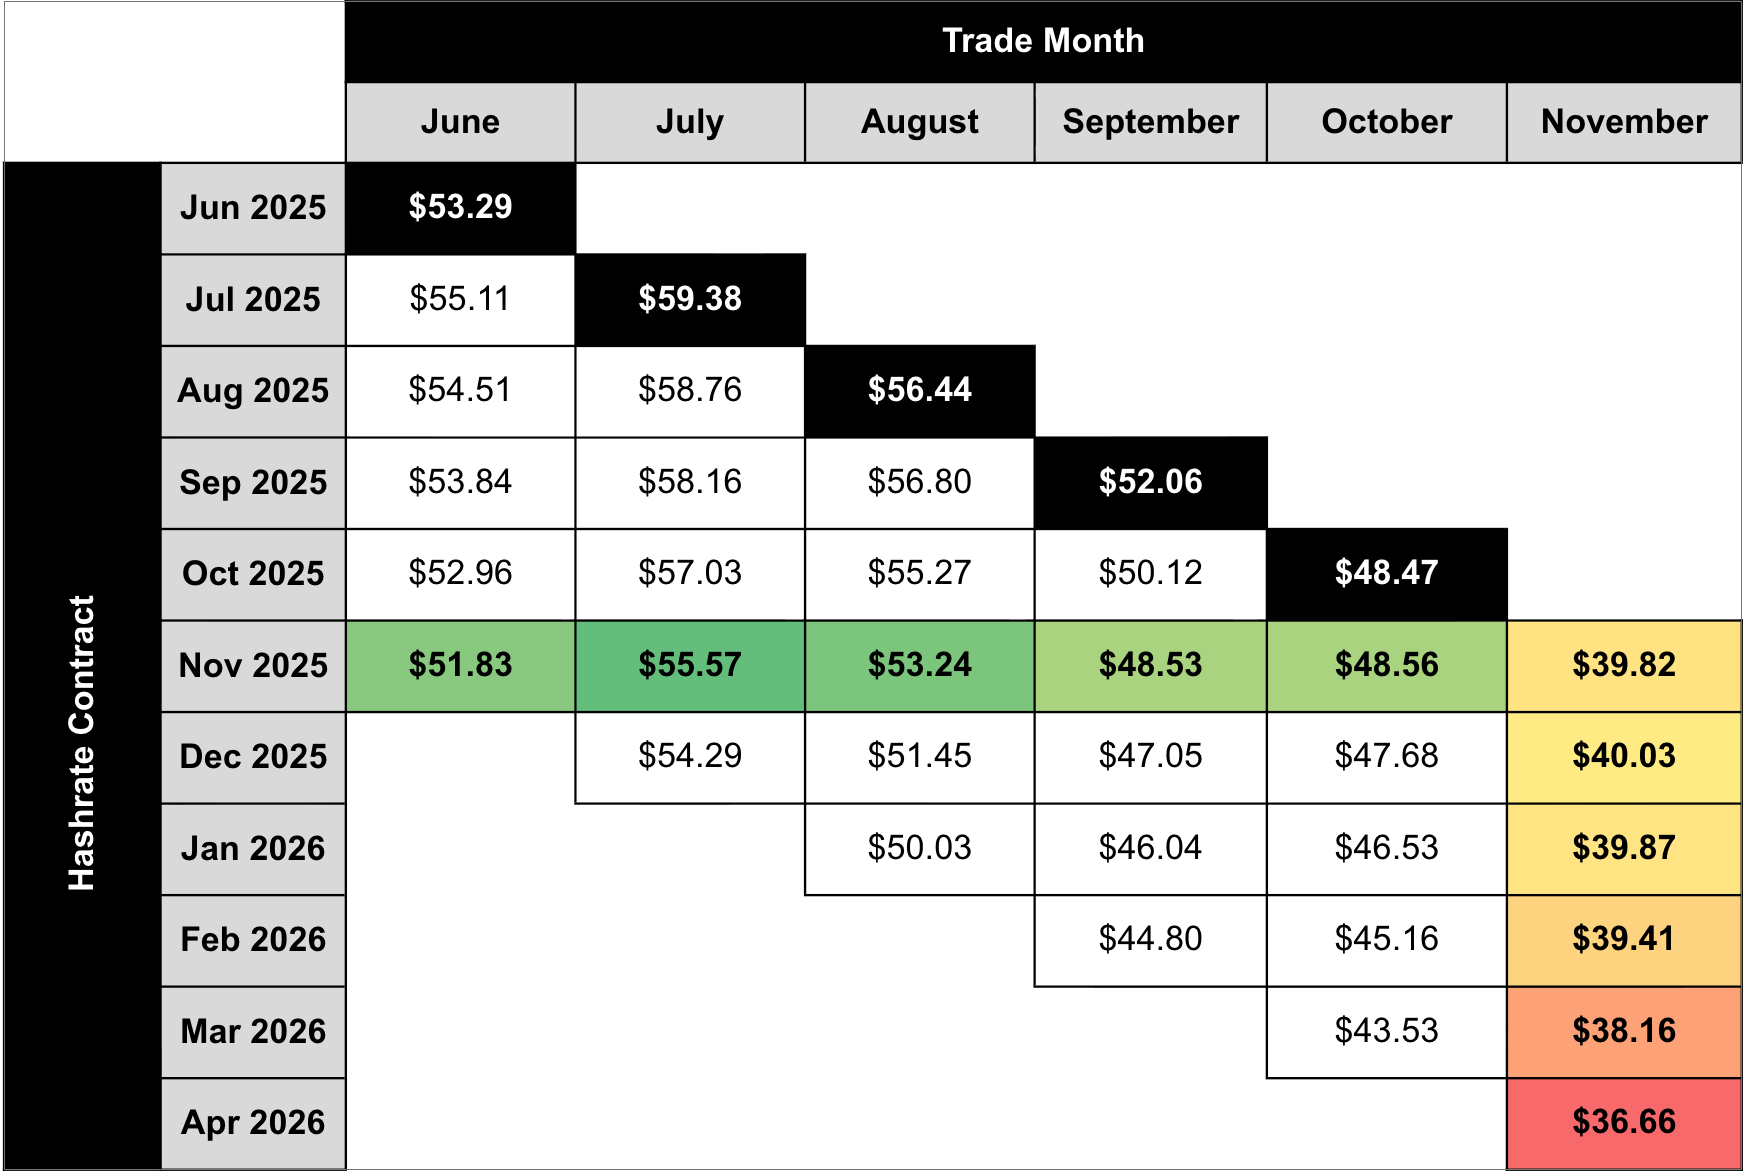
The two tables below show the evolution of Luxor’s USD and BTC denominated hashrate forward markets from June 2025 – November 2025. Rows represent specific monthly contracts, while columns represent each trading month. Cell values indicate the average monthly mid-market hashprice — except for the bold highlighted main diagonal — which shows actual spot hashprice settlement in each month.
This table summarizes both the trading history of the November 2025 USD contract (colored row) and the forward curve in November (colored column).
This table summarizes both the trading history of the November 2025 BTC contract (colored row) and the forward curve in November (colored column).
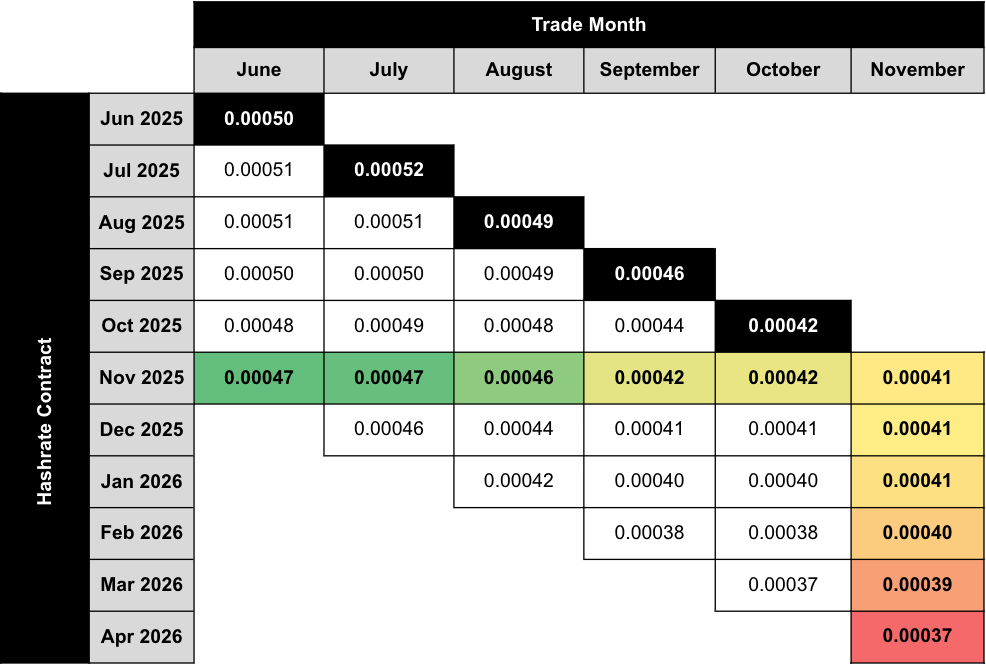
Note: all values (except for the bold highlighted main diagonal) shown in figures represent mid-market rates, the midpoint of the best bid and ask on Luxor's Non-Deliverable Hashrate Forward market. The bold highlighted main diagonal shows actual spot hashprice settlement in each month, measured by Luxor’s Bitcoin Hashprice Index.
The table below shows the type of market participants on the buy and sell side of Luxor’s deliverable (DF) and non-deliverable hashrate forward (NDF) market. In November, lenders were active on the buy side of the DF market, while public and private miners used the contract to sell forward, receive financing, and expand their fleet.
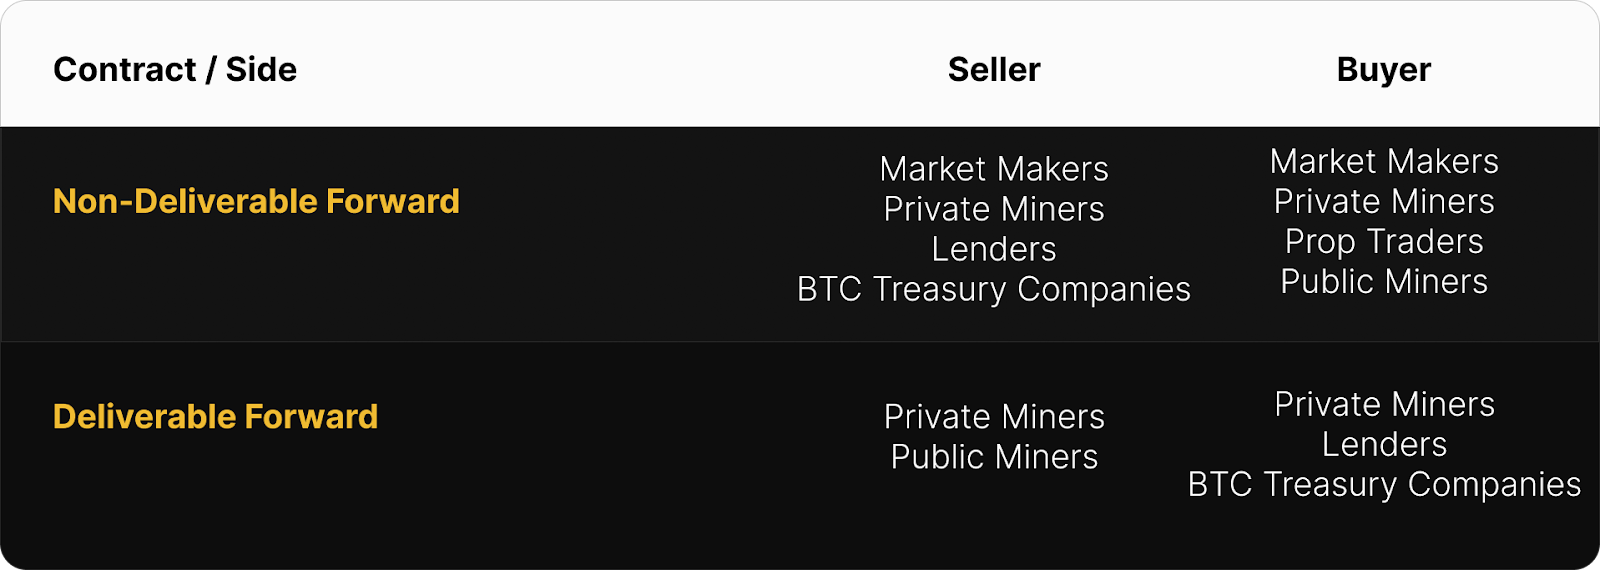
Since the DF involves upfront payment, it tends to trade at a discount to the NDF, compensating the buyer for the inherent credit risk. We see the discount of DF’s relative to NDF’s as the interest rate in hashrate-based lending markets. Buyers and sellers of the DF with upfront payment can use the NDF to lock-in a fixed yield (cost of capital) instead of having exposure to hashprice uncertainty.
This strategy was used by lenders and Bitcoin treasury companies (Buy DF & Sell NDF) to earn a BTC-denominated return and by miners (Sell DF & Buy NDF) to obtain non-dilutive financing. In November 2025, that yield (cost of capital) was in the 6–13% (annualized) range.
How November 2025 Hashrate Traded
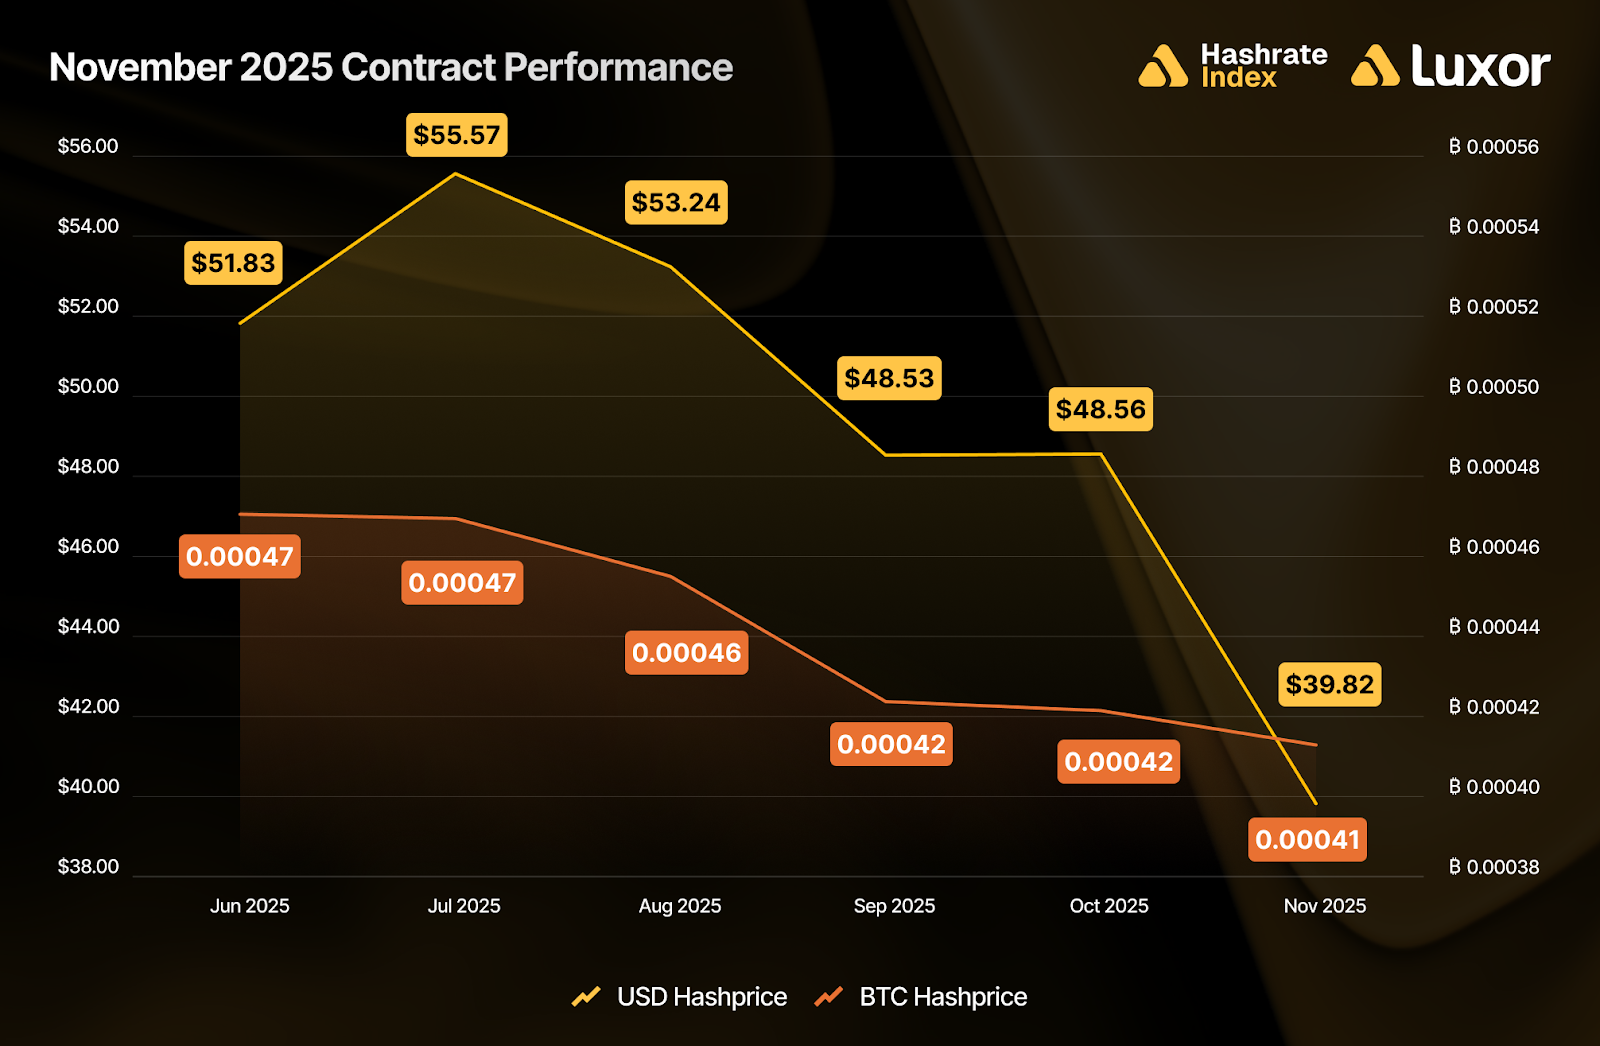
In both USD and BTC terms, November 2025 favored sellers across the board. As hashprice fell through the month, forward sellers outperformed spot mining (FPPS) across all intervals. USD contracts locked in between $48.56–$55.57 per PH/s/Day versus a $39.82 settlement, while BTC contracts locked in between 0.00042 BTC–0.00047 BTC versus 0.00041 BTC at spot.
The tables below summarize how a 1 EH mining operation would have performed by selling November 2025’s hashrate forward — one showing USD revenue outcomes, and the other showing total BTC production — compared to spot mining via FPPS.
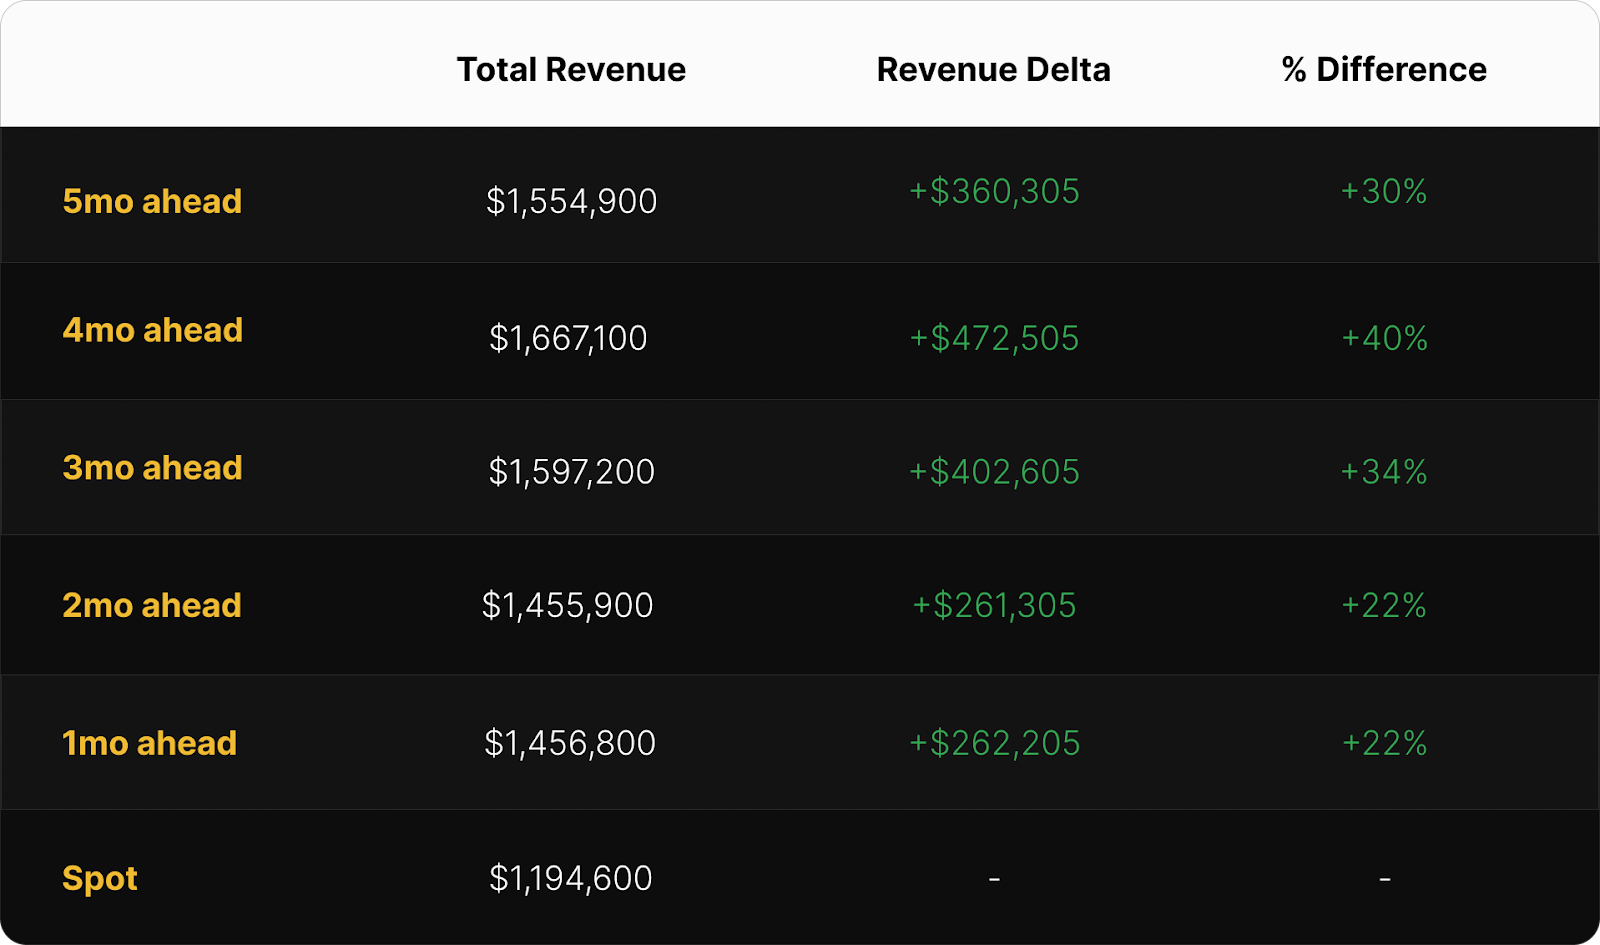
In USD terms, early forward sales (June–August) outperformed spot FPPS by 30–40%, while later hedges in September and October saw gains of 22%. The optimal trade for the USD-denominated October 2025 contract would have been to sell four months forward during July (+40%), which would have locked in a hashprice of $55.57 per PH/s/Day.
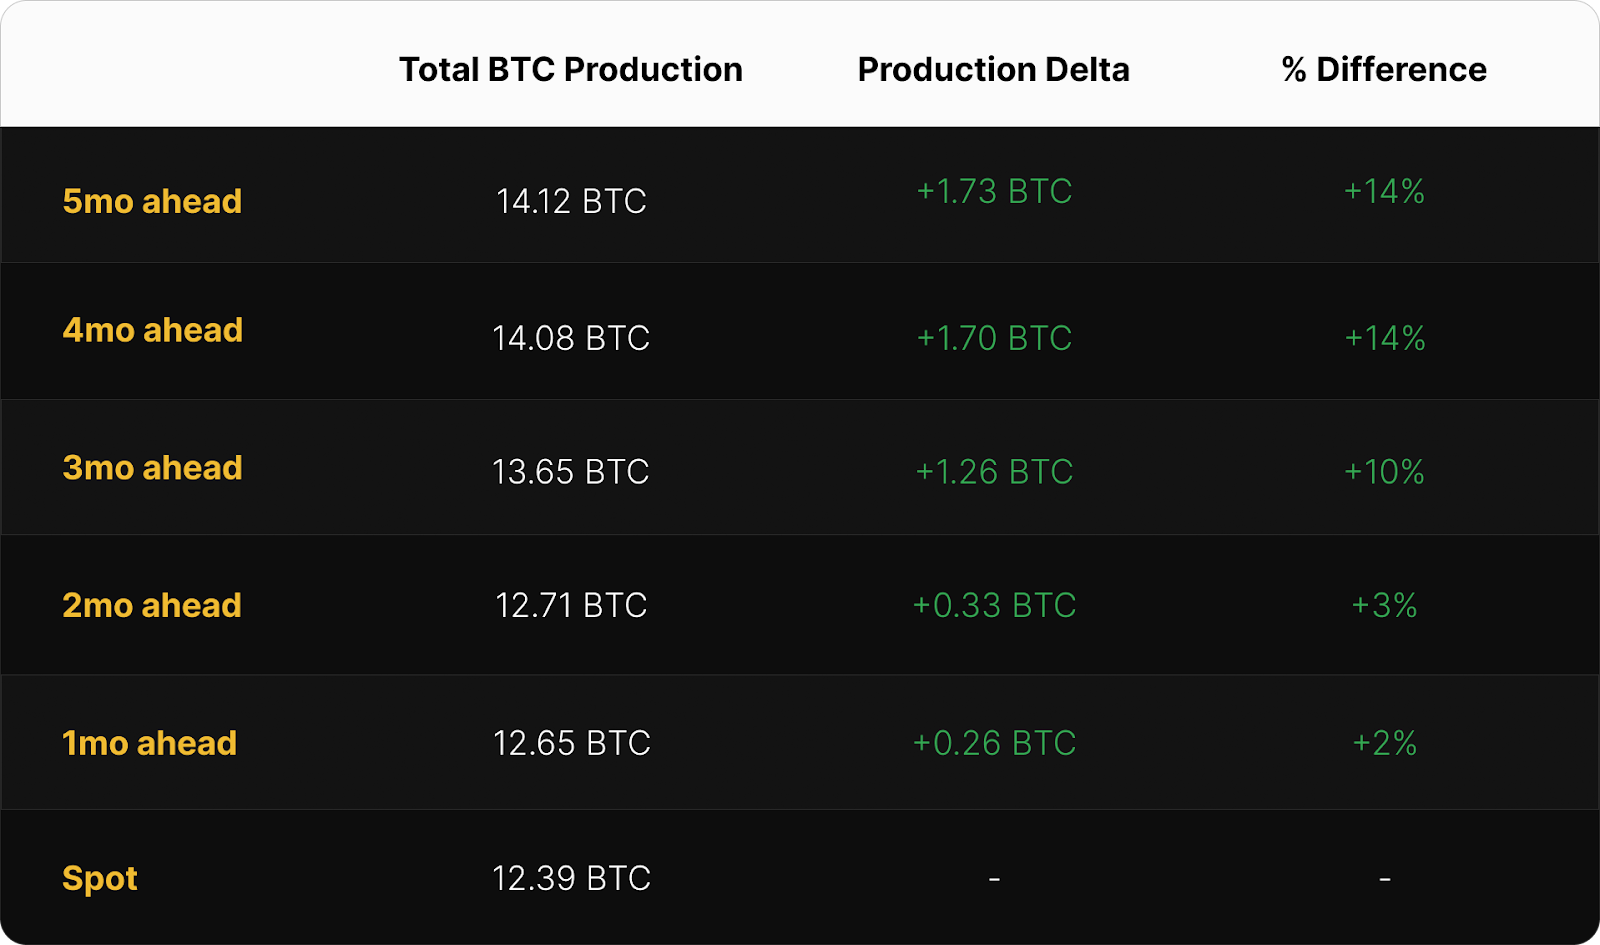
On the BTC-denominated side, sellers again came out ahead. Miners who sold November’s hashrate three or more months in advance earned over 10% more BTC than spot FPPS miners, with June and July’s forward sales leading at +14%. Even one-month sellers outperformed FPPS by about 2%.
Zooming out, the following chart shows the performance for a range of rolling hedge strategies relative to spot FPPS mining, segmented by contract denomination and hedge horizon over the past year, from November 2024 – November 2025:
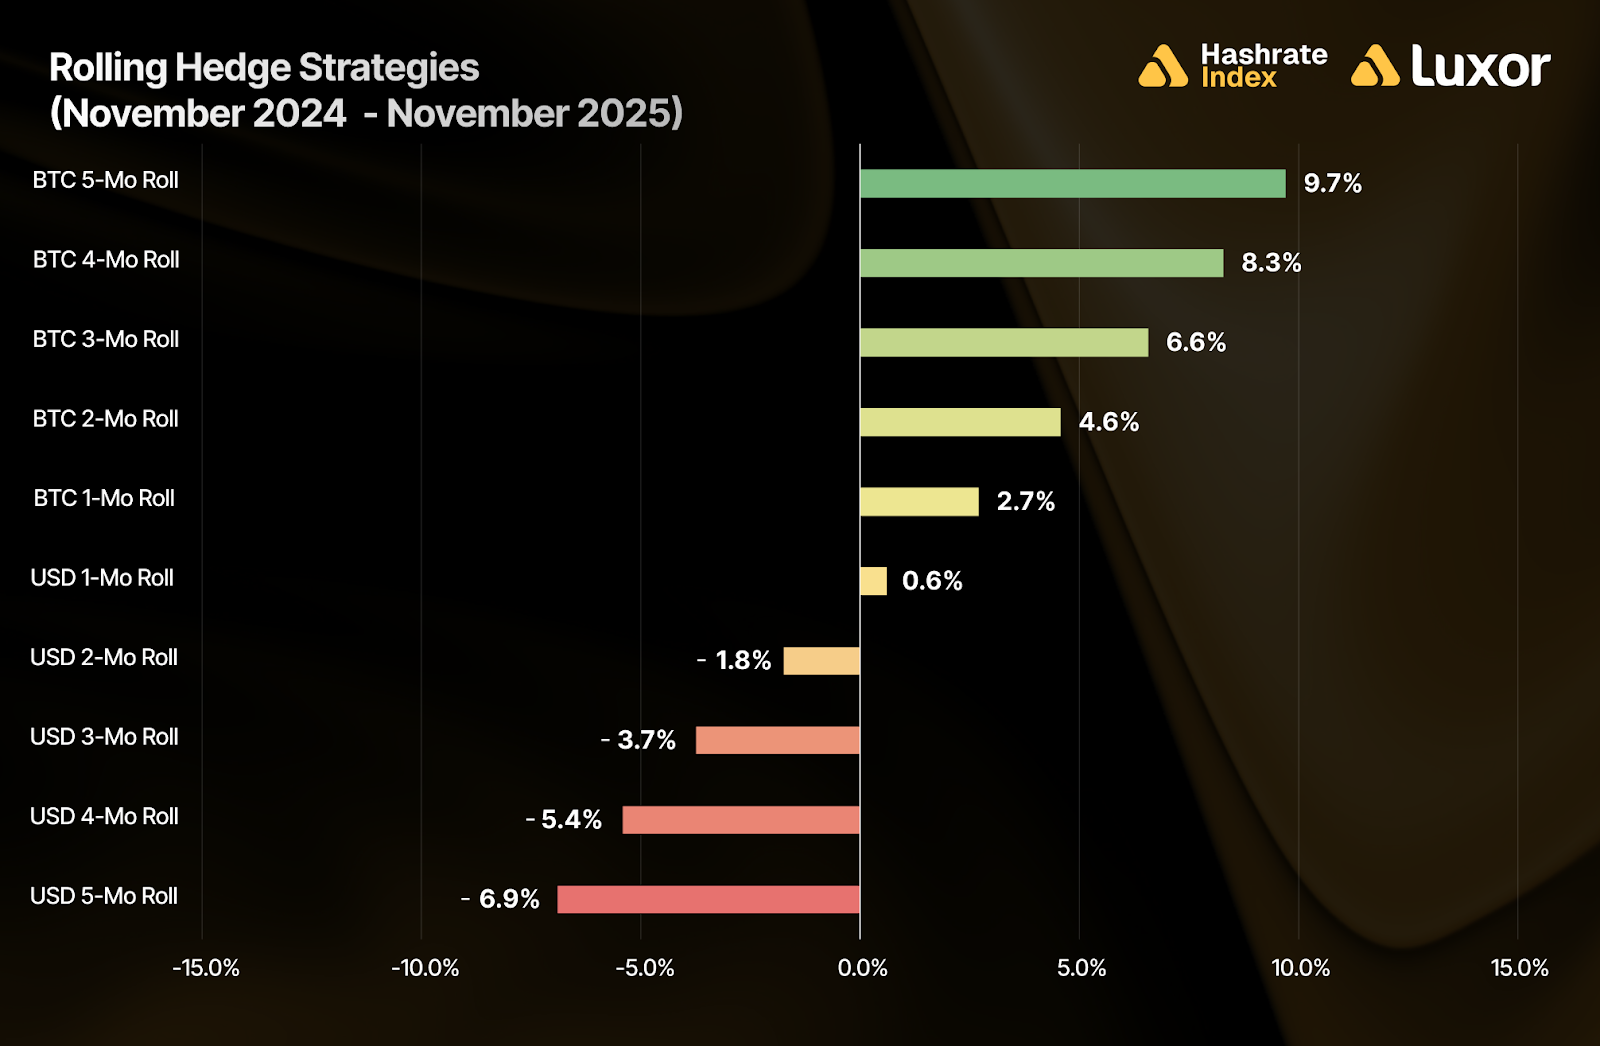
This comparison reveals that rolling BTC-denominated hedging strategies outperformed between November 2024 and November 2025, with the strongest results coming from 5-month (+9.7%) and 4-month forward sales (+8.3%). These longer-duration contracts generally benefited from being priced ahead of rising network difficulty and low fee environments, while still maintaining bitcoin price exposure.
In contrast, USD-denominated hedging underperformed spot FPPS by an average of -3.4% because of rising bitcoin price action. Interestingly, results for the 1-month USD-denominated forward sale strategy turned positive in November, given the collapse in bitcoin price over that period.
Note: these figures are strictly for demonstration purposes and exclude fees and bid/ask spreads associated with entering into hashrate forward contracts.
A second caveat: although selling forward proved to be favorable during timeframes shown above, it is critical to recognize that hedging is typically a cost of business rather than a revenue generation method. Hedgers willingly pay a price to buy certainty and obtain more predictable cash flows, which increases valuation, reduces cost of capital, and ultimately attracts investments.
How Future Hashrate Traded in November 2025
The two tables below summarize the evolution of hashrate forward markets during November 2025, for the subsequent five months from December 2025 – April 2026. Rows represent specific monthly hashrate contracts, while columns represent specific trading days. Cell values indicate the average daily mid-market price, except for spot prices.
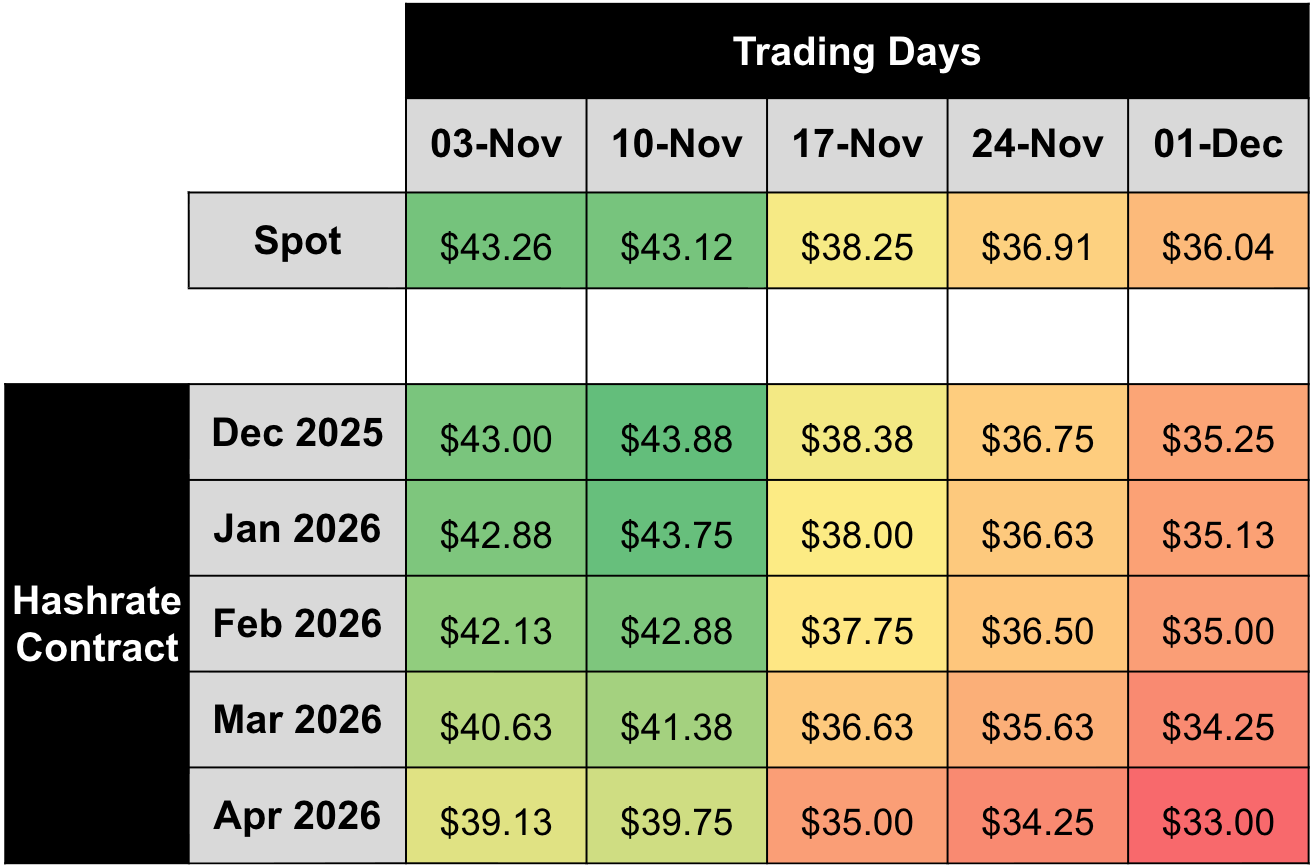
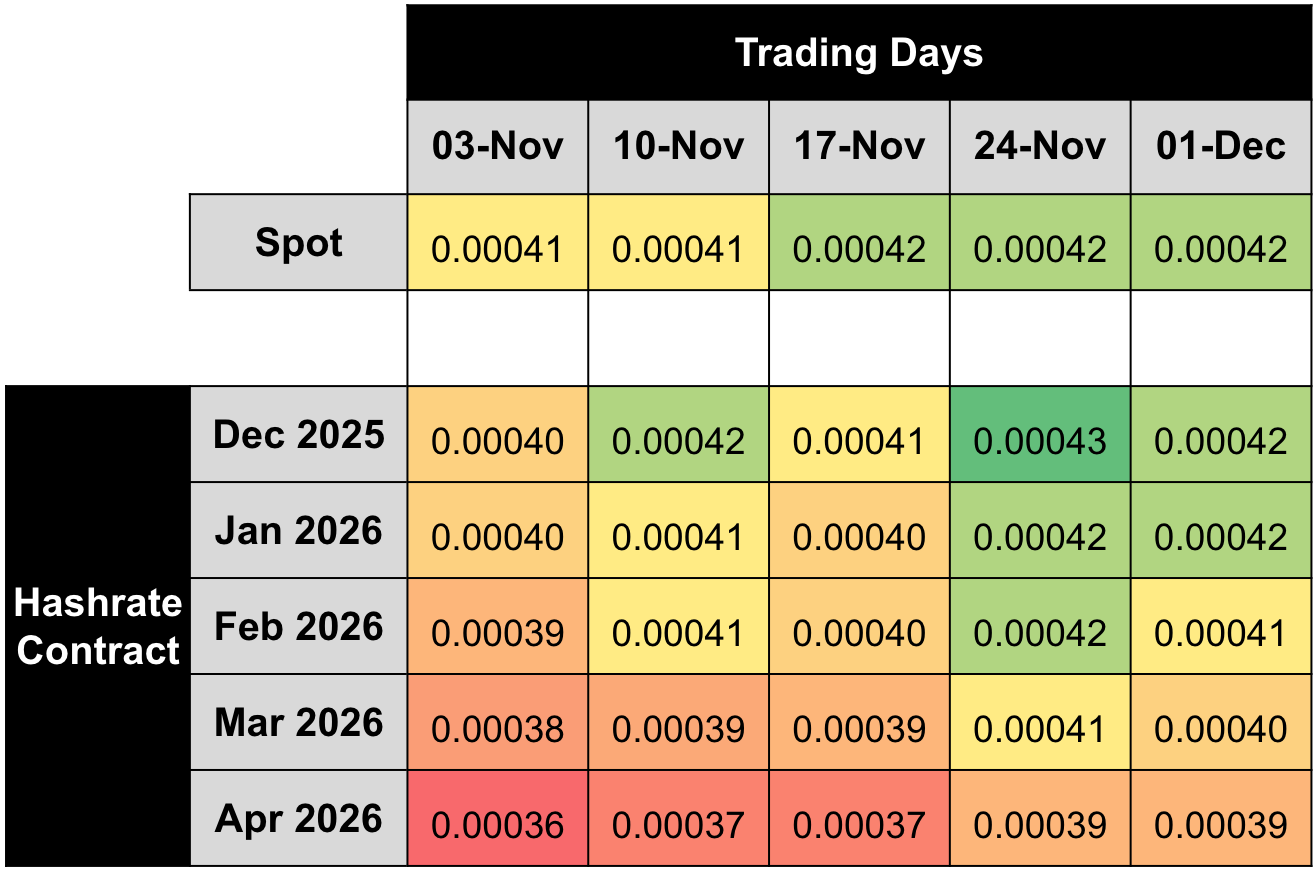
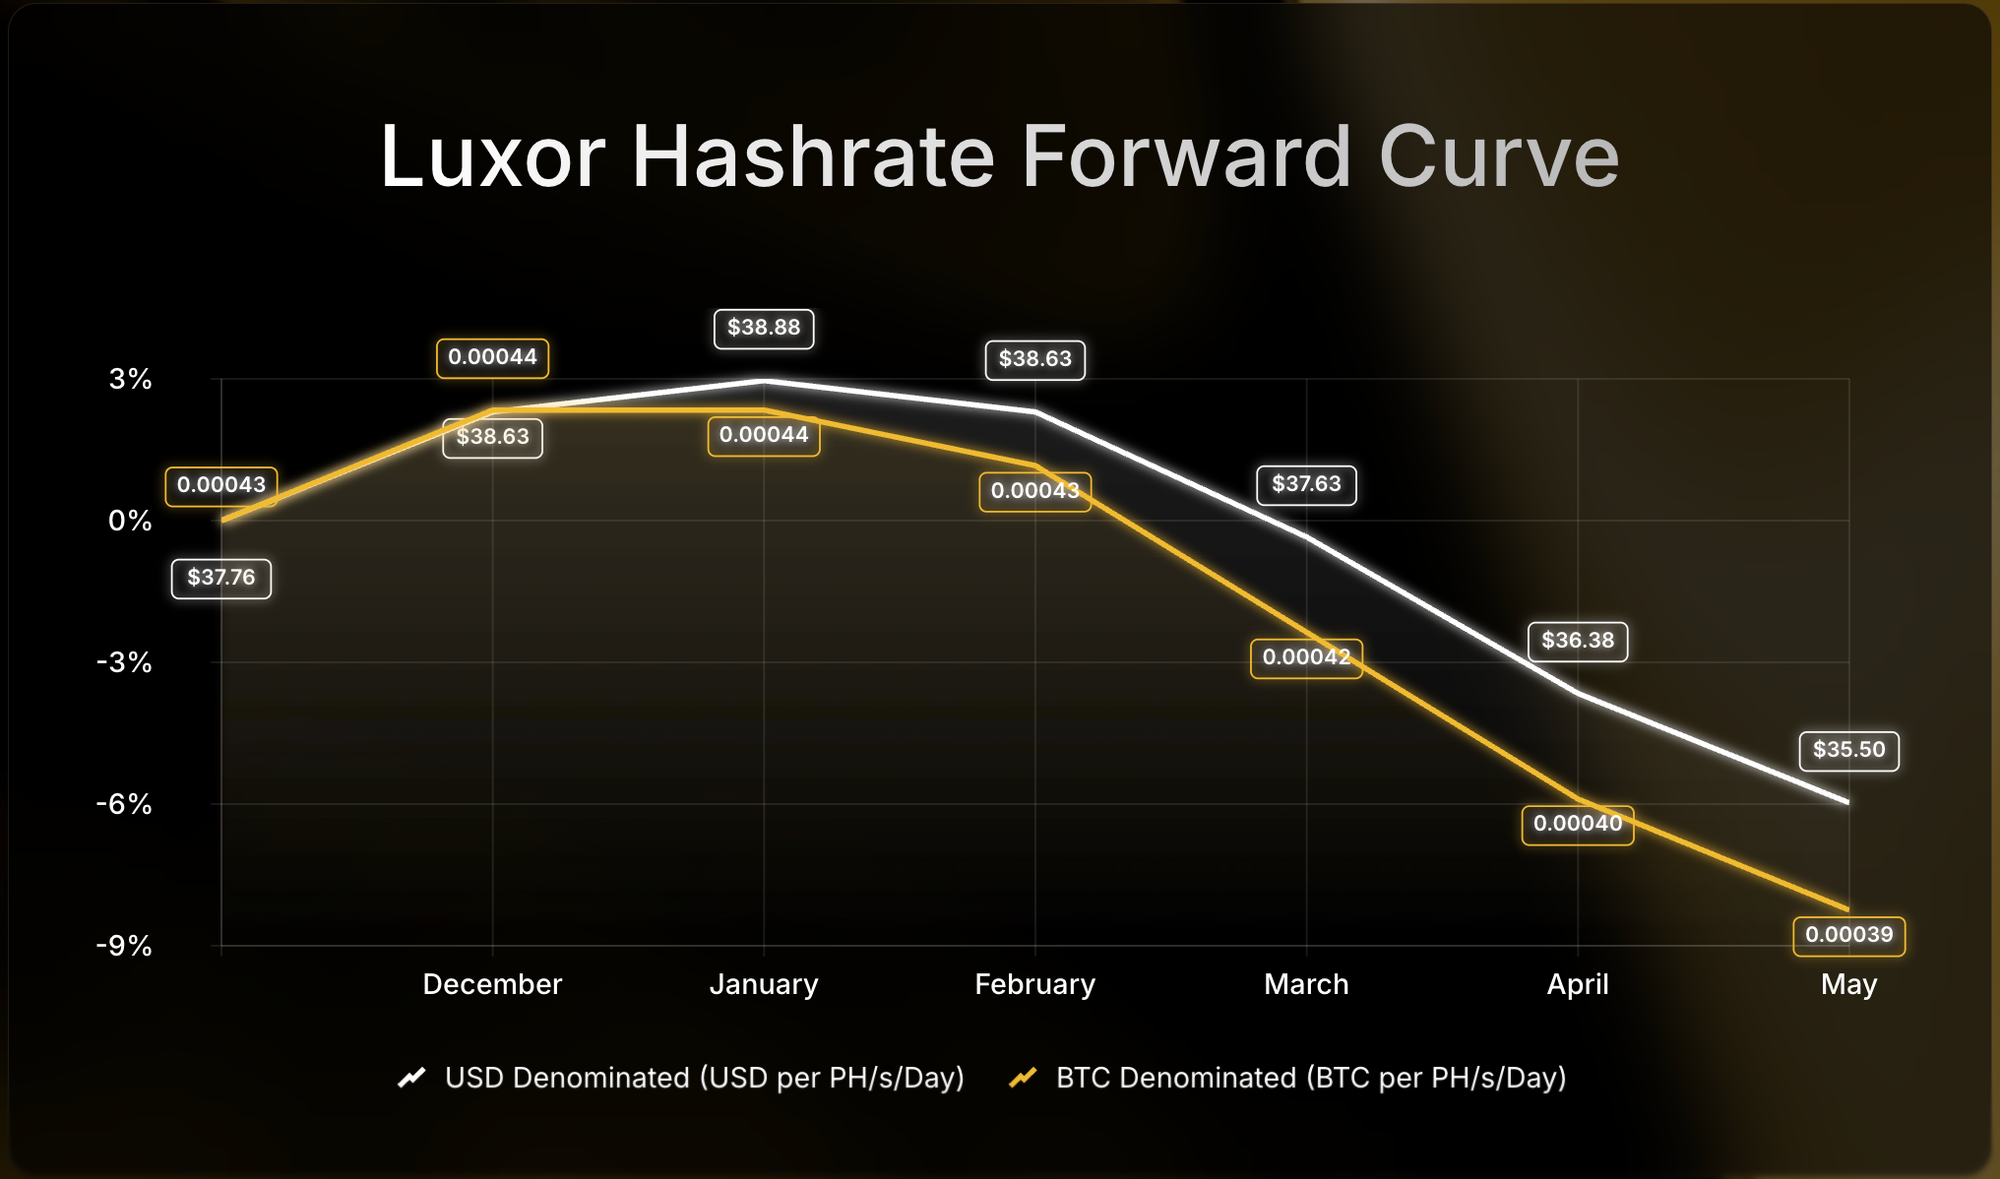
Between November 3 and December 1, USD-denominated forwards for Nov 2025 – Apr 2026 fell 16–18% alongside spot hashprice. BTC contracts moved in the opposite direction: all contracts across the curve rose, anywhere from 5–8%. This implies expectations of weak USD revenues, but more network relief (i.e., slower network difficulty growth). All contracts traded in backwardation, except the front month (Dec 2025) briefly traded in contango for BTC-denominated contracts.
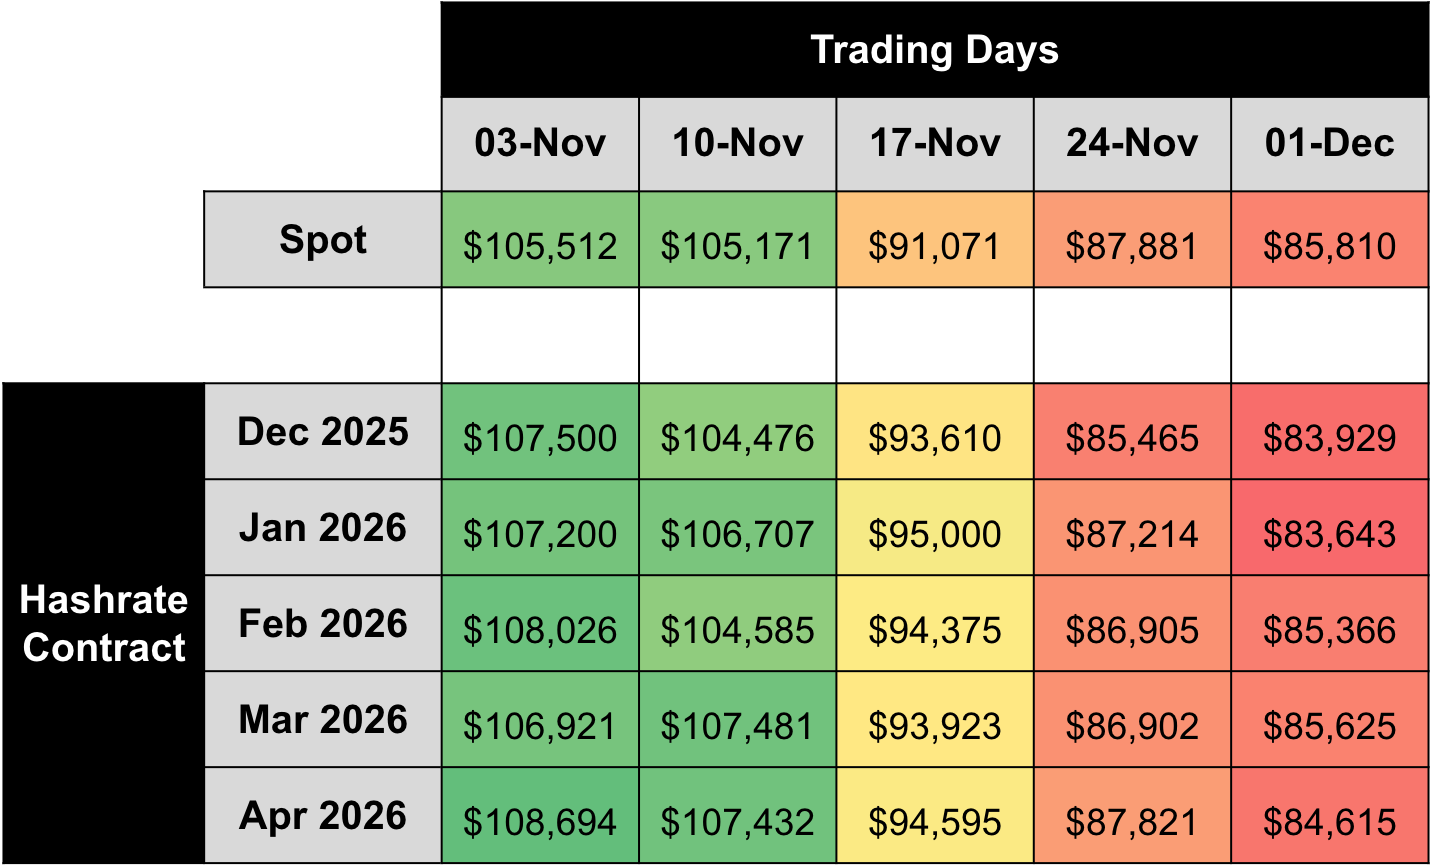
By dividing USD contract hashprice values with BTC contract hashprice values, we can back out implied bitcoin price expectations expressed by the forward hashrate market. Throughout November, implied bitcoin price expectations fell 20–22%, and flipped from trading in contango at the start of the month to backwardation over the rest of the period. This reflects an overall bearish sentiment for near-term price action in spot BTC markets.
If we make an assumption around transaction fees, we can also calculate changes in implied network difficulty and hashrate expectations expressed by the forward hashrate market. In the two tables below, we assume a 0.022 BTC per block transaction fee collection on November 3 and a 0.020 BTC per block on December 1, respectively:
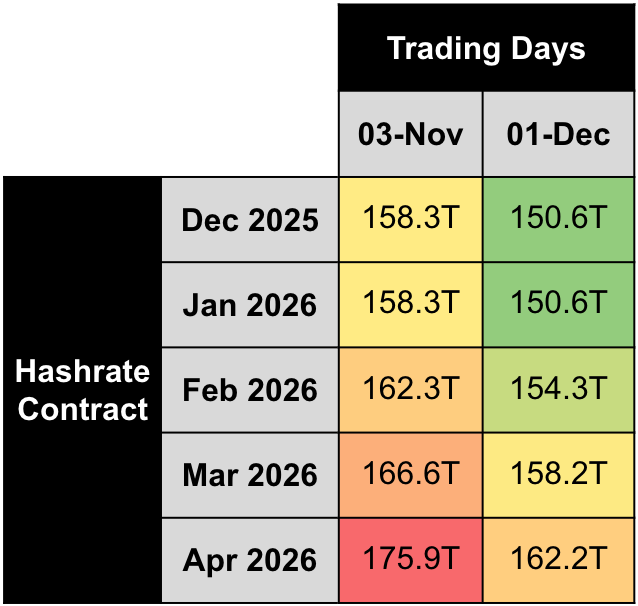
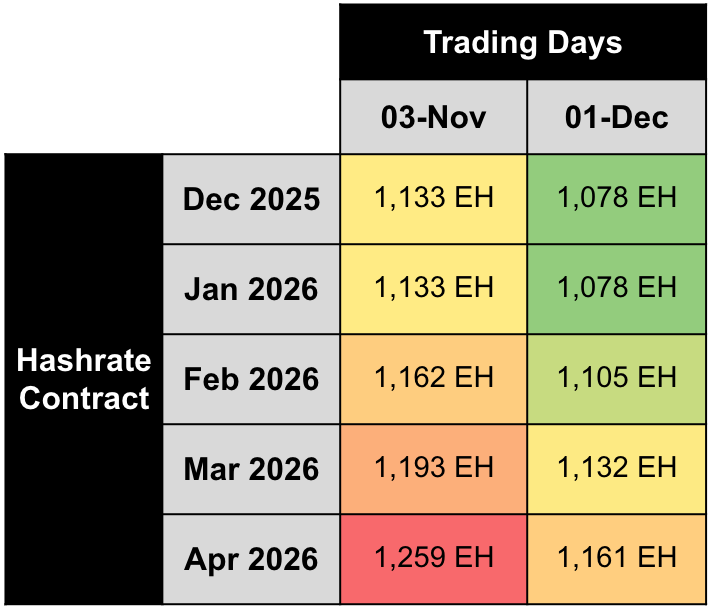
Note: figures assume 0.022 BTC per block transaction fee collection on November 3 and 0.020 BTC per block on December 1, 2025.
Based on this simple analysis, we estimate that future difficulty and hashrate expectations fell during the month of November, by ~5–8% for the Dec 2025 – Apr 2026 contracts.
Concluding Thoughts and Looking Ahead
Since November, Bitcoin has partially stabilized, bouncing back to ~$92,500. USD hashprice has moved up from ~$36 to ~$39 per PH/s/Day, though it remains near all-time lows. The next difficulty adjustment is estimated to occur on December 11, tracking toward a -1.95% decrease. As USD hashprice hovers around its historical bottom, utilizing the forward curve at this time becomes a strategic tool. The case for selling forward is straightforward: it protects mid-generation fleets from forced shutdowns and locks in current margins for new-generation fleets. The case for buying forward is equally clear: it enables miners to secure lower hashcosts from the forward curve, and traders to speculate on a hashprice rebound.
The forward hashrate market is signaling an expectation of slower hashrate growth in the months ahead. Seasonal volatility is also entering the frame: winter storm activity and power-price spikes (already visible in the United States) will shape fleet uptime over the coming weeks.
Looking forward, Luxor’s Hashrate Forward Market is pricing in an average hashprice of $35.93 or 0.00042 BTC per PH/s/Day over the next six months. Sellers can currently secure this hashprice while buyers have the opportunity to lock in the same hashcost through April 2026.
If you’d like to learn more about Luxor’s Bitcoin mining derivatives, please reach out to [email protected] or visit https://www.luxor.tech/derivatives.
About Luxor Technology Corporation
Luxor delivers hardware, software, and financial services that power the global compute and energy industry. Its product suite spans Bitcoin Mining Pools, ASIC Firmware, Hardware trading, Hashrate Derivatives, Energy services, and a bitcoin mining data platform, Hashrate Index.
Disclaimer
This content is for informational purposes only, you should not construe any such information or other material as legal, investment, financial, or other advice. Nothing contained in our content constitutes a solicitation, recommendation, endorsement, or offer by Luxor or any of Luxor’s employees to buy or sell any derivatives or other financial instruments in this or in any other jurisdiction in which such solicitation or offer would be unlawful under the derivatives laws of such jurisdiction.
There are risks associated with trading derivatives. Trading in derivatives involves risk of loss, loss of principal is possible.


Hashrate Index Newsletter
Join the newsletter to receive the latest updates in your inbox.


