
Luxor Hashrate Lookback Series – March 2026
March 2026’s hashrate and hashprice trends, forward market participation, trading activity and contract performance.
Luxor’s Monthly Lookback Series is a deep dive into Bitcoin hashrate market activity. In this post, we cover March 2026’s hashrate market and hashprice trends, forward market participation, trading activity and contract performance.
Summary
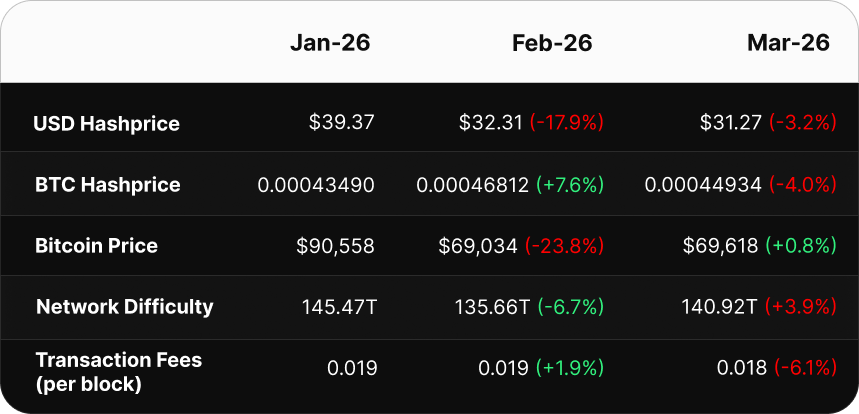
- Another All-Time Low in Hashprice: Monthly average USD hashprice fell 3.2% to $31.27 per PH/s/day, a new record low, even as BTC price held nearly flat month-over-month (+0.8%).
- A Top 10 Difficulty Drop: The March 5–20 epoch ranks as the 10th largest difficulty decrease in the modern ASIC era (since 2016). Block times normalized within days of the adjustment, signalling curtailment, not capitulation. The cause remains an open question.
- Fiat Fork Continues: USD-denominated forward sellers captured $31.63–$43.53 per PH/s/day versus spot settlement at $31.27. Fixed payouts earned more across the board, with the 5-month hedge delivering a 39% premium. BTC-denominated buyers outperformed across nearly all intervals as the unexpected difficulty drop pushed BTC hashprice above every forward lock-in rate.
- Forward Curves Repriced Higher: Apr–Aug 2026 USD contracts rose ~3–4% and BTC contracts rose ~7–11% through March, as the difficulty drop led markets to revise near-term future hashrate expectations downward by ~9% on average.
March 2026 Spot Hashprice & Its Constituents
USD Hashprice — A New Monthly Low
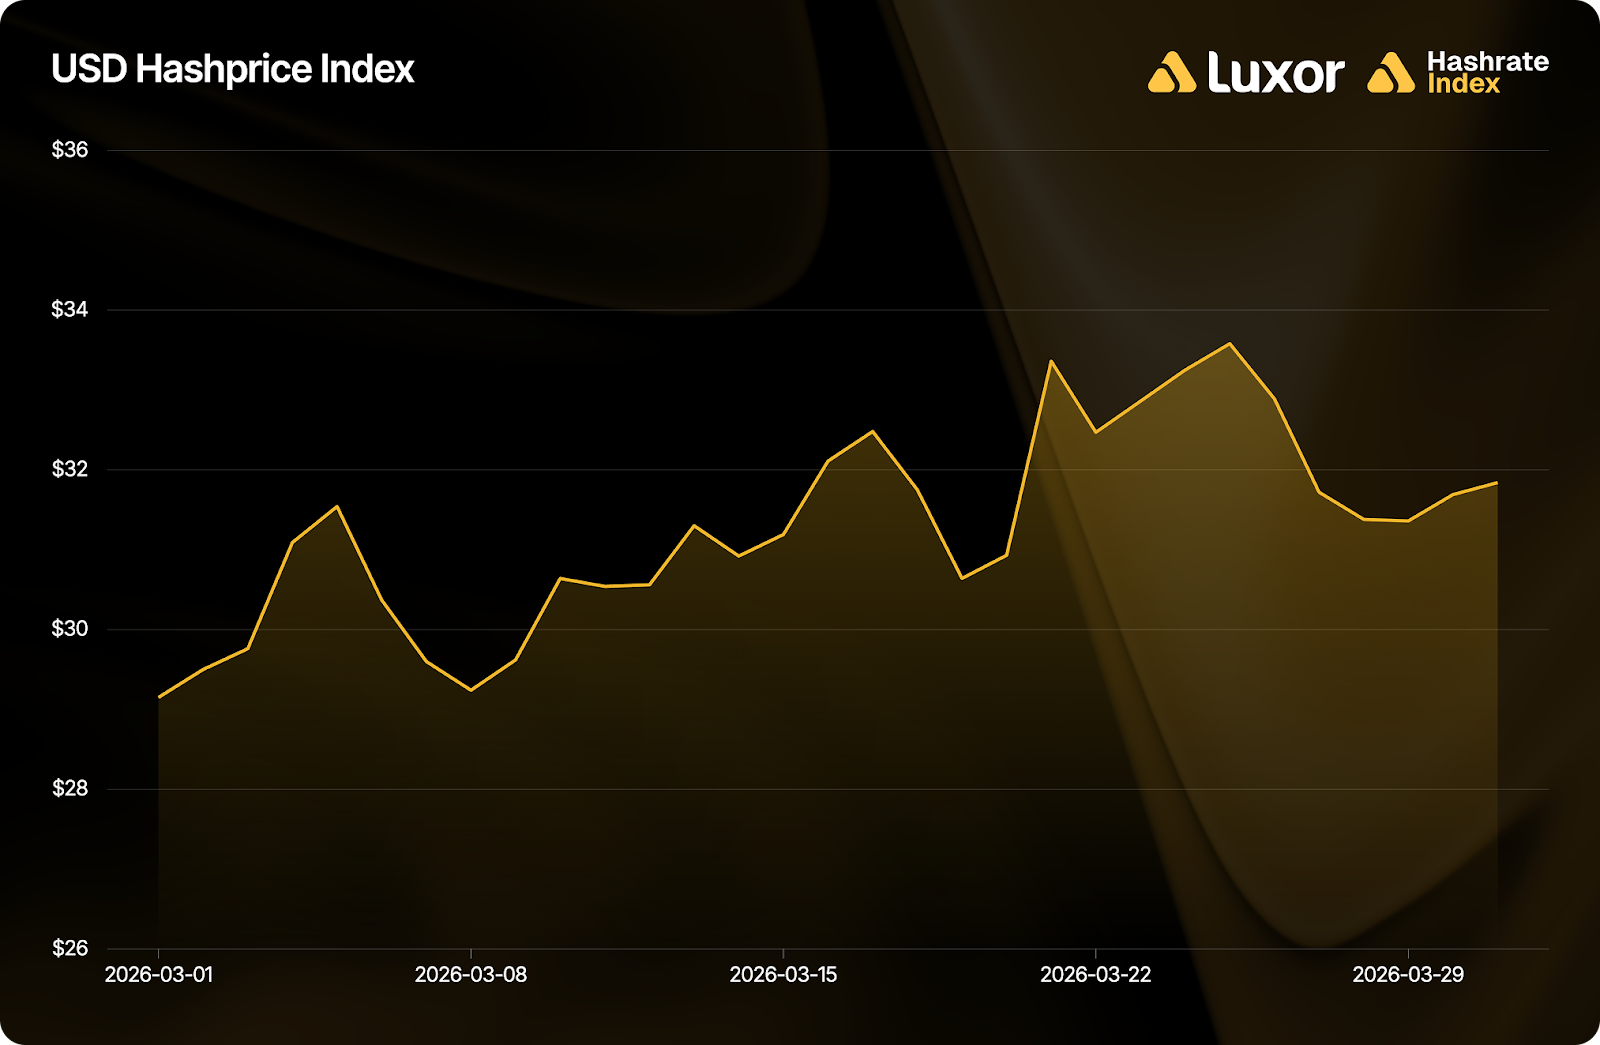
Following February, March 2026 marked another all-time low monthly average USD hashprice.
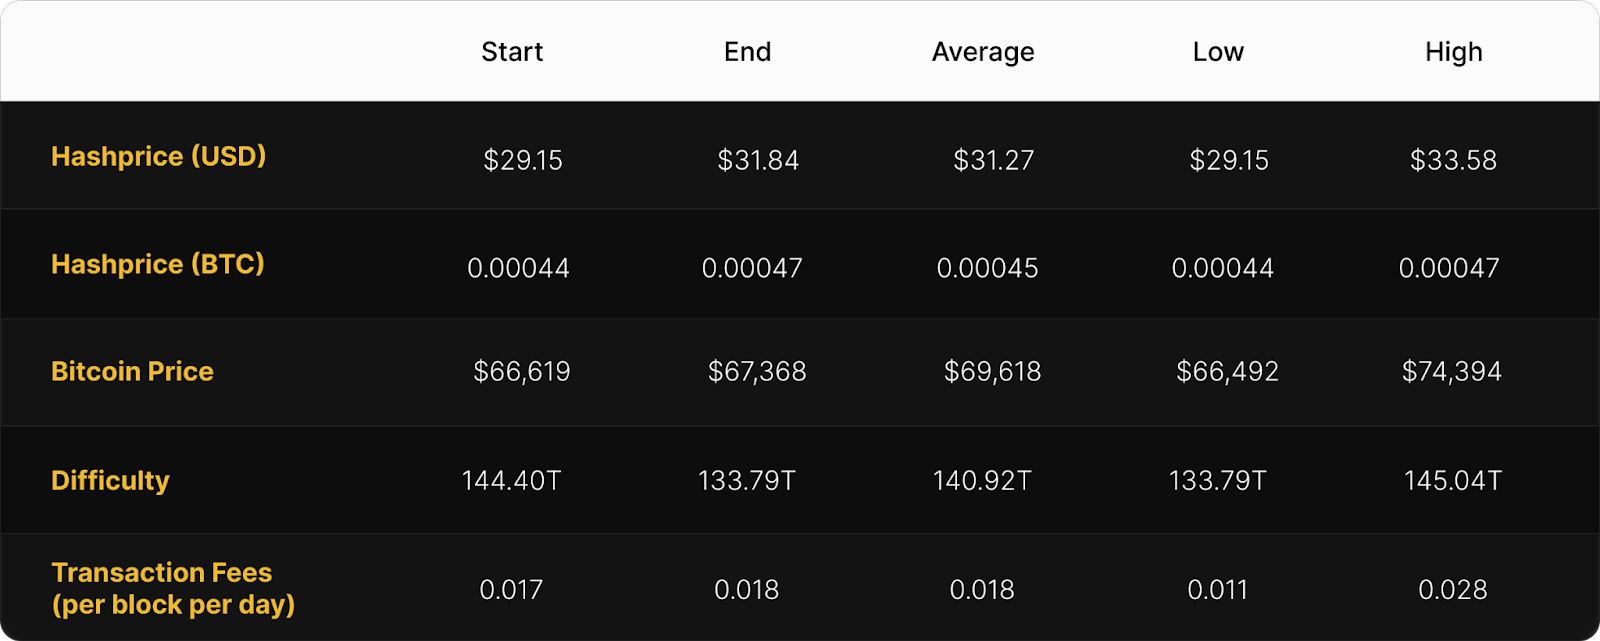
Monthly average USD hashprice fell 3.2% from $32.31 to $31.27 per PH/s/day, as BTC price held nearly flat month-over-month (+0.8%). USD hashprice opened the month at $29.15 and recovered steadily, driven by BTC price strength and a -7.76% difficulty adjustment during the second half of the period. It closed March at $31.84.
BTC Price — Flat, With Spikes
BTC opened March at $66,619, recovered modestly to close at $67,368, and averaged $69,618 for the month — roughly flat versus February's $69,034 average.
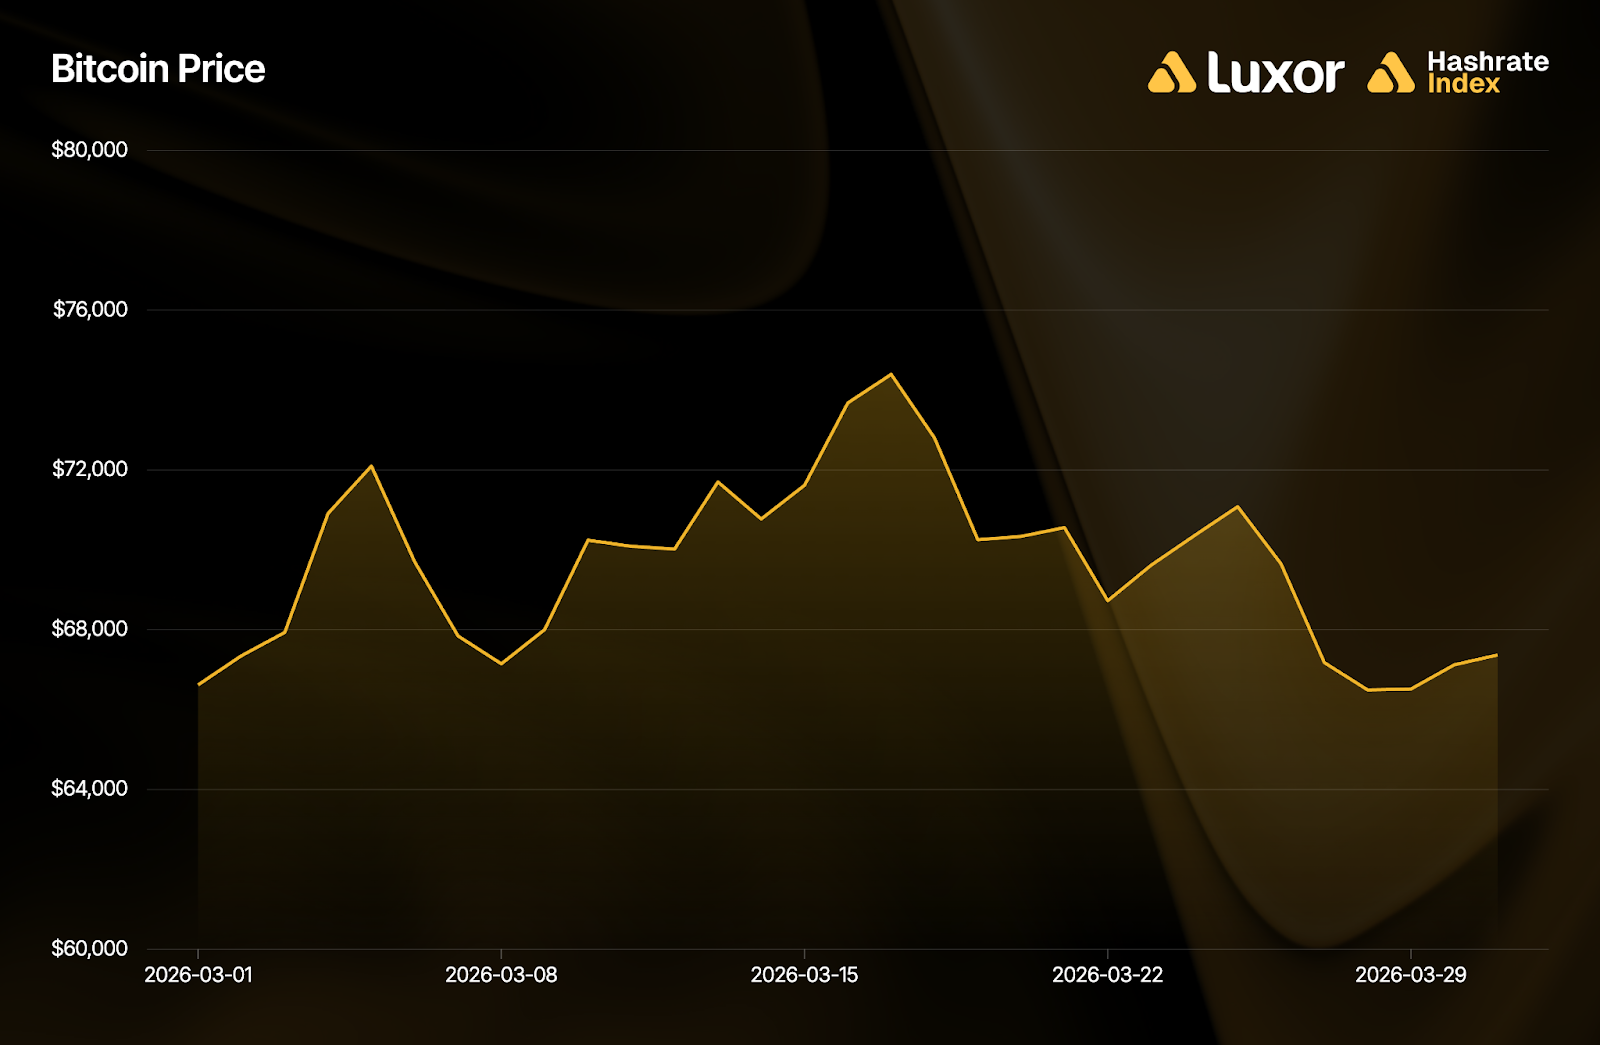
The flat monthly average masks intra-month volatility. BTC price spiked on March 4, 10, and 16. The drivers of these rallies, whether driven by macro correlation with broader risk assets during the Iran War or by Bitcoin-specific factors, warrant a closer look.
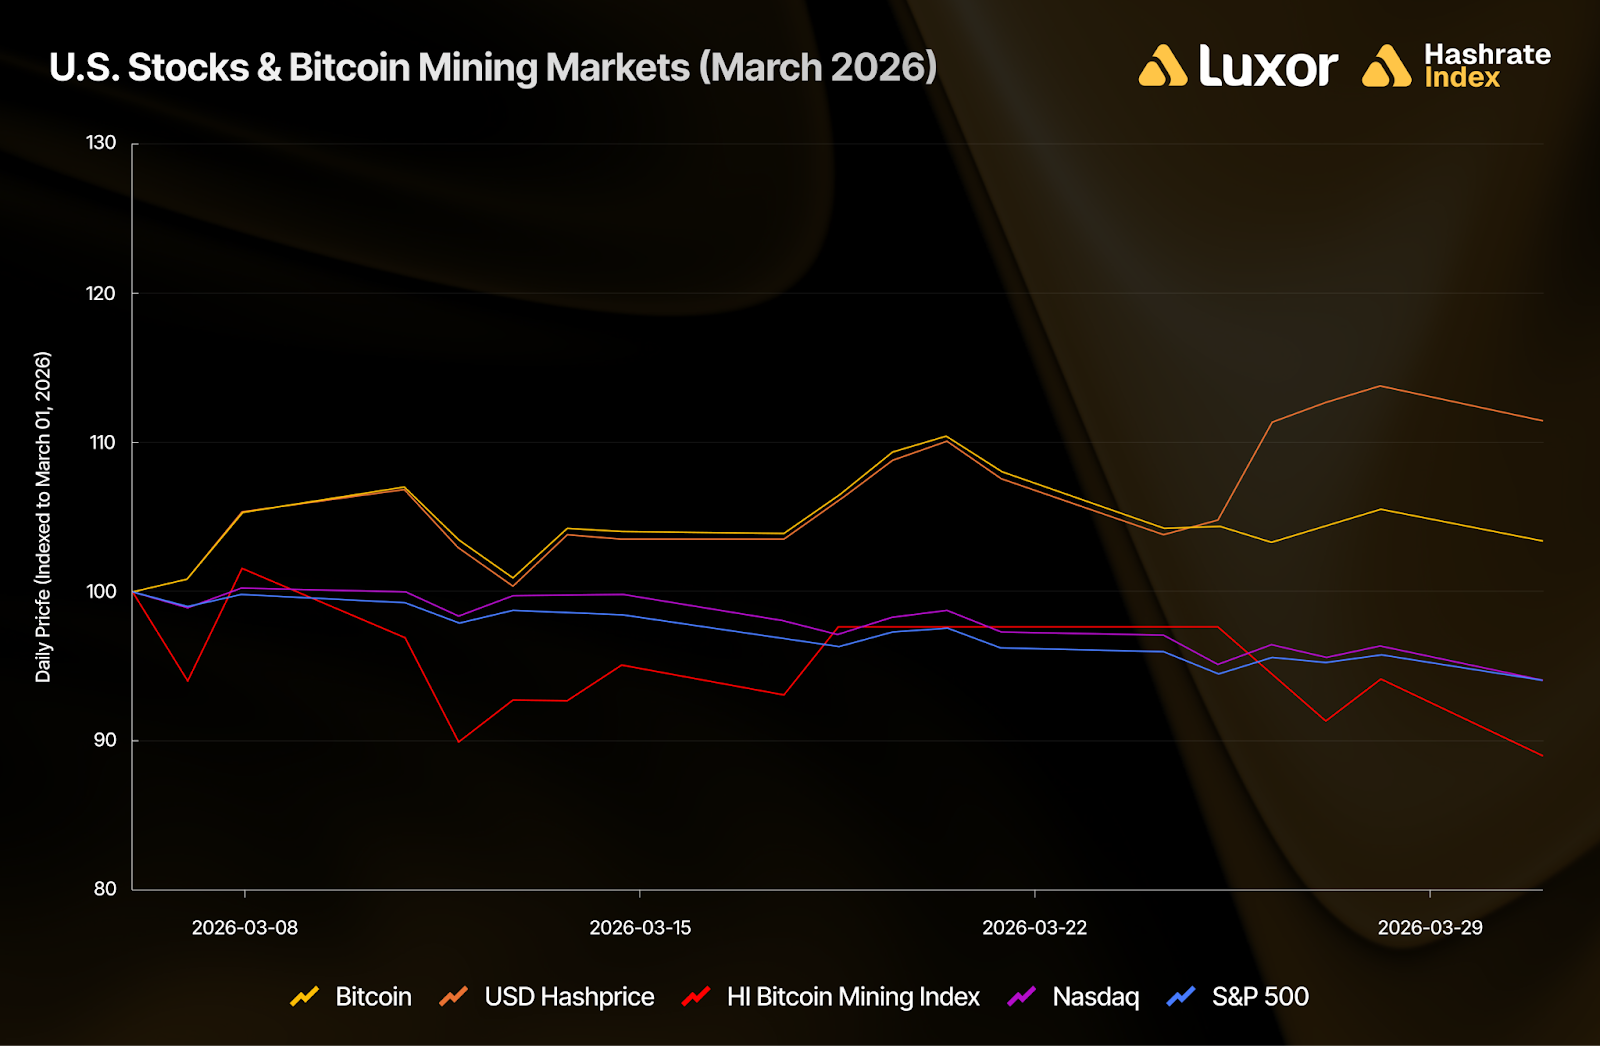
Global equity markets were under pressure in March as tensions escalated following U.S. strikes on Iran. The S&P 500 and Nasdaq both declined on the geopolitical shock, finishing the month down 5.1% each from their March 2 opens. Bitcoin's behavior during this episode is instructive. BTC's upside spike days didn't track equity moves — on March 4 and 16, BTC rallied +4.4% and +2.9% while the S&P was roughly flat. The downside was more correlated: when equities posted their sharpest sessions on March 26–27 (S&P -1.7% both days, Nasdaq -2.4%), BTC fell in tandem. In other words, BTC found its own reasons to go up, but didn't escape macro pressure on the way down. This suggests BTC behaved with partial independence, absorbing some macro fear, but also responding to its own demand dynamics.
On the Bitcoin-specific side, two potential drivers stand out. First, progress on the Clarity Act (a U.S. market structure bill for digital assets) may have contributed to the mid-month spike: on March 10, senators publicly announced they were working on a stablecoin yield compromise to advance the bill, lifting crypto sentiment broadly in the days that followed. Second, the March 4 spike (+4.4%) showed characteristics of a short squeeze: crowded short positions built up during the Iran War selloff cleared rapidly as BTC swept prior range lows, coinciding with ~$1.7 billion in spot ETF inflows that had accumulated since late February (the first sustained inflow streak in months).
The drawdown context from February remains relevant. BTC is still ~45% off its ~$126,000 October 2025 cycle peak, and where it stands in the cycle today is unresolved.
Network Difficulty — A Sharp Drop and an Open Question
March saw two difficulty adjustments. The first was unremarkable, but the second turned out to be one of the top 10 largest single-epoch drops in Bitcoin's modern ASIC era.
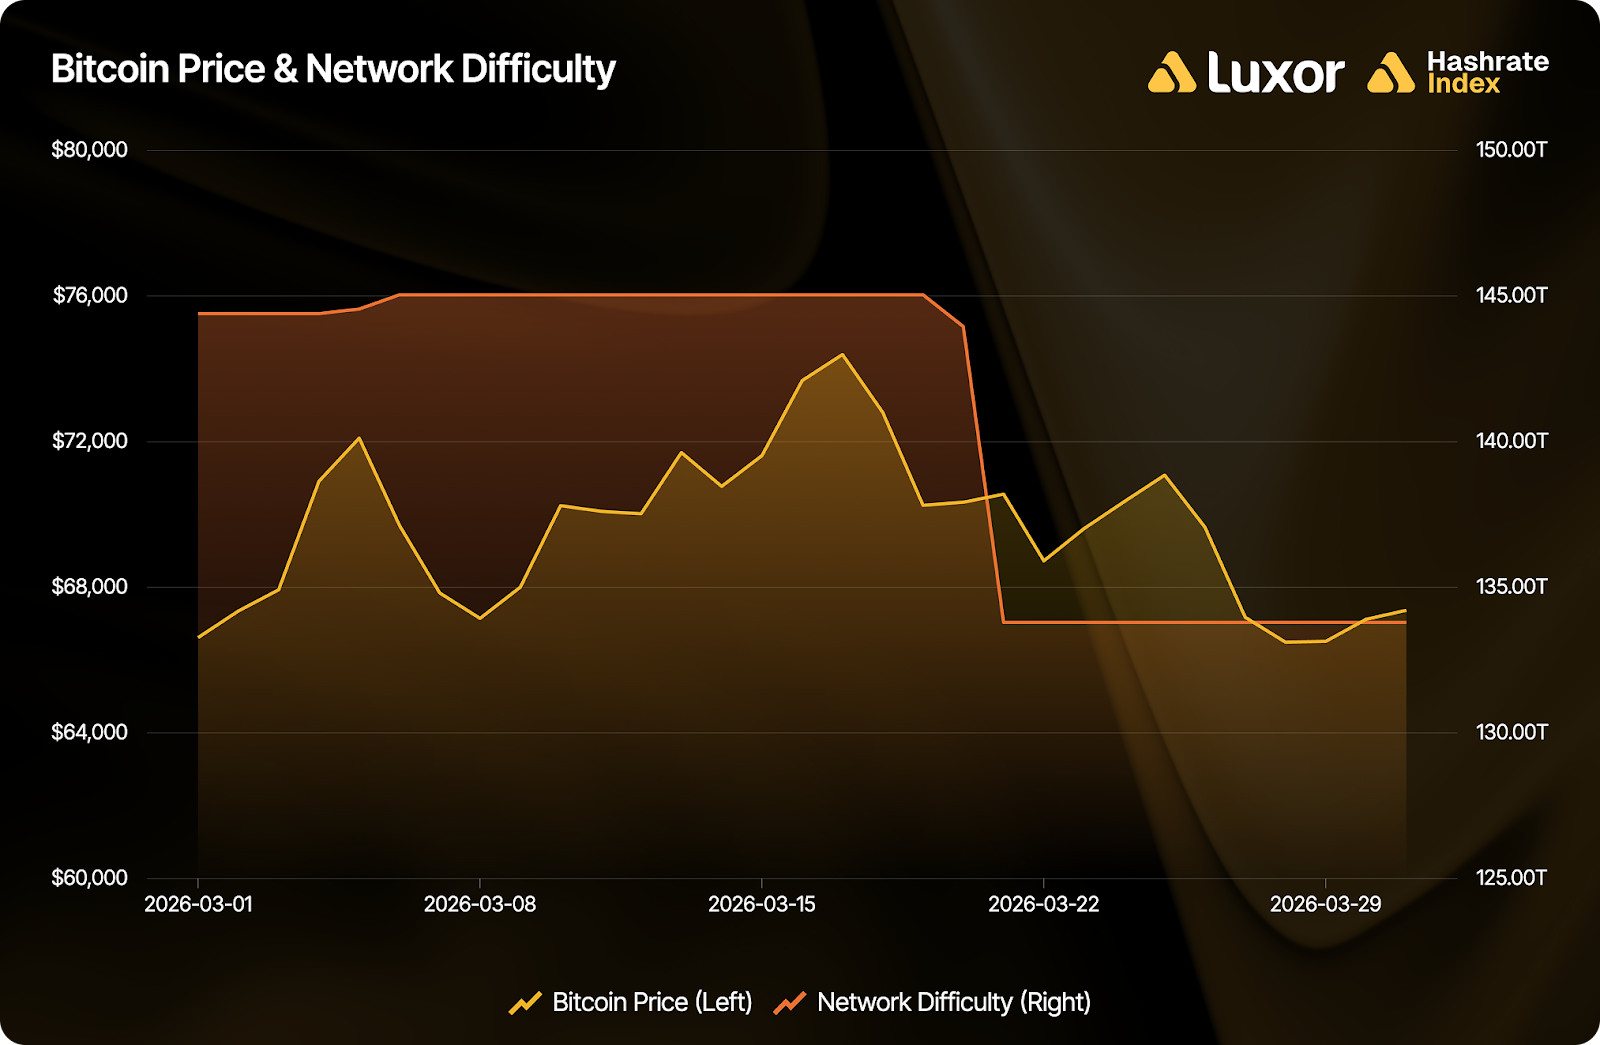
The first was an upward adjustment on March 5: +0.45% from 144.40T (1,034 EH/s) to 145.04T (1,038 EH/s) as blocks ran slightly ahead of the network’s 10-minute target. The second was a downward adjustment on March 20: -7.76% from 145.04T (1,038 EH/s) to 133.79T (958 EH/s) .
A -7.76% single-epoch drop ranks as the 10th-largest difficulty decrease in the modern ASIC era, which we define as the period since 2016 when steady-state ASIC competition replaced the GPU and FPGA transition years. In this timeframe alone (273 adjustments since 2016), only 9 were more severe. For immediate comparison: February 2026's -11.16% adjustment ranked 7th. These two events together make Q1 2026 the most turbulent difficulty period since the 2021 China ban.
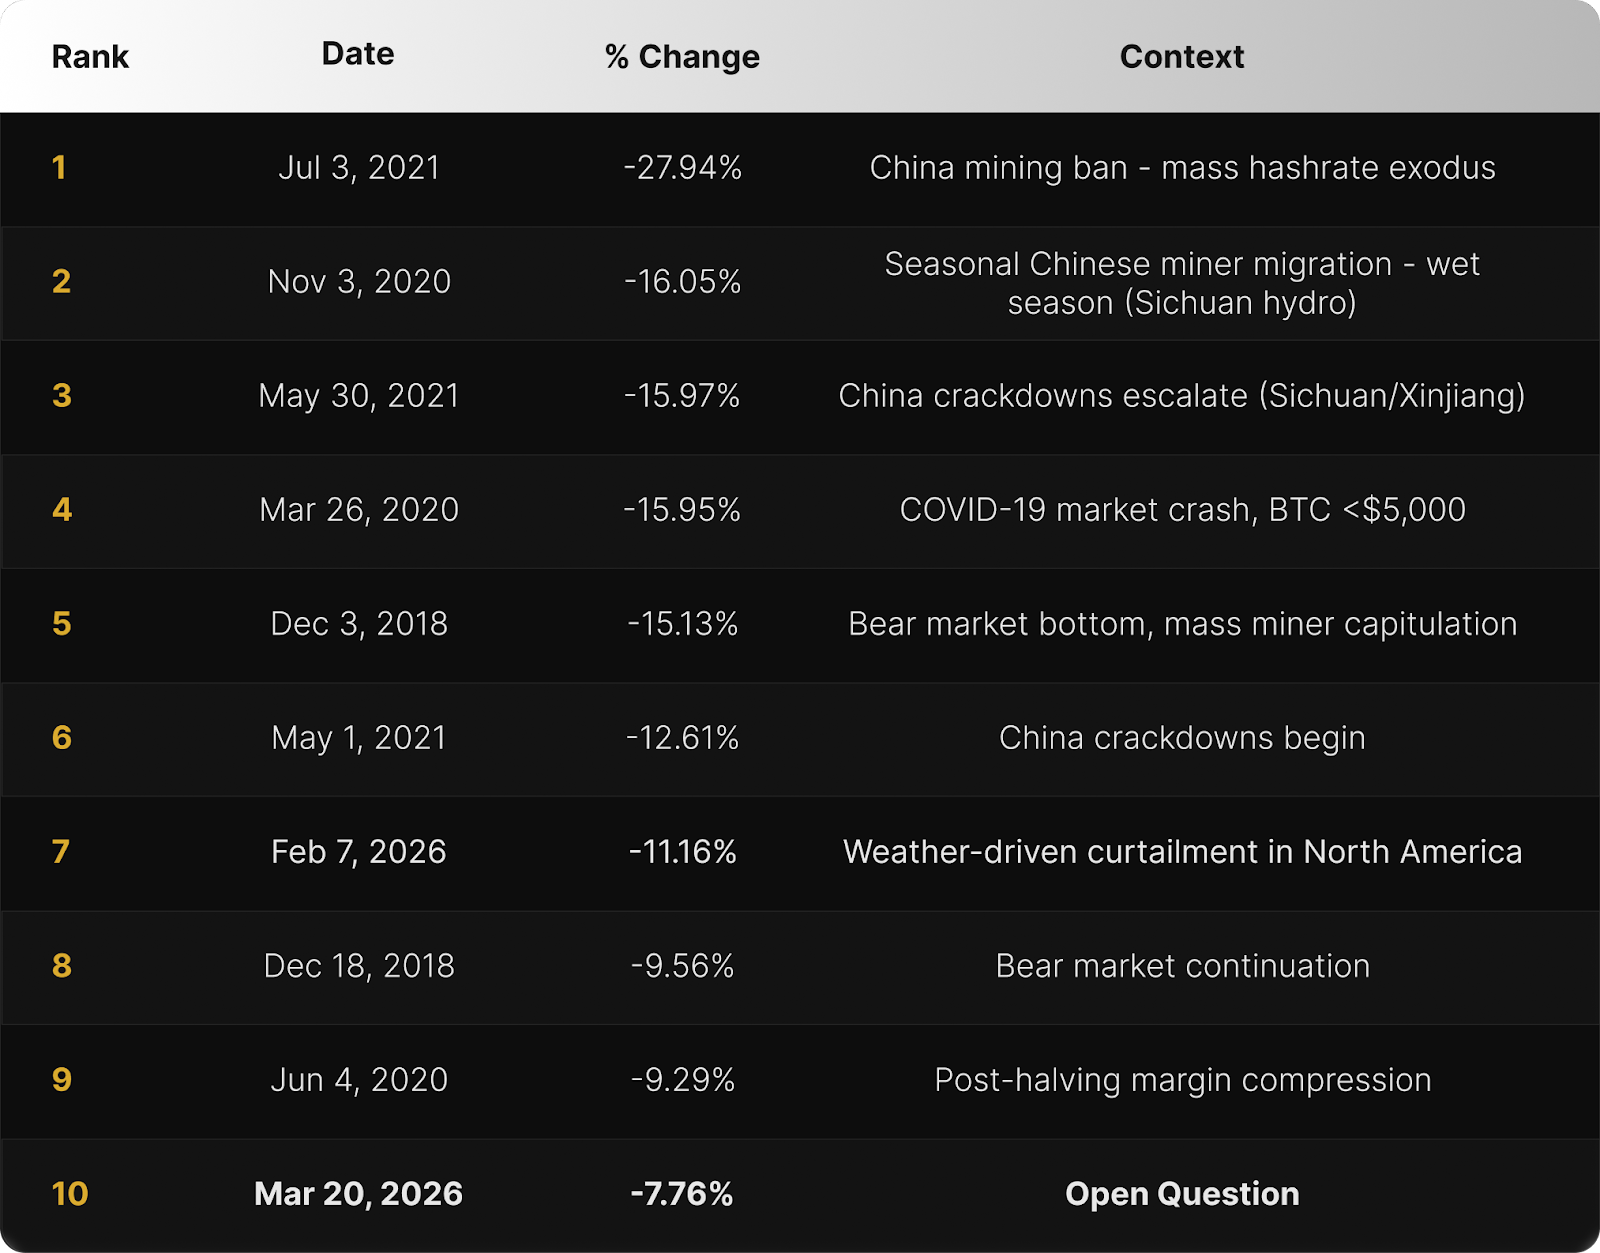
Note: We exclude the 2013–2015 period from this ranking because it captures the structural transition from GPU and FPGA mining to ASICs — extreme adjustments from that era are not analogous to the steady-state ASIC improvement era since 2016.
What caused it is an open question. The leading candidates: Iran War-related disruptions to regional mining operations, the war driving up natural gas prices in Europe and Asia and squeezing grid-exposed miners, sustained low hashprice forcing marginal capacity offline, statistical block timing luck, or some combination. We can eliminate a few of these with reasonable confidence and narrow the field on others.
Oil prices are likely not the primary culprit. As we analyzed in Oil Shocks and the Bitcoin Network, the direct link between crude prices and mining costs is weak for roughly 90% of global hashrate — the US, Canada, Russia, China, and most hydro-dependent jurisdictions run on grids where electricity pricing has little to do with crude. The genuinely oil-exposed cohort, primarily Gulf state miners in the UAE, Oman, and Iran, accounts for an estimated 8–10% of global hashrate. A surge in crude from $60 to above $100 would stress that slice directly, but it cannot explain a -7.76% network-wide adjustment on its own. However, these countries are directly exposed to physical war interruptions.
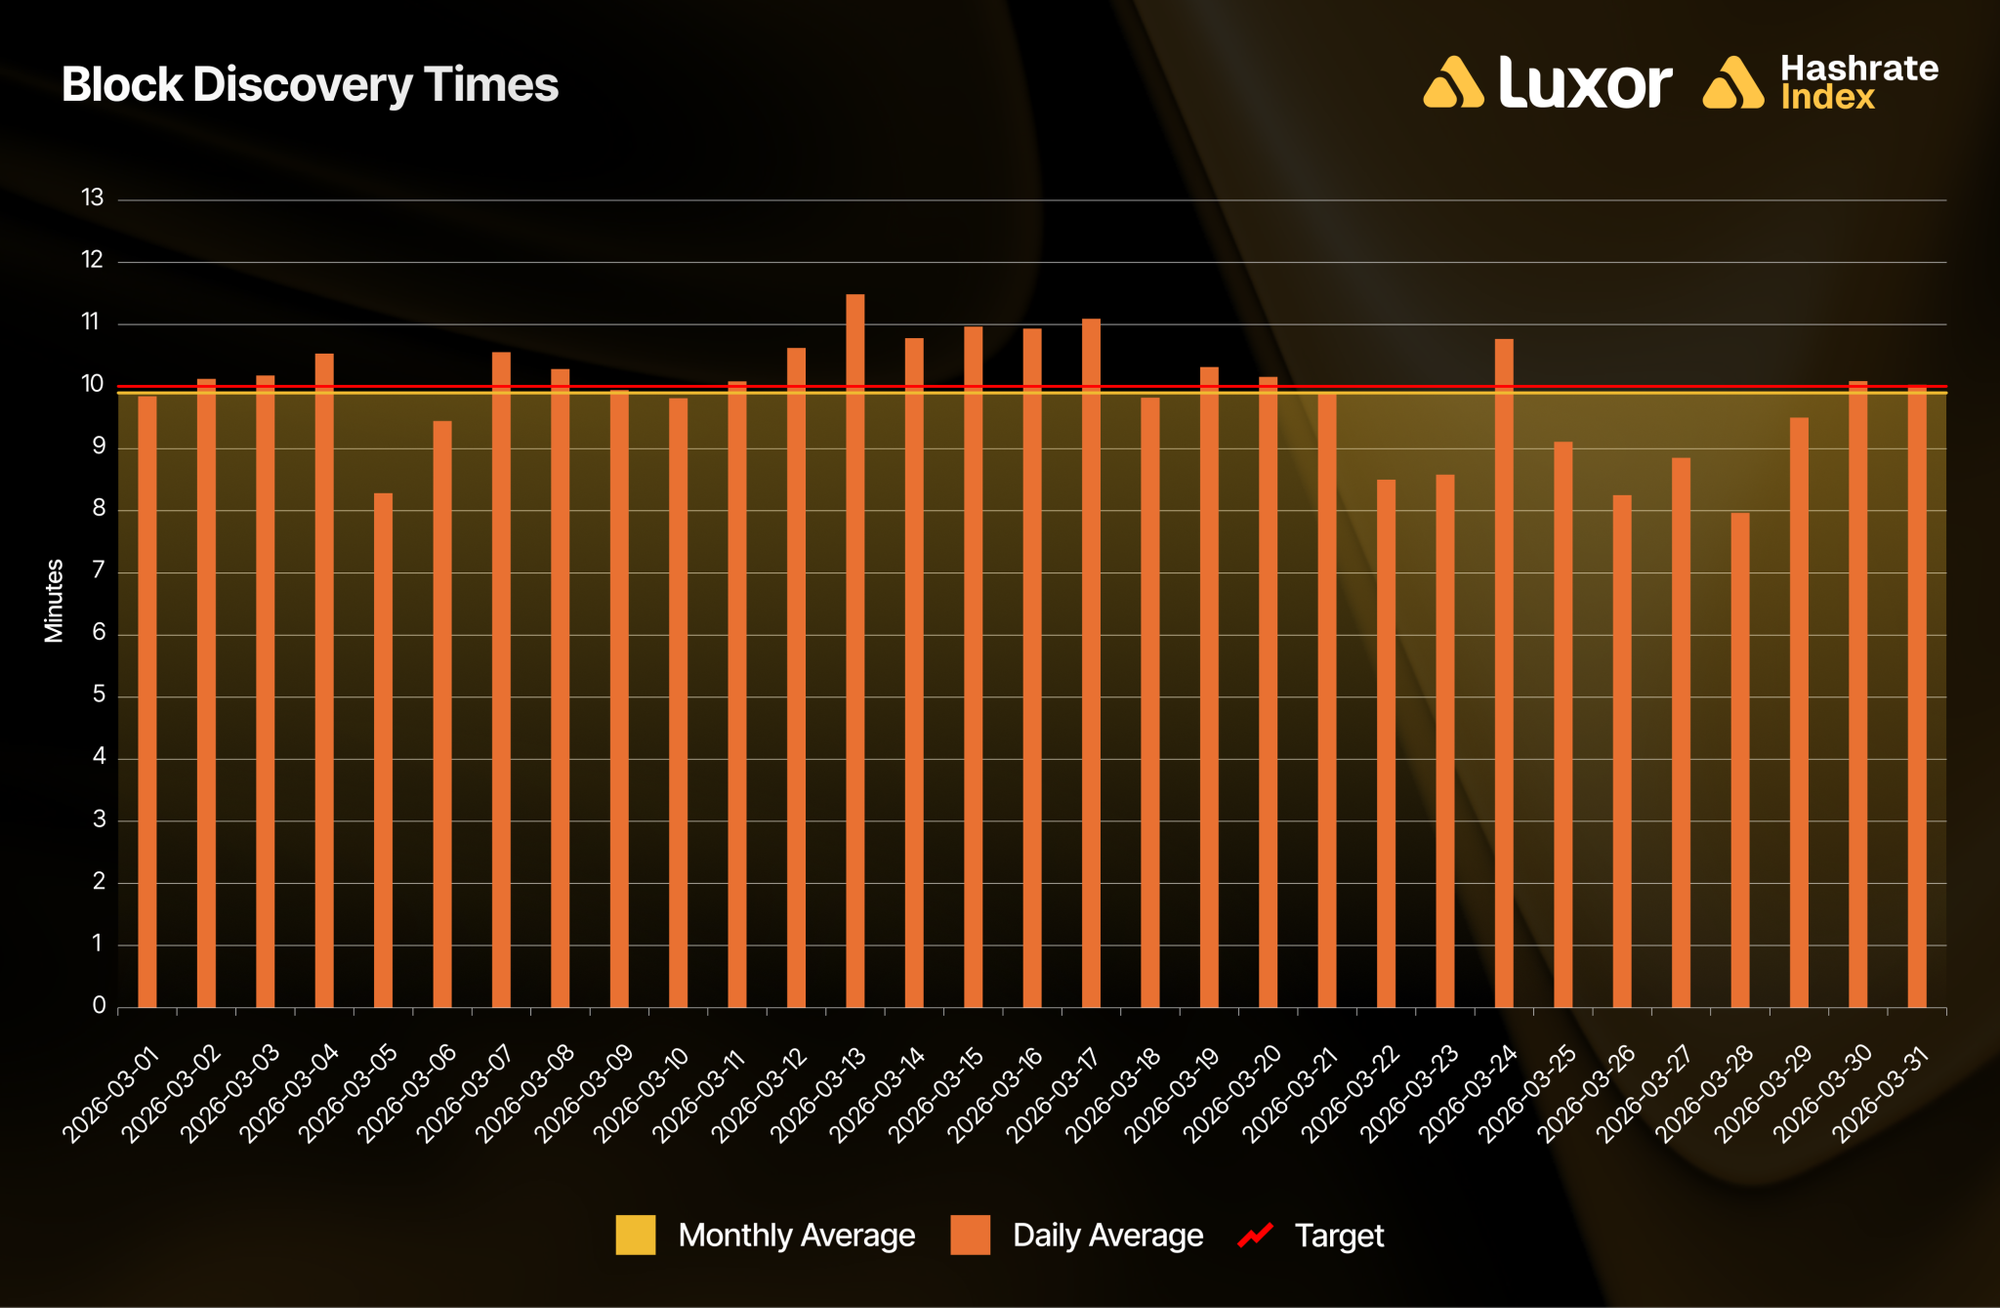
Statistical luck is similarly insufficient. A -7.76% adjustment means 2,016 consecutive blocks (the March 5 – March 20 epoch) ran persistently behind schedule, with 11 of 15 days averaging above the 10-minute target and the worst stretch (March 12–17) clocking 10.98 minutes per block. That's not random variance averaging out. Something structurally reduced network hashrate across that timeframe.
The most telling data is what happened after March 20: block times reverted to target within days of the adjustment landing, but came in fast through the remainder of the period. The post-adjustment average (March 21–31) was 9.23 minutes per block, a full minute below target. March 22–23 came in at 8.50 and 8.58 minutes, and the March 25–28 window averaged 8.55 minutes per block, with March 28 alone at 7.97 minutes.
The speed and magnitude of the overshoot points to a specific mechanism. The mechanical effect of a lower difficulty target explains an immediate decrease in block discovery times, but not a sustained 15–25% differential for the rest of the month. That requires additional hashrate. The -7.76% drop lifted USD hashprice ~8% overnight, which pushed marginal machines (previously uneconomic at all-time low hashprice) back above breakeven. Curtailed capacity came back online within ~48 hours. Miners facing a regulatory ban or permanent power disruption don't come back in days. Marginal miners sitting offline due to uneconomic hashprice do. The March 20 adjustment has hallmarks of a curtailment event rather than capitulation.
Pool-level data supports the curtailment thesis. Based on our estimates derived from on-chain block discovery, ViaBTC saw the largest swing: dropping from ~102 EH/s (January average) to ~72.5 EH/s during March 8–15, then snapping back to ~103 EH/s the week the adjustment landed — a near-complete recovery in seven days. AntPool followed a similar pattern, falling ~7 EH/s during the March 5–20 epoch and rebounding +20 EH/s post-adjustment. That speed of recovery is inconsistent with permanent infrastructure loss and consistent with marginal miners toggling back on once the difficulty drop lifted hashprice ~8%. However, one complication is that neither ViaBTC nor AntPool have fully returned to pre-war levels. ViaBTC currently sits at ~93 EH/s, roughly 9 EH/s below its January baseline; AntPool at ~146 EH/s, about 11 EH/s below. This residual gap is roughly consistent with Iran's estimated ~7 EH/s loss, but pool hashrate estimates are noisy enough to avoid attributing the shortfall to any single cause.
The most probable explanation, consistent with the timing and the rapid recovery, is a combination of geographically concentrated disruption coinciding with the Iran War escalation in the second week of March, and marginal hashrate moves during hashprice all-time lows.
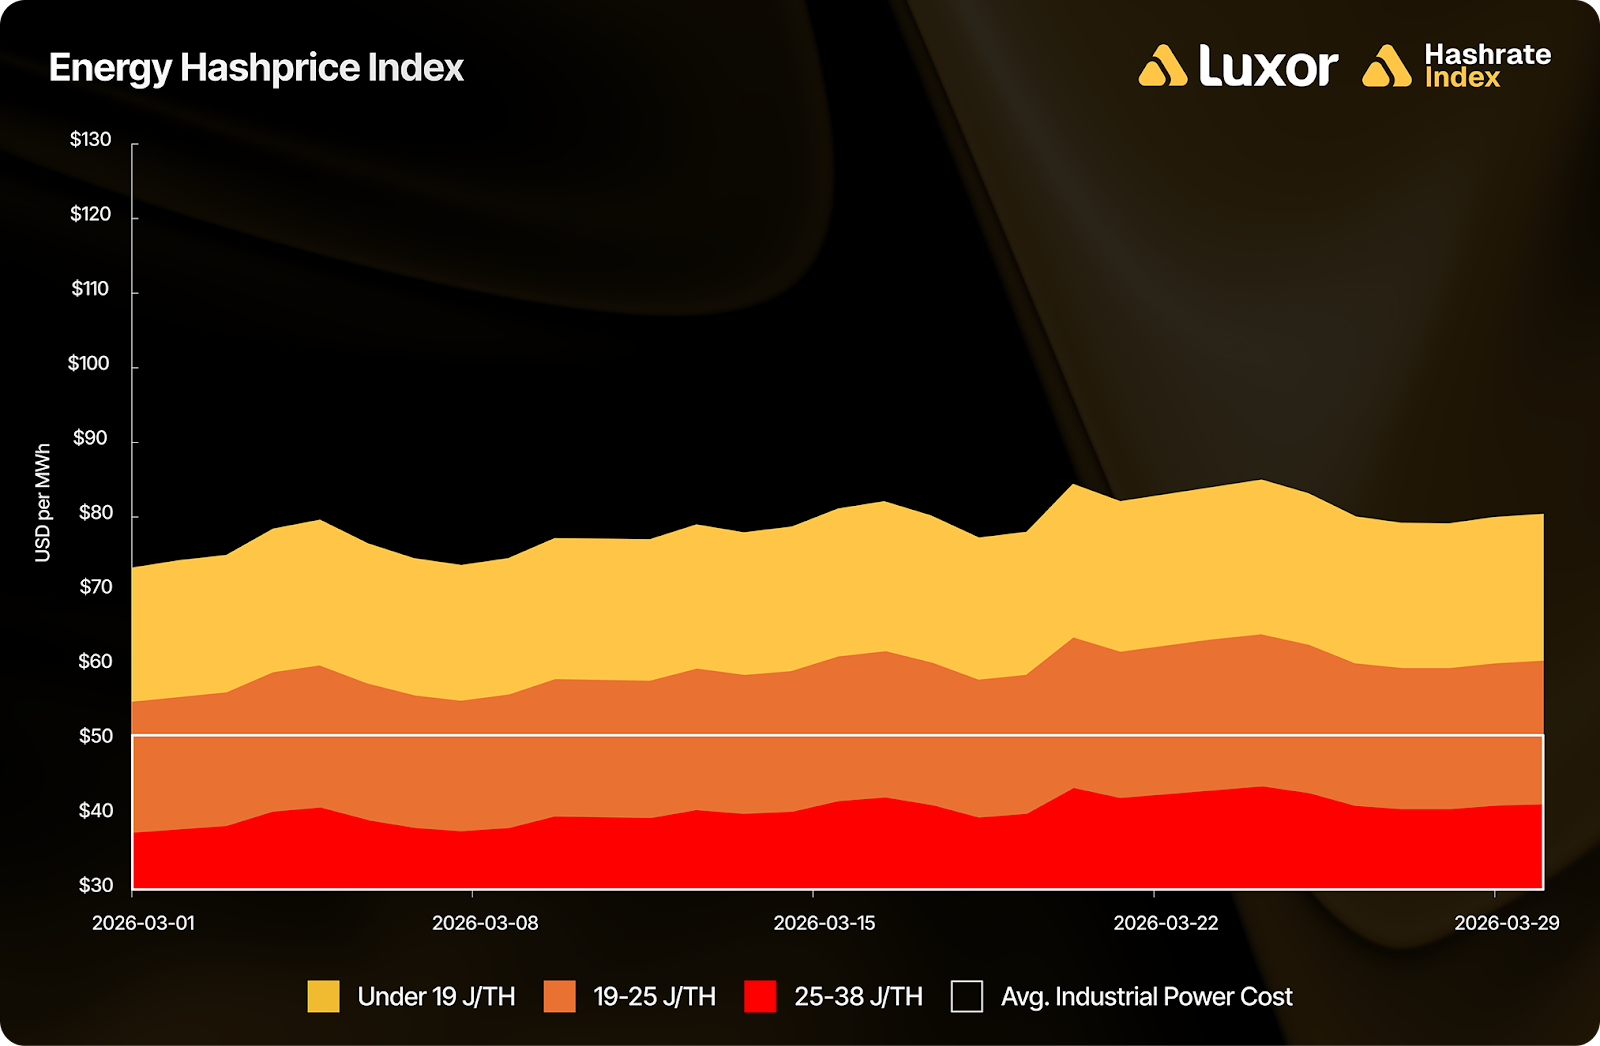
The low-hashprice environment continues to pressure less efficient machines. In March, implied mining revenue per unit of electricity consumed was approximately $77/MWh for fleets running under 19 J/TH, $59/MWh for 19–25 J/TH fleets, and $41/MWh for 25–38 J/TH fleets. At an estimated network-average power cost of $50/MWh, S19-era and equivalent machines remained at or below the margin all month.
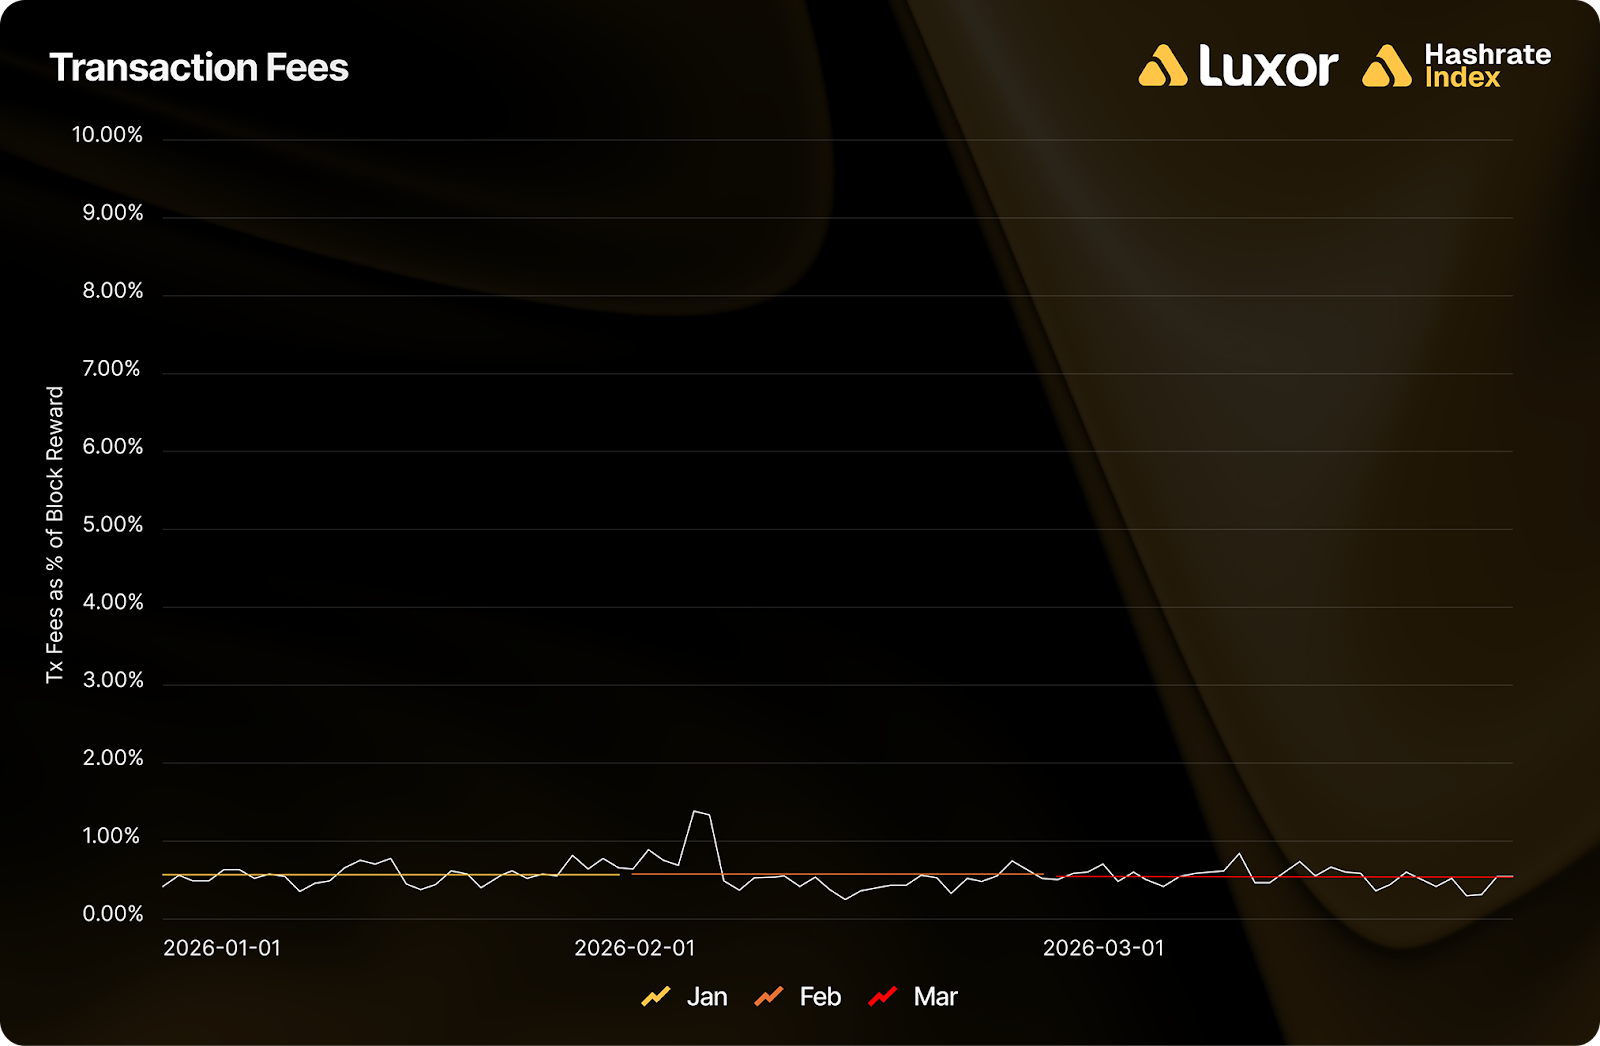
Transaction Fees — Another Quiet Month
Average fee collection fell 3.6% to 0.0183 BTC per block in March, continuing a subdued fee environment that has persisted since September 2025. In USD terms, fee revenue per block was approximately $1,279. Fees accounted for approximately 0.58% of total block rewards.
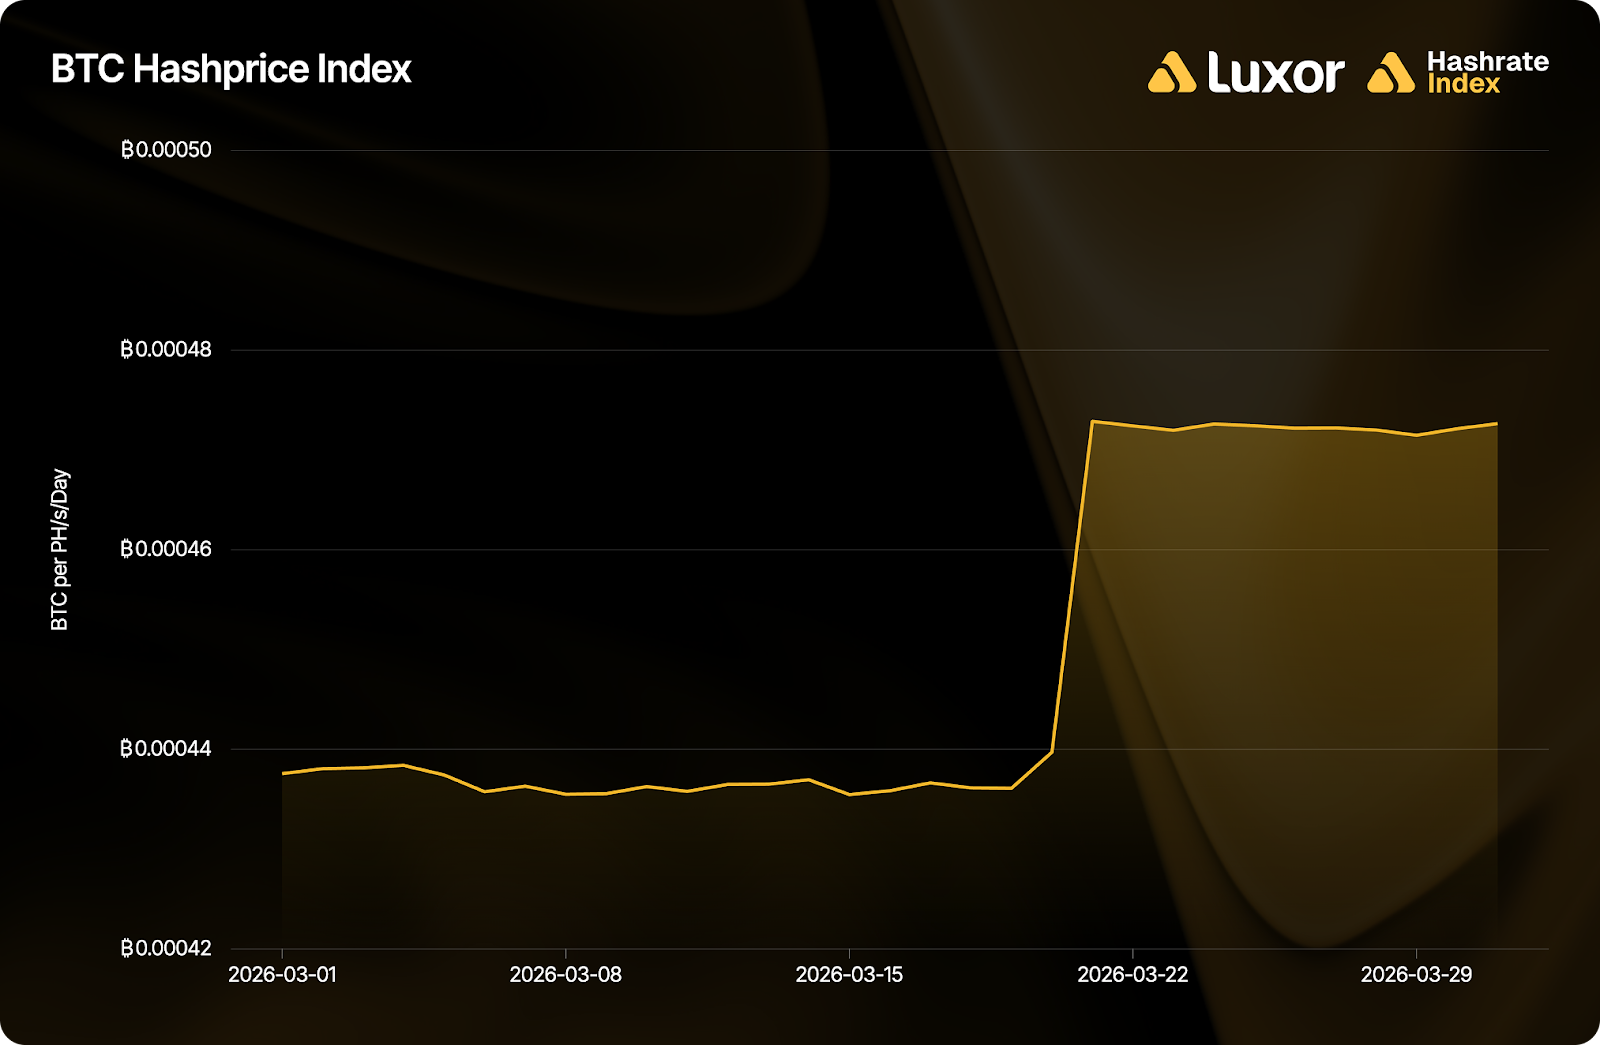
BTC Hashprice — Up During The Month, But Down Month over Month
BTC hashprice moved inversely with difficulty, as expected. It opened at 0.00044 BTC per PH/s/day and closed at 0.00047, rising 8.0% intra-month as the -7.76% difficulty adjustment hit on March 20.
Monthly average BTC hashprice fell 4.0% from 0.00046812 BTC to 0.00044934 BTC per PH/s/day, a modest decline driven by March’s first-half difficulty epoch that preceded the big drop.
March 2026 Hashrate Market Activity
Our analysis of the March 2026 hashrate market focuses on two key points: how the March 2026 hashrate contract traded in previous months and how the forward curve shifted in March, based on pricing for forward hashrate during the month.
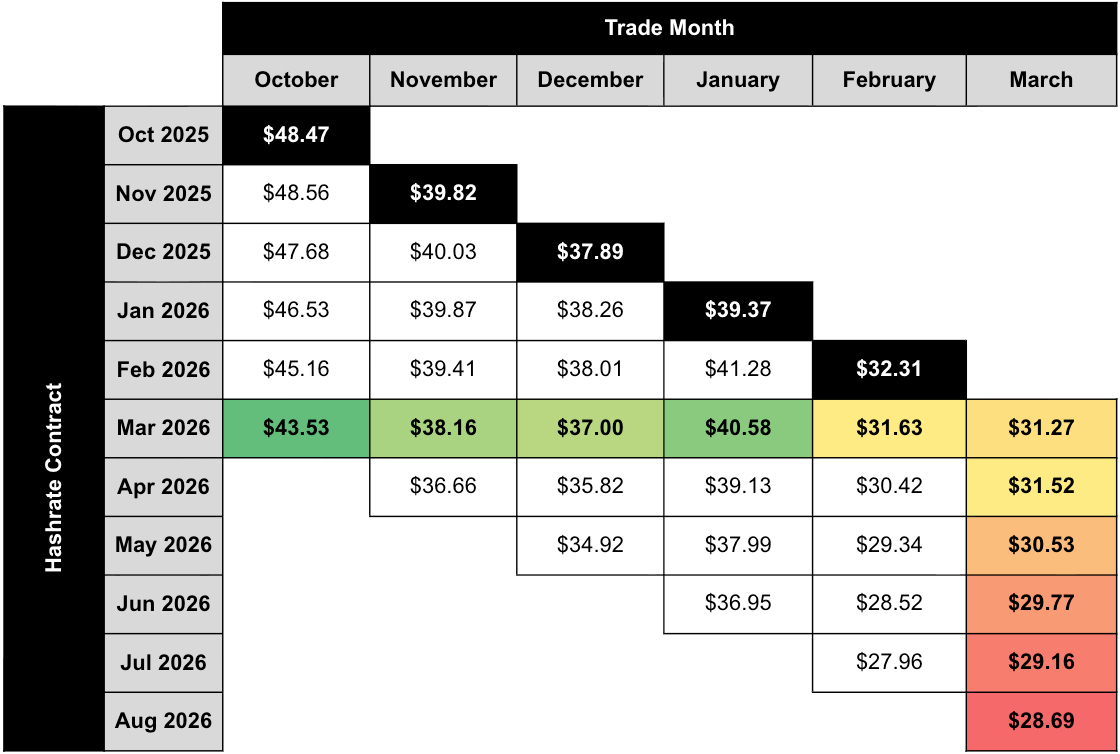
The two tables below show the evolution of Luxor’s USD and BTC-denominated hashrate forward markets from October 2025–March 2026. Rows represent specific monthly contracts, while columns represent each trading month. Cell values indicate the average monthly mid-market hashprice — except for the bold highlighted main diagonal — which shows actual spot hashprice settlement in each month.
This table summarizes both the trading history of the March 2026 USD-denominated contract (colored row) and the forward curve in March (colored column).
This table summarizes both the trading history of the March 2026 BTC-denominated contract (colored row) and the forward curve in March (colored column).
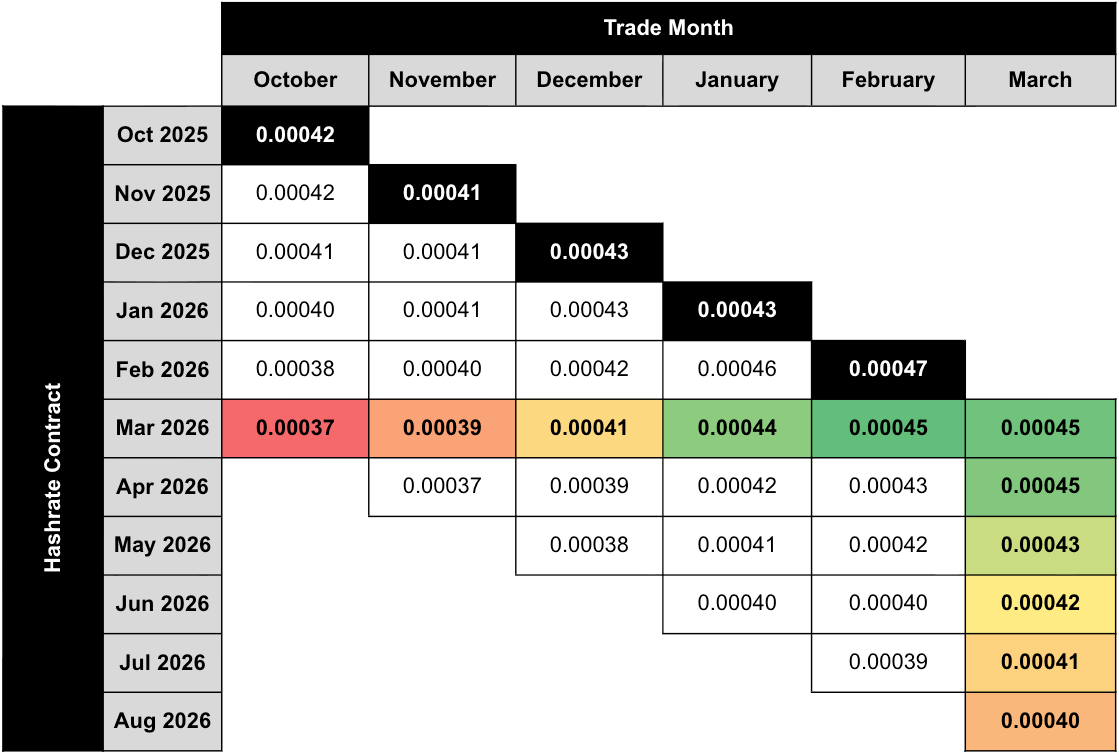
Note: all values (except for the bold highlighted main diagonal) shown in figures represent mid-market rates, the midpoint of the best bid and ask on Luxor's Non-Deliverable Hashrate Forward market. The bold highlighted main diagonal shows actual spot hashprice settlement in each month, measured by Luxor’s Bitcoin Hashprice Index.
The table below shows the type of market participants on the buy and sell side of Luxor’s deliverable (DF) and non-deliverable hashrate forward (NDF) market. In March, lenders were active on the buy side of the DF market, while public and private miners used the contract to sell forward, receive financing, and expand their fleet.
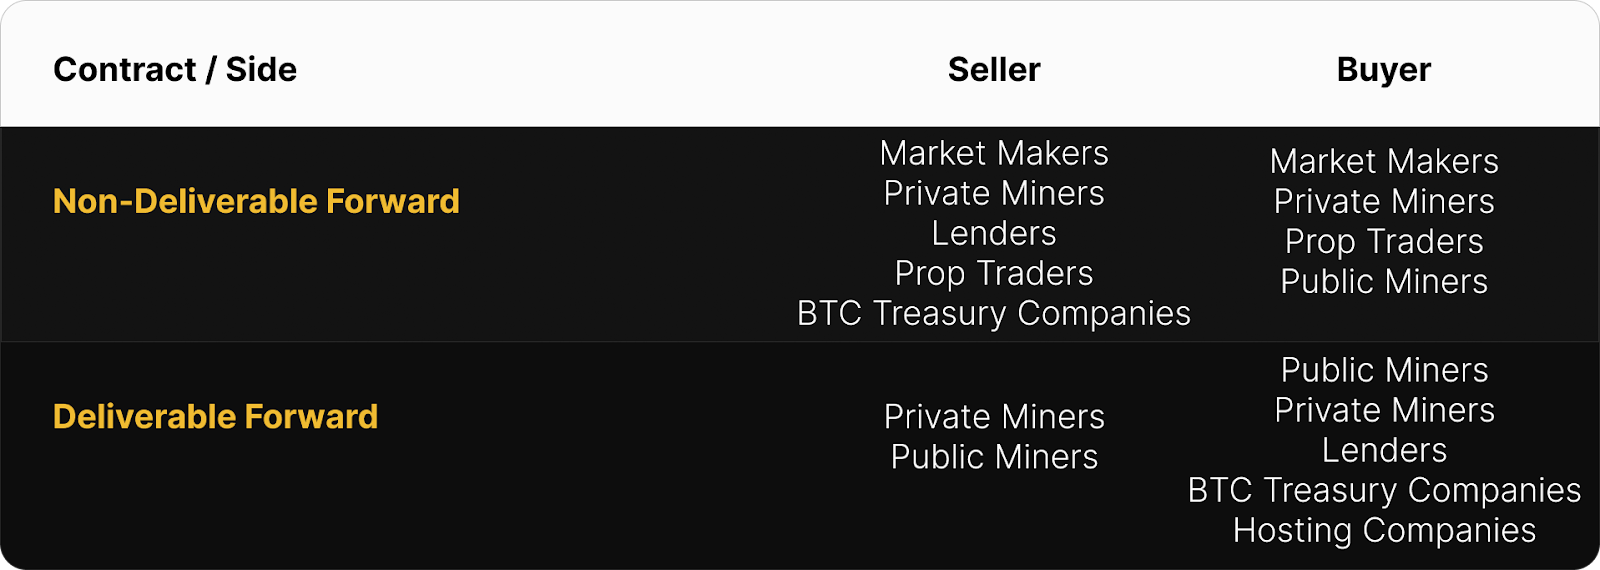
Since the DF involves upfront payment, it tends to trade at a discount to the NDF, compensating the buyer for the inherent credit risk. We interpret the discount of DFs relative to NDFs as the interest rate in hashrate-based lending markets. Buyers and sellers of the DF with upfront payment can use the NDF to lock-in a fixed yield (cost of capital) instead of having exposure to hashprice uncertainty.
This strategy was used by lenders and Bitcoin treasury companies (buy DF & sell NDF) to earn a BTC-denominated return and by miners (sell DF & buy NDF) to obtain non-dilutive financing. In March 2026, that yield (cost of capital) was 6–13% annualized.
How March 2026 Hashrate Traded
March’s hashrate hedging outcomes were similar to February’s “fiat fork”: sellers won in USD-denominated contracts across all intervals, whereas buyers won in BTC-denominated contracts. The trend was driven by BTC price continuing to compress USD hashprice beyond what forward markets had priced in, while BTC hashprice settled higher than expected as the -7.76% difficulty drop was a surprise.
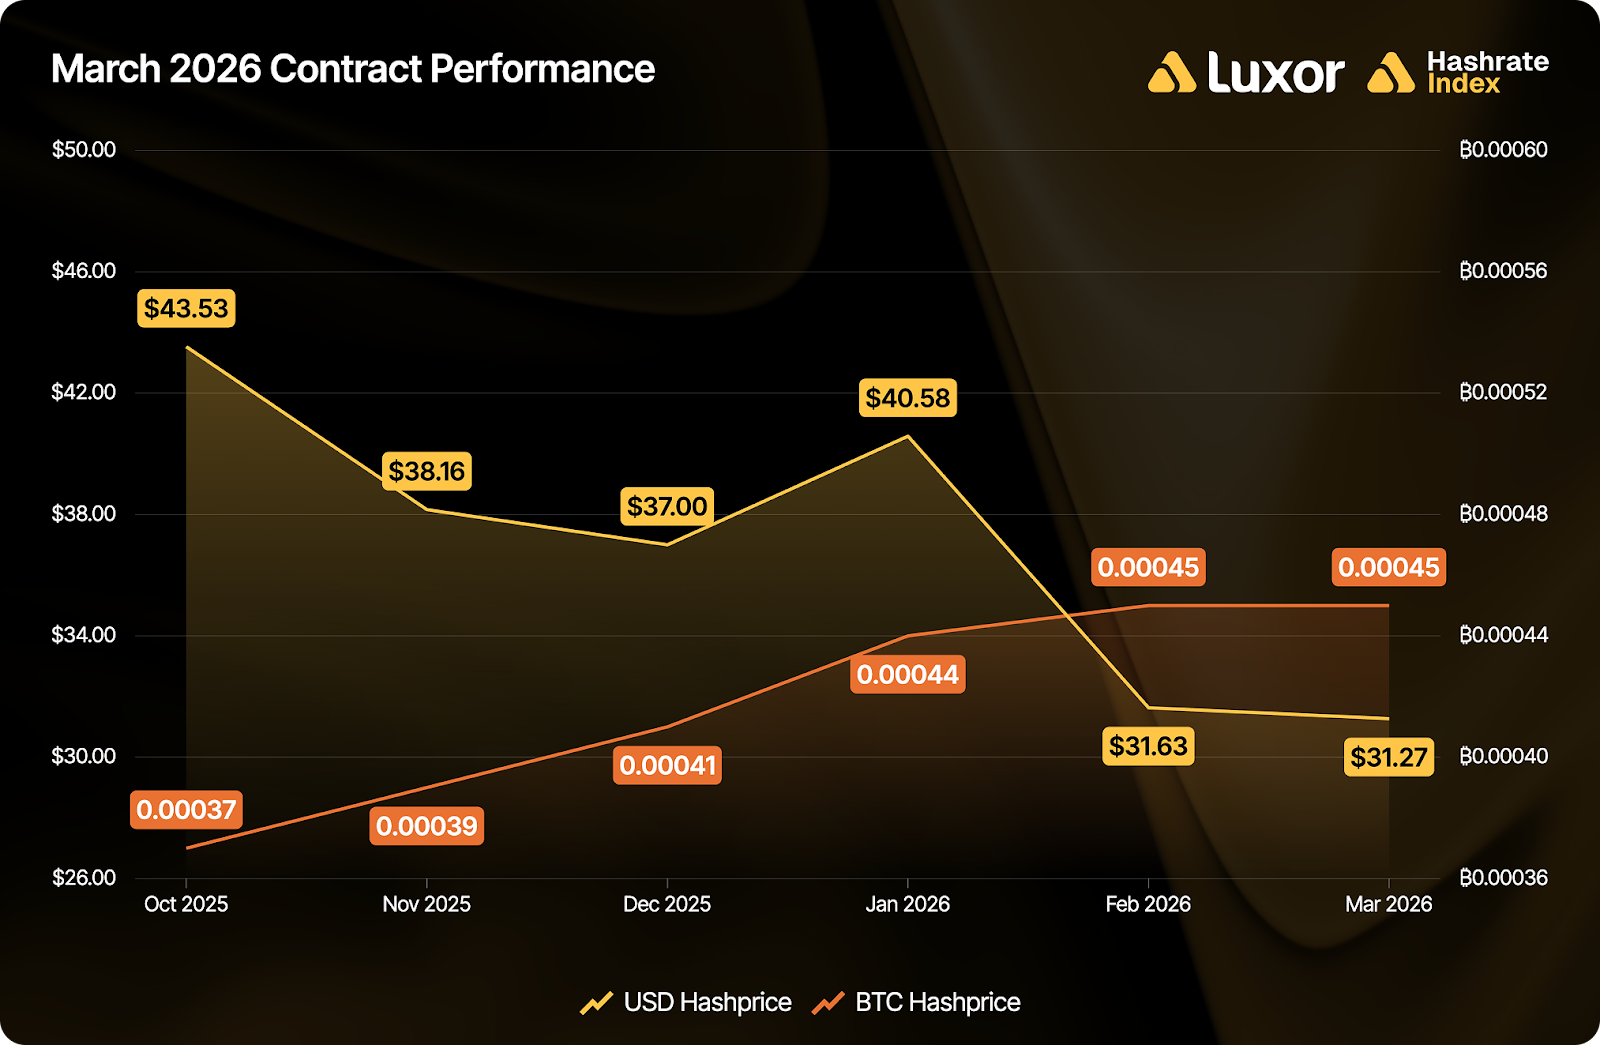
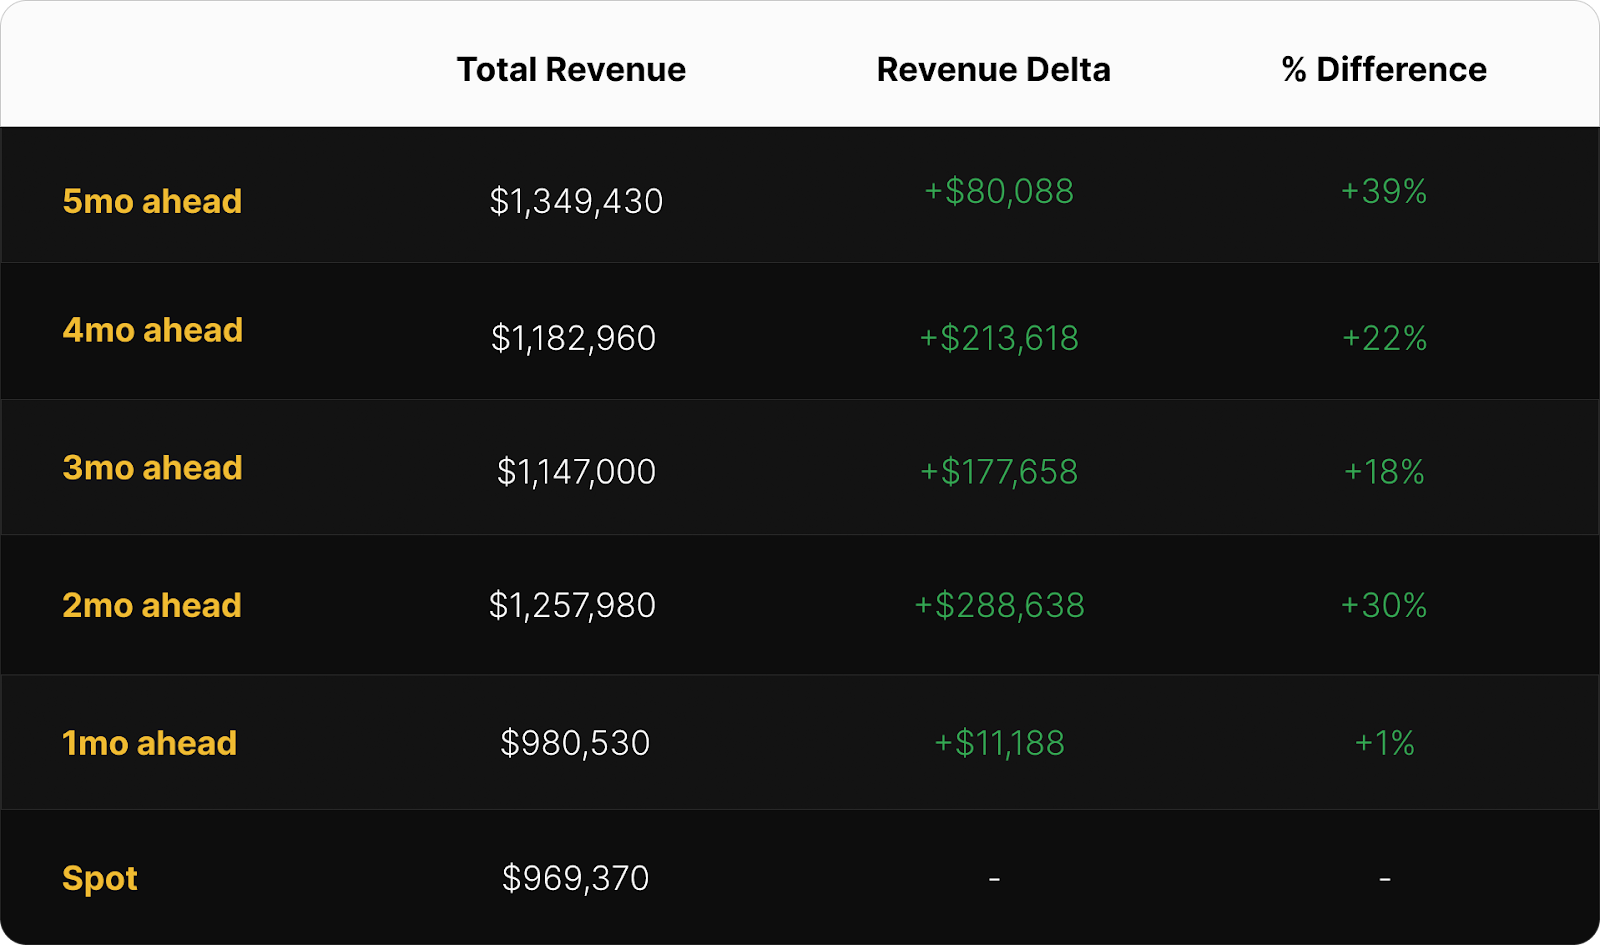
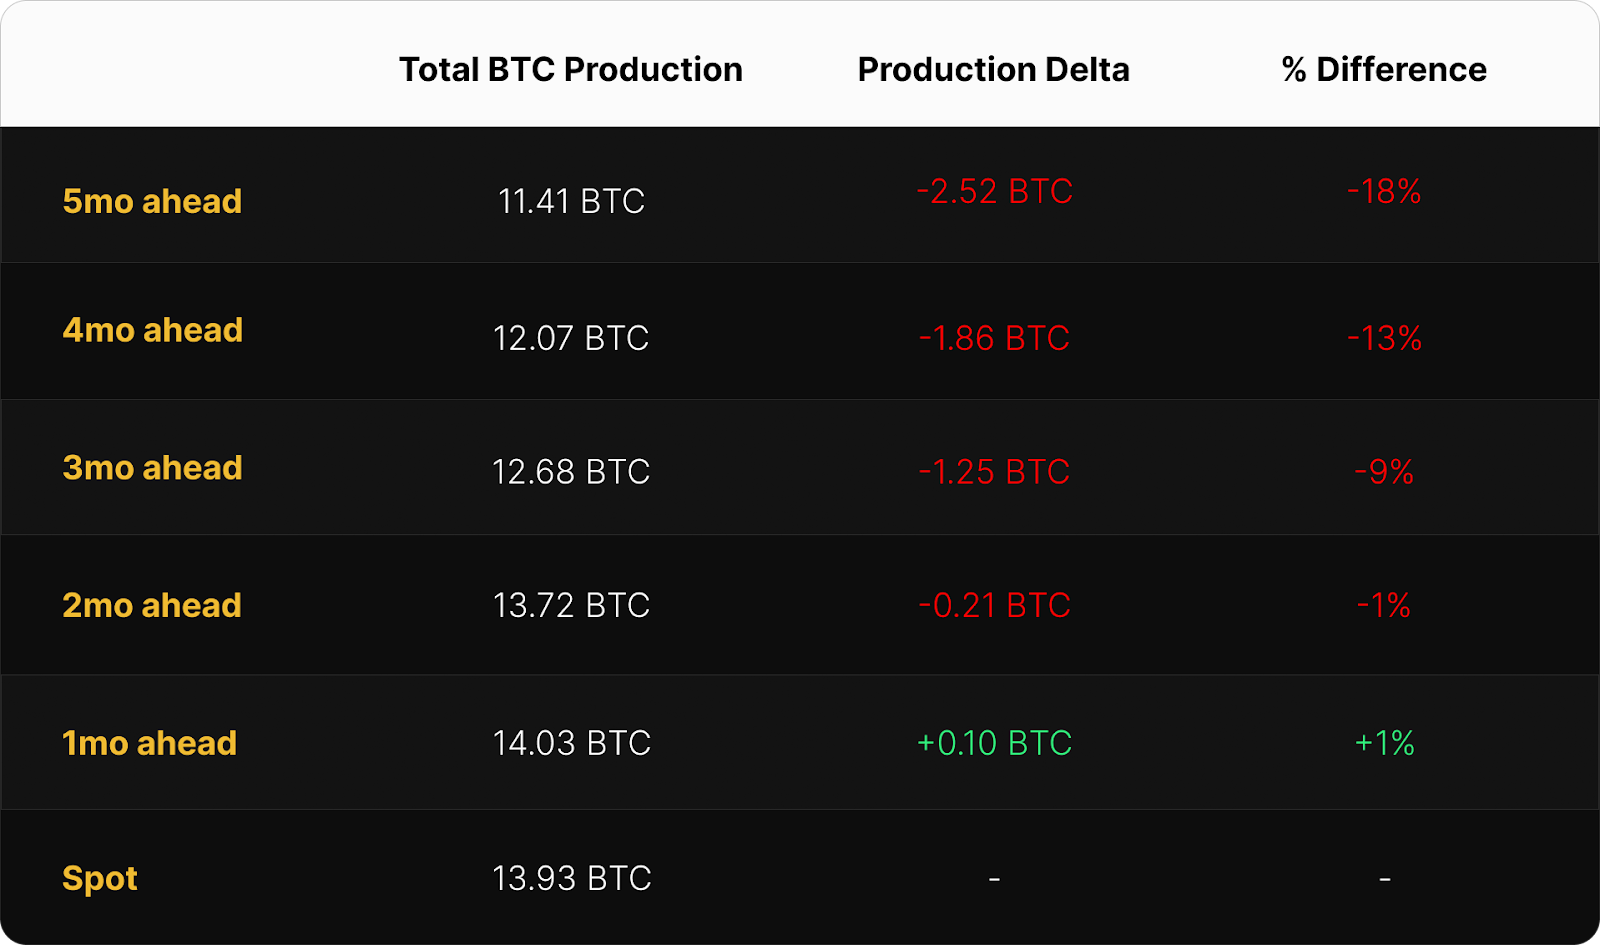
USD-denominated sellers outperformed spot (FPPS) mining across all intervals. Forward sellers locked in between $31.63–$43.53 per PH/s/day versus spot settlement at $31.27. Sellers who locked in five months ahead (in October 2025) captured a 39% premium. The optimal USD hedge was a five-month forward sale in October 2025 at $43.53 per PH/s/day.
BTC-denominated buyers outperformed spot for all intervals except the 1-month, where the result was marginally positive for sellers. Forward sellers of BTC-denominated contracts received 0.00037–0.00045 BTC per PH/s/day, below spot settlement of 0.00045 BTC; spot miners produced more BTC per unit of hashrate.
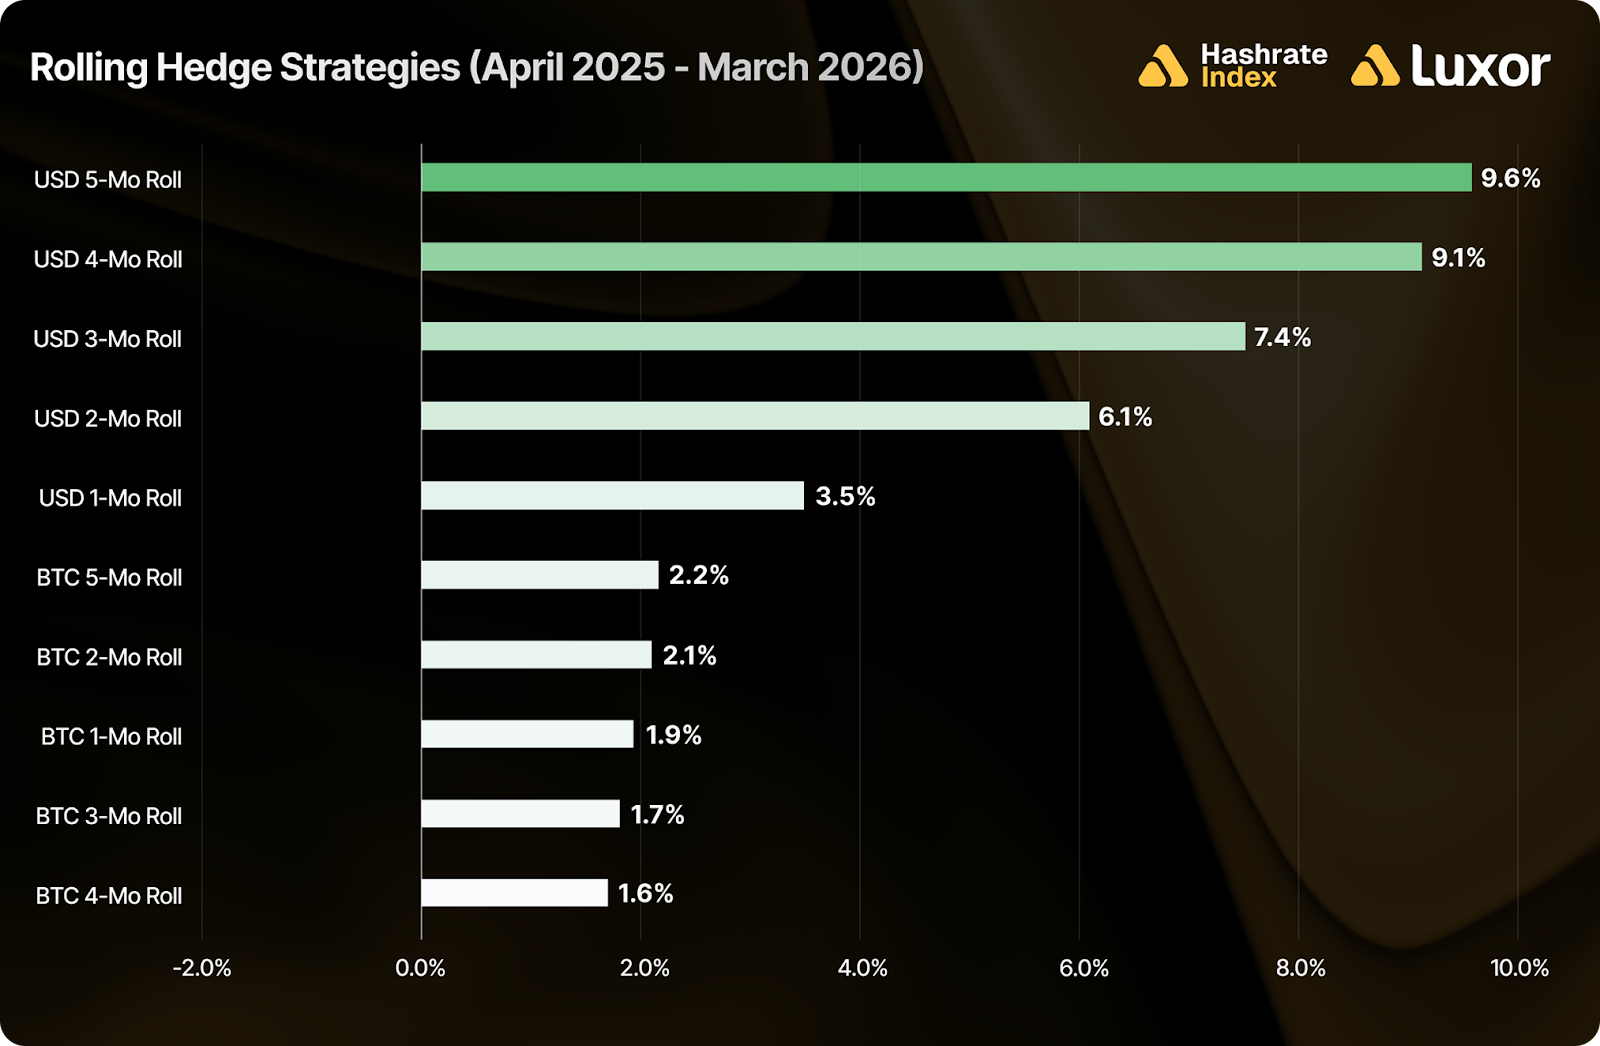
Zooming out, we examine rolling hedge performance across two windows: the trailing twelve months (April 2025–March 2026) and since the April 2024 halving.
Over the past year, rolling hashrate hedging strategies have outperformed spot mining across the board. The strongest results came from 5-month (+9.6%) and 4-month (+9.1%) USD-denominated forward sales, which generally benefited from locking in a hashprice ahead of weak BTC price action, rising network difficulty, and low fee environments.
Extending the window back to the halving continues to favor BTC-denominated strategies. The BTC 5-month roll led all strategies at +12.5% vs. spot, followed by BTC 4-month (+8.6%), BTC 3-month (+5.5%), and BTC 2-month (+3.3%). USD strategies still outperformed spot but clustered at the bottom: USD 3-month (+2.8%), USD 4-month (+2.5%), USD 1-month (+2.1%).
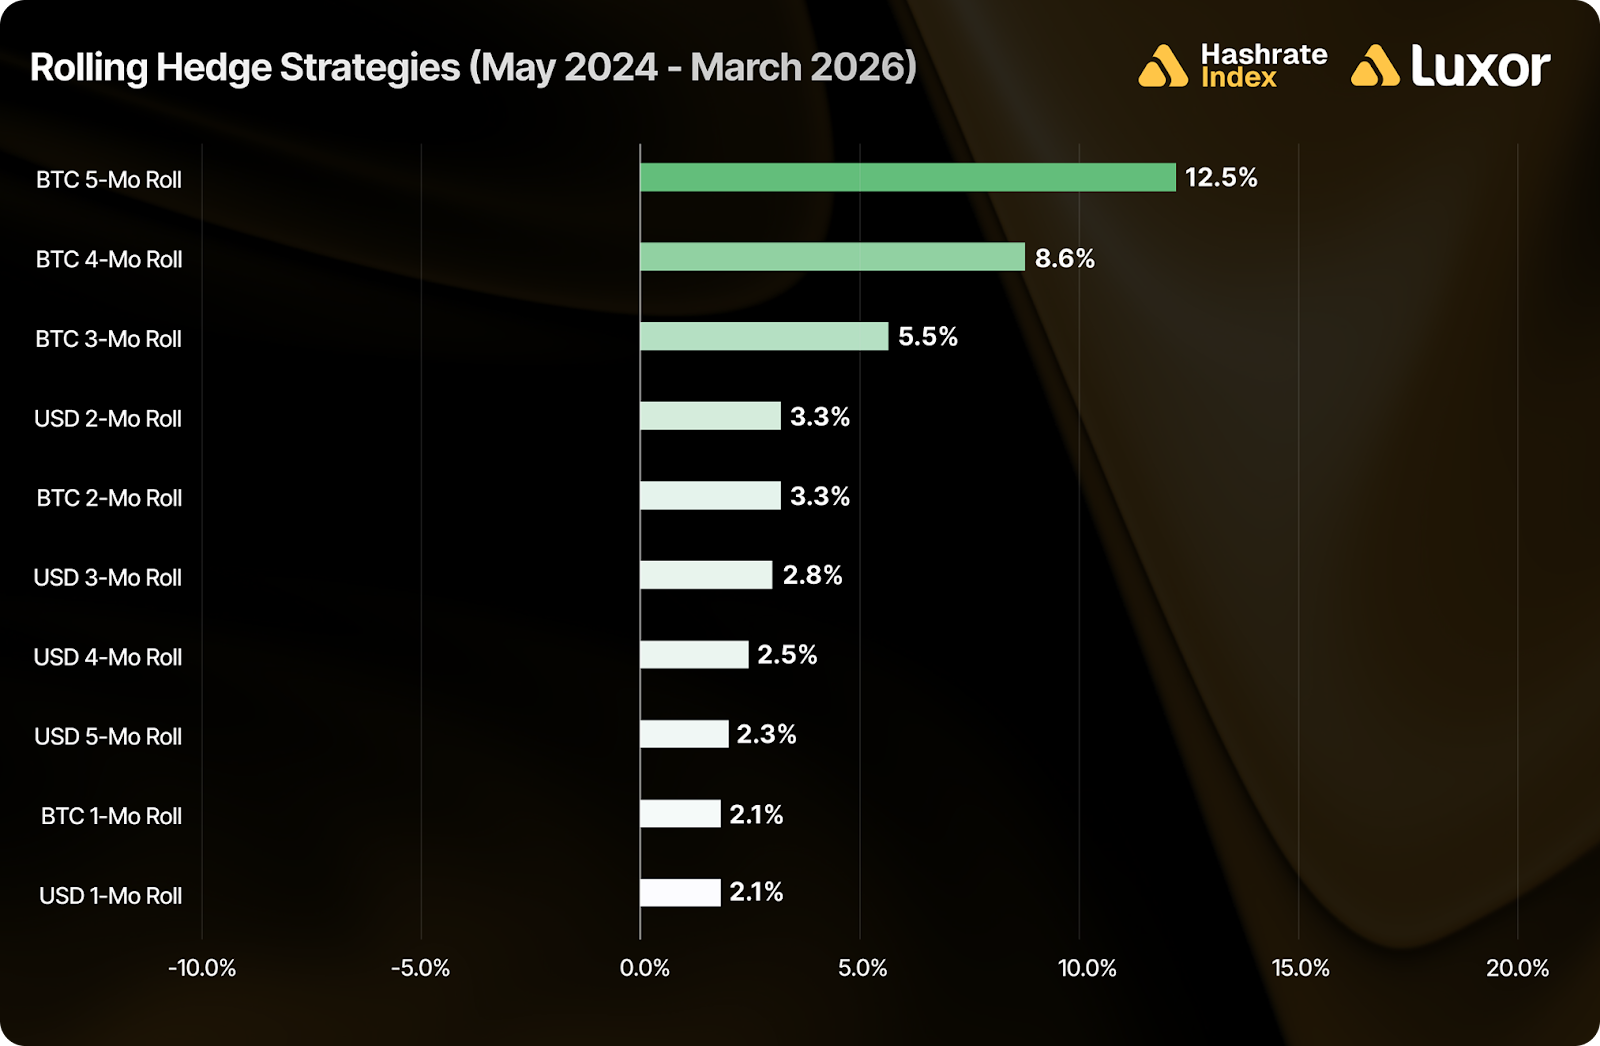
The contrast remains instructive: which contract denomination outperforms depends entirely on whether BTC price or network difficulty moves faster and further than the forward market anticipated at the time of hedging. Over the post-2024-halving period, BTC-denominated hashrate hedging programs protected against secular difficulty growth, while USD-denominated programs benefited from locking in hashprice ahead of bearish BTC price action.
Note: two important caveats apply to both windows. First, figures exclude fees and bid/ask spreads. Second, hedging is a cost of business rather than a revenue generation strategy. Hedgers willingly buy certainty for predictable cash flows, which increases valuations, reduces capital costs, and ultimately attracts investments.
How Future Hashrate Traded in March 2026
The two tables below summarize the evolution of hashrate forward markets during March 2026, for the subsequent five months from April 2026–August 2026. Rows represent specific monthly hashrate contracts, while columns represent specific trading days. Cell values indicate the average daily mid-market price, except for spot.
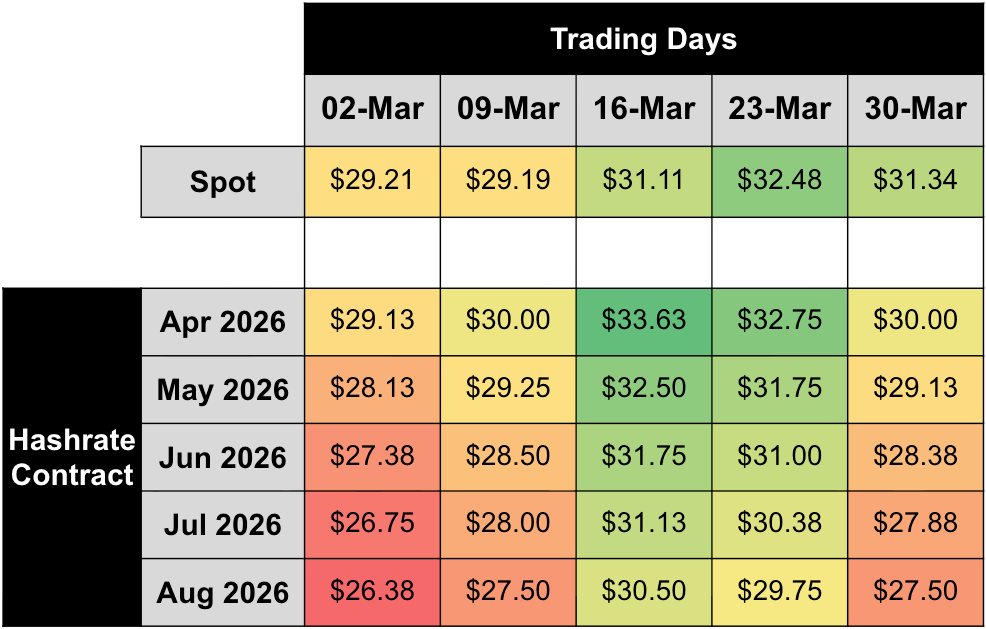
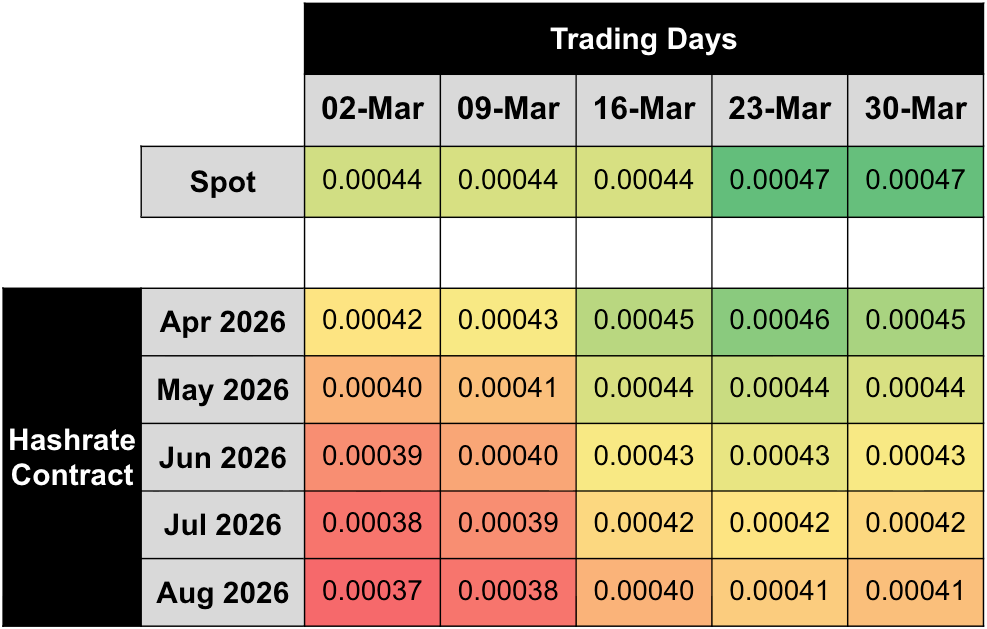
In March, mid-market rates for Apr–Aug 2026 USD contracts rose ~3-4%. BTC contracts rose more sharply, ~7-11% across the curve, as the -7.76% difficulty adjustment on March 20 led markets to revise BTC hashprice expectations upward. USD contracts traded in a mix: in contango for earlier months and backwardation for later months. BTC contracts traded predominantly in backwardation; near-term future hashprice expectations priced below spot.
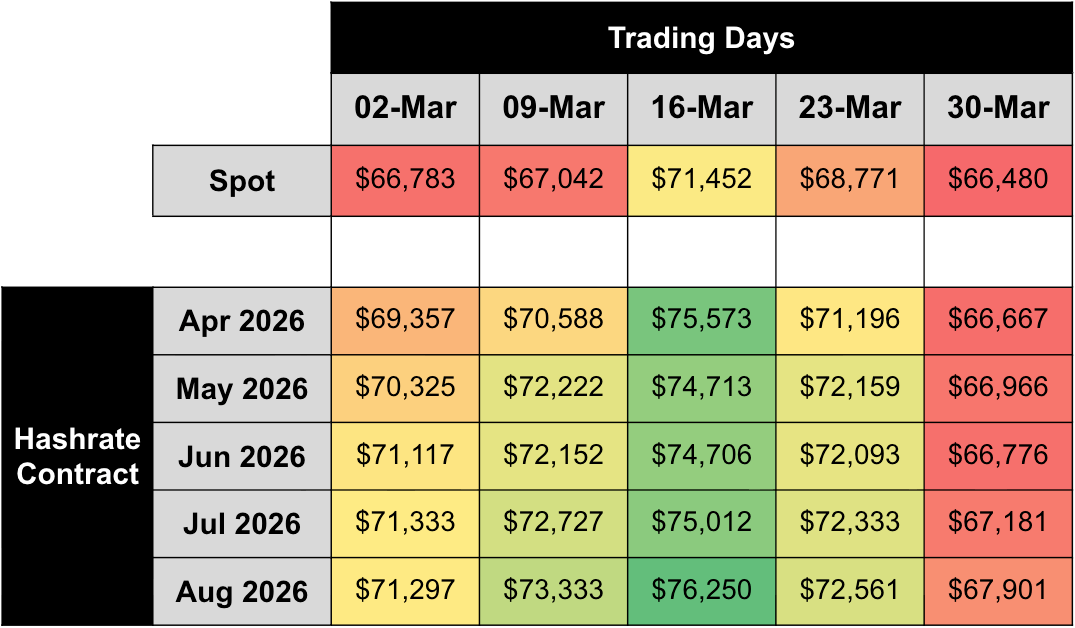
Dividing USD contract values by BTC contract values extracts the implied BTC price expectations embedded in the forward hashrate market. Implied BTC price expectations fell ~5% on average in March, trading in mild contango across maturities. This structure suggests the market expects a slight BTC price recovery over the next several months.
Assuming 0.018 BTC per block in transaction fees, we can also back out implied difficulty and network hashrate expectations:
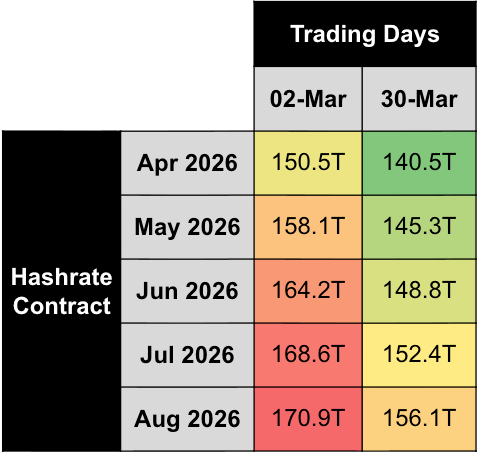
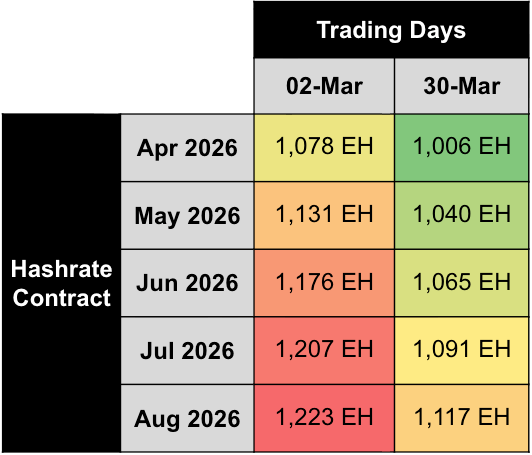
Note: figures assume 0.018 BTC per block transaction fee collection on March 2 and March 30, 2026.
Based on this analysis, the forward market priced in an average ~9% decrease in difficulty and hashrate expectations for the April–August 2026 period during March 2026.
Concluding Thoughts and Looking Ahead
As of early April, BTC price and USD hashprice are hovering around ~$72,000 and ~$32 per PH/s/day. The conflict in Iran has just reached a two week ceasefire. The latest difficulty adjustment (+3.87%) occured on April 3, pushing difficulty up from 133.79T to 138.97T, and the next adjustment is expected to occur on April 17, currently estimated at approximately -3.5%.
At these all-time low levels in spot hashprice, there are many ways for hashrate market participants to engage in the forward market.
The Case for Hedging Hashrate
USD hashprice is at an all-time monthly low. The core risk for miners is that it goes lower before it recovers. For operations where margins are already thin, selling forward now converts uncertain revenue into predictable cash flow. Hashrate Index’s latest mining economics projections base case scenario (Q2 2026) estimates USD hashprice sensitivity to BTC prices in the following table:
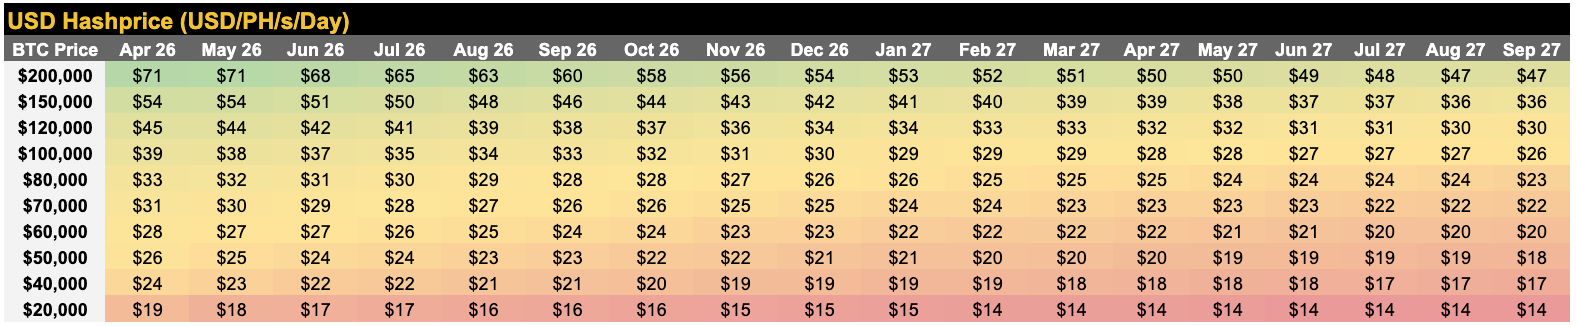
Note: Values shown above are equilibrium hashprice estimates. They reflect the expected hashprice after the network self-corrects: unprofitable hashrate curtails and drops off at lower BTC prices, while previously marginal hashrate returns online at higher prices. In practice, hashprice will overshoot and undershoot these levels in the short term as difficulty adjustments lag hashrate movements by up to two weeks. The table should be read as "where hashprice stabilizes once the market clears at a given BTC price and the corresponding active hashrate".
The Case for Financing With Hashrate
The same forward market that protects sellers can also serve as financing for fleet upgrades. By selling hashrate via the Deliverable Forward (DF) and receiving upfront payment, miners can fund capital expenditure without equity dilution or debt.
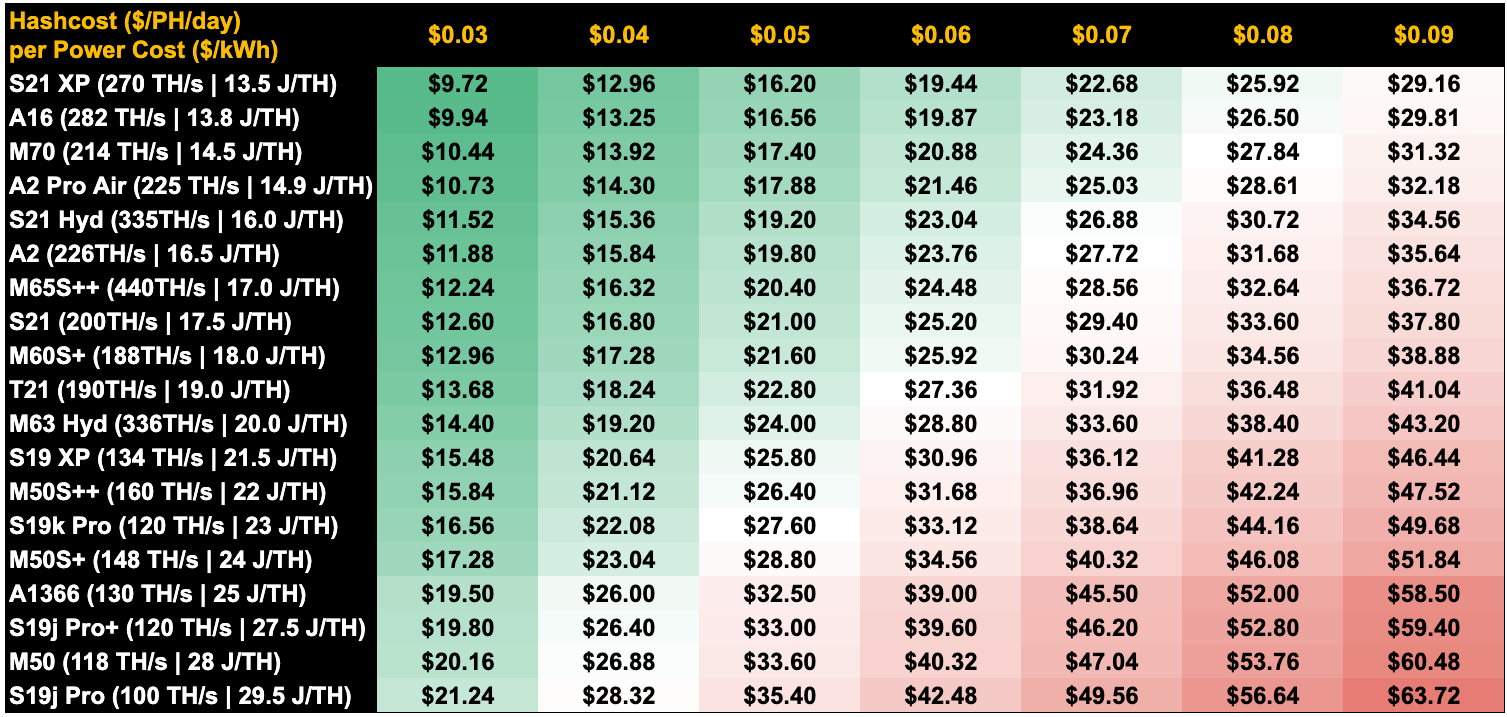
An S21 operator at $0.07/kWh has a hashcost of $29.40, whereas an S19j Pro operator at $0.05/kWh faces a hashcost of $35.40, well above spot and forward pricing. Upgrading from the S19j Pro to the S21 at the same power cost cuts hashcost from $35.40 to $21.00 — a $14.40 per PH/s/day improvement. The upgrade pays for itself quickly; the DF provides the non-dilutive capital to execute it.
The Case for Buying Hashrate
USD hashprice at an all-time monthly average low means forward hashcost is also near its lowest level. The forward curve is currently pricing Apr–Sep 2026 at an average of ~$32 per PH/s/day, below spot and right around the March monthly average. At $32 per PH/s/day, buying forward hashrate is more economical than self-mining at any site where hashcost exceeds that figure: an S19j Pro at $0.045/kWh has an equivalent hashcost of $31.86. Any legacy hardware operation at above-average power costs is paying more per PH than the current forward curve.
Beyond economics, buying offers immediate scalability, no lead times, no execution risk, and no operational overhead. For Bitcoin treasury companies, forward buyers, and operators looking to expand exposure without new infrastructure, the current market represents one of the most attractive entry points since the halving.
Looking Ahead
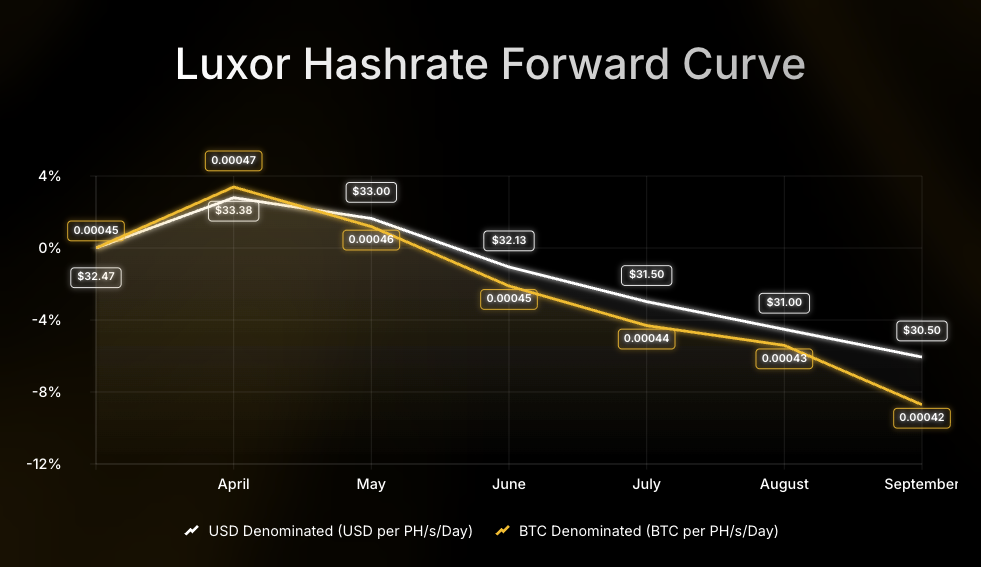
Looking forward, Luxor’s Hashrate Forward Market is pricing in an average hashprice of $31.92 or 0.00044 BTC per PH/s/day over the next six months. Sellers can currently secure this hashprice while buyers have the opportunity to lock in the same hashcost through September 2026.
If you’d like to learn more about Luxor’s Bitcoin mining derivatives, please reach out to [email protected] or visit https://www.luxor.tech/derivatives.
About Luxor Technology Corporation
Luxor delivers hardware, software, and financial services that power the global compute and energy industry. Its product suite spans Bitcoin Mining Pools, ASIC Firmware, Hardware trading, Hashrate Derivatives, Energy services, a Miner Management software, Commander, and a bitcoin mining data platform, Hashrate Index.
Disclaimer
This content is for informational purposes only, you should not construe any such information or other material as legal, investment, financial, or other advice. Nothing contained in our content constitutes a solicitation, recommendation, endorsement, or offer by Luxor or any of Luxor’s employees to buy or sell any derivatives or other financial instruments in this or in any other jurisdiction in which such solicitation or offer would be unlawful under the derivatives laws of such jurisdiction.
There are risks associated with trading derivatives. Trading in derivatives involves risk of loss, loss of principal is possible.


Hashrate Index Newsletter
Join the newsletter to receive the latest updates in your inbox.


