
Luxor Hashrate Lookback Series – February 2026
February 2026’s hashrate and hashprice trends, forward market participation, trading activity and contract performance.
Luxor’s Monthly Lookback Series is a deep dive into Bitcoin hashrate market activity. In this post, we cover February 2026’s hashrate market and hashprice trends, forward market participation, trading activity and contract performance.
Summary
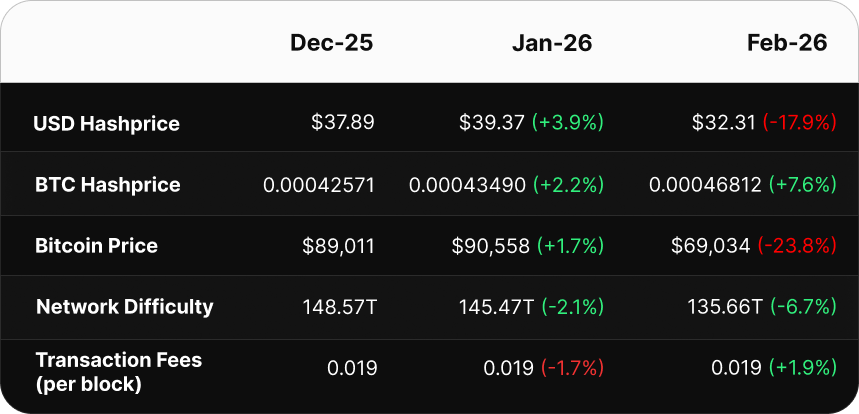
- Hashprice All-Time Low: USD hashprice hit a new daily all-time low of $27.89 per PH/s/day on February 24, and a new monthly all-time low of $32.31, as BTC dropped 23.8% from $78,073 to $65,204.
- Winter Storm Whipsaw in Difficulty: Weather-induced curtailment from late January subsided, returning offline hashrate to the network and triggering a +14.73% difficulty adjustment on February 19, the 87th percentile of all-time adjustments.
- Fiat Fork in Hashrate Hedging: USD-denominated sellers and BTC-denominated buyers both outperformed spot (FPPS) mining in February across all hedge horizons.
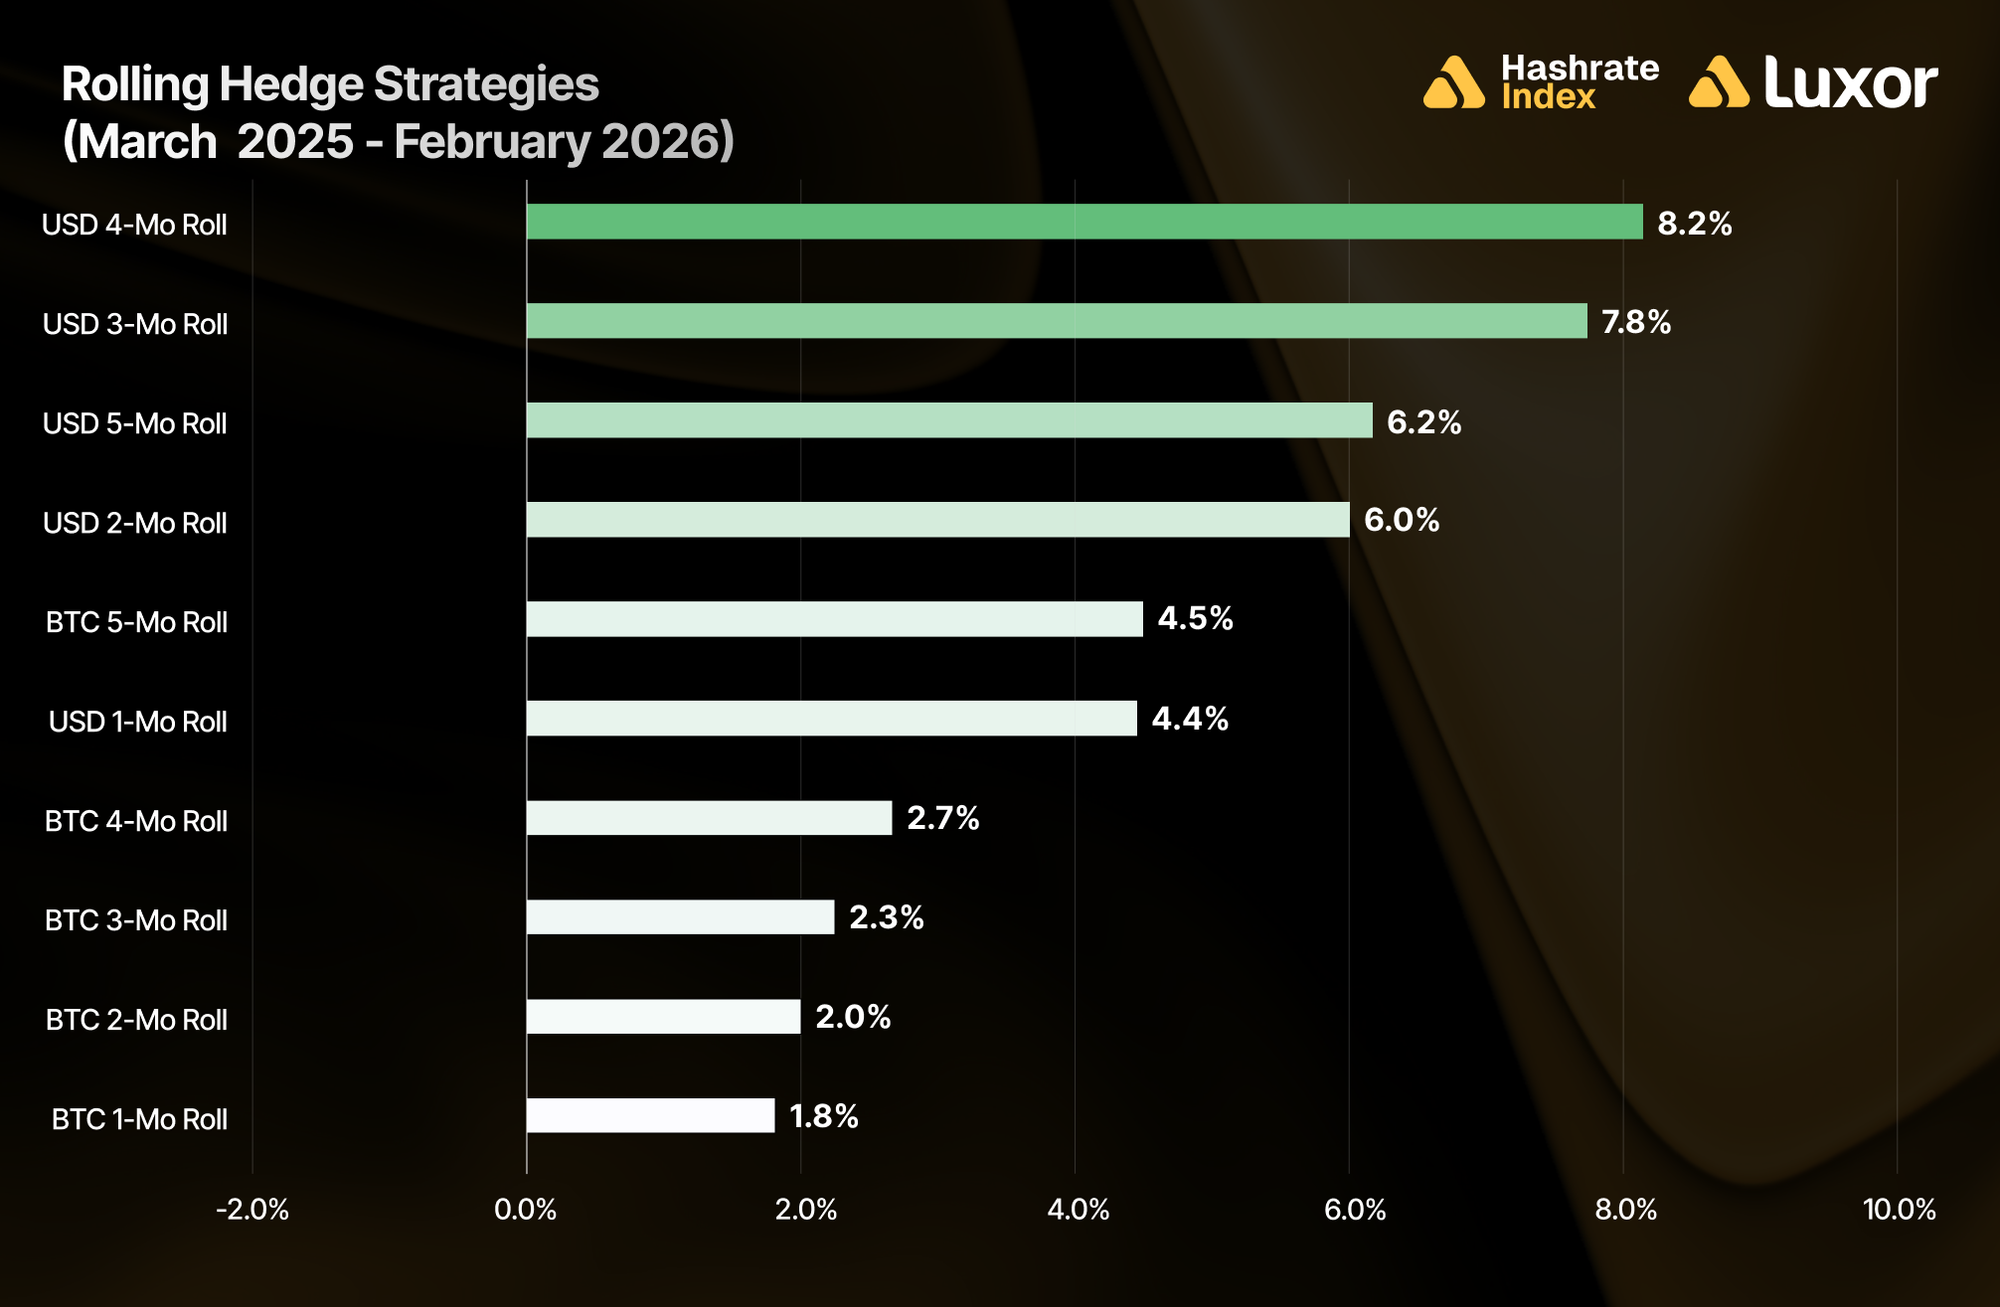
- Hashrate Hedgers Continue to Win: Rolling USD hedge strategies outperformed spot mining by up to +8.2% (4-month) over the trailing year.
- Below Breakeven: Our latest mining economics projections puts total net ASIC capacity at 1,292 EH (all machines that exist and haven't mechanically failed). With observed network hashrate at ~1,040 EH/s, ~252 EH sits offline: economically unviable and retired, currently curtailed, in transit, or under maintenance. Most legacy hardware is already retired; the fleets now at the margin are 25–29 J/TH operations running at average or above-average power costs.
February 2026 Spot Hashprice & Its Constituents
USD Hashprice — A New All-Time Low
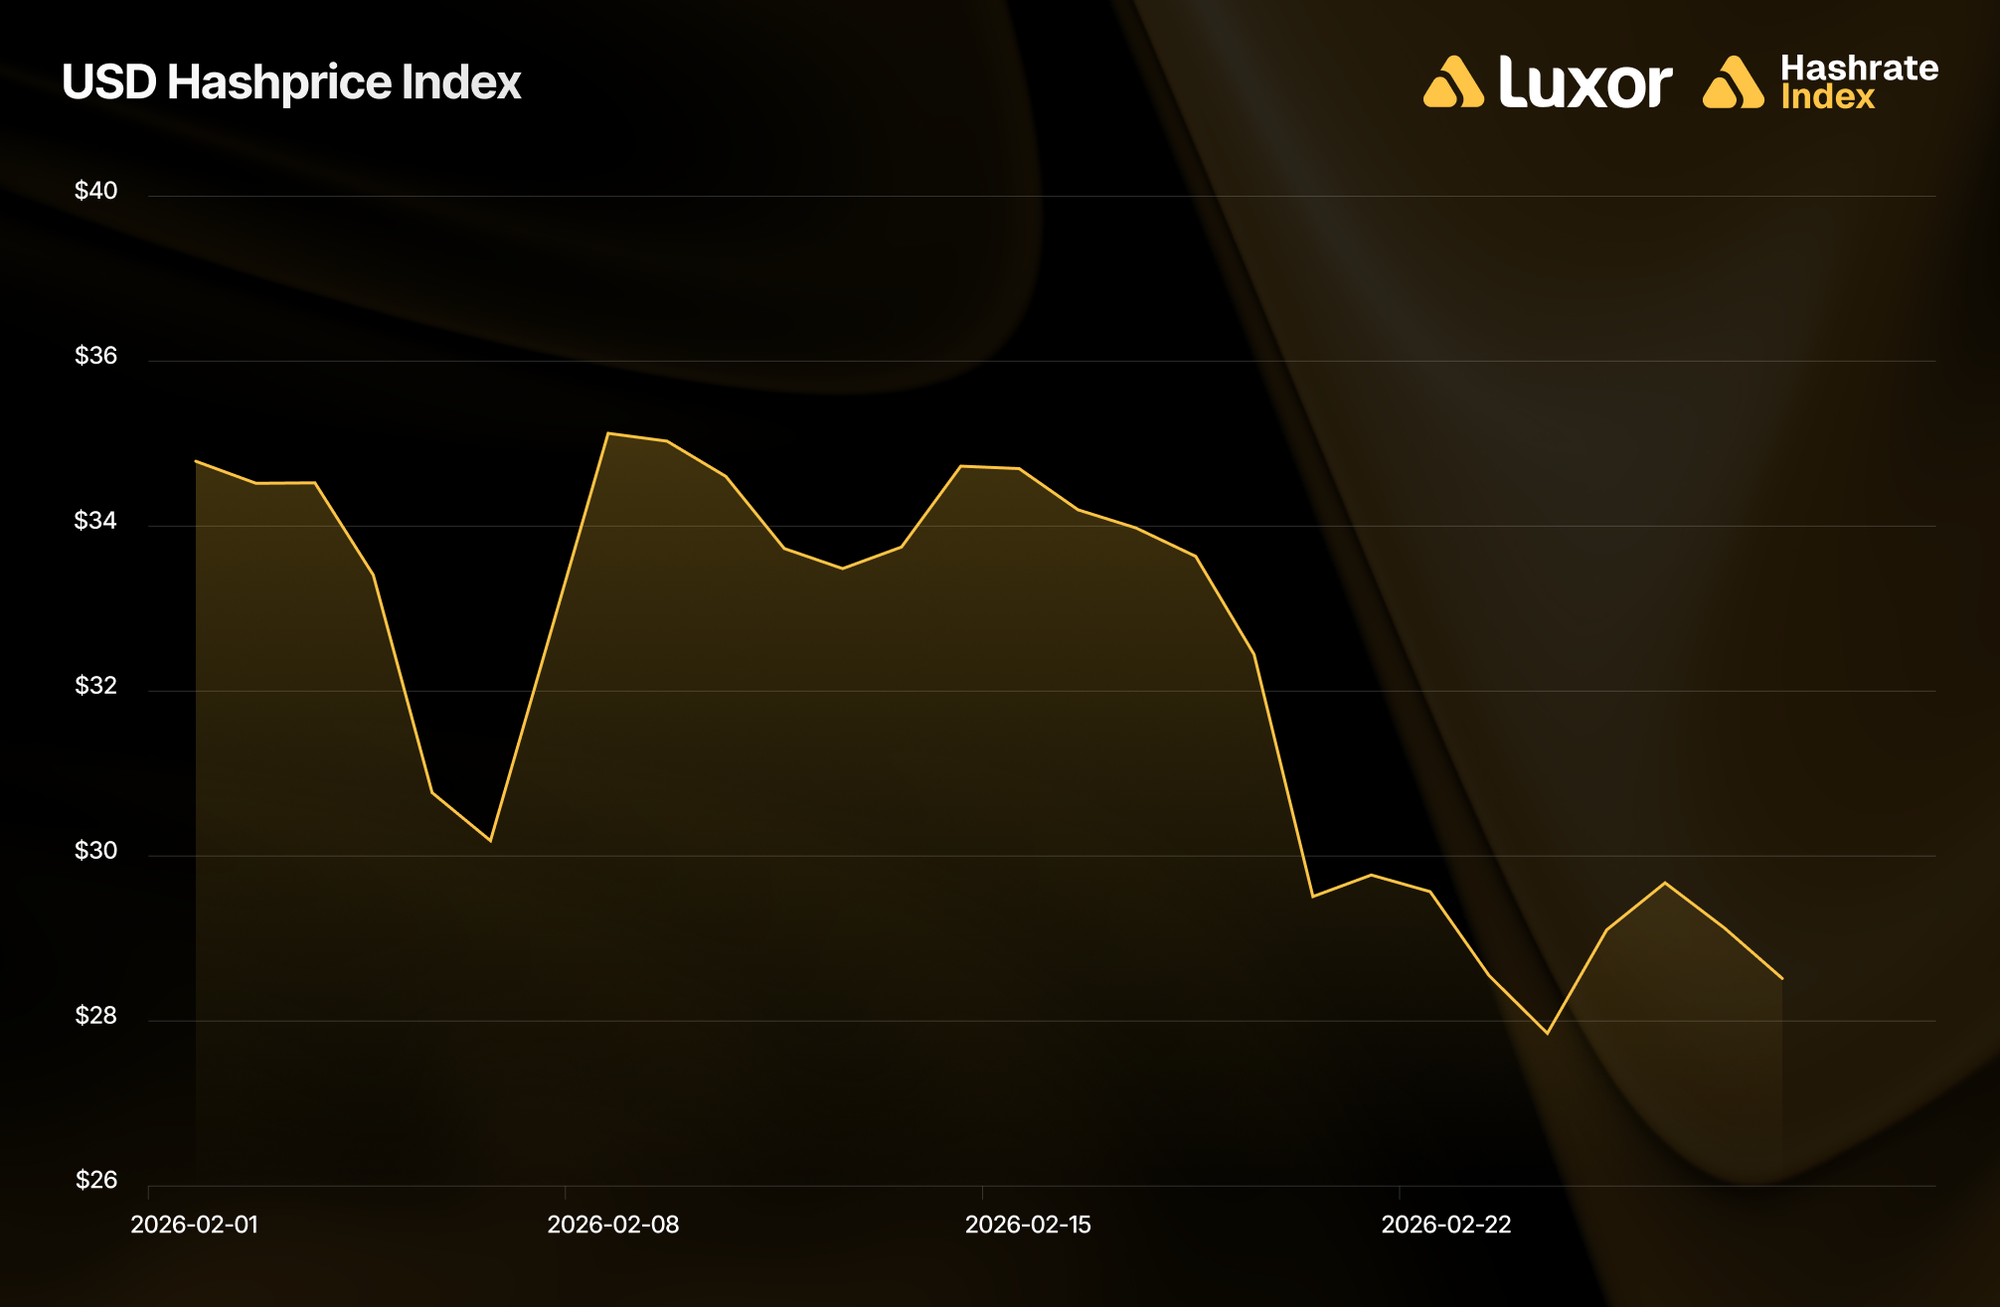
February 2026 marked a milestone miners hoped to avoid: a new USD hashprice all-time low.
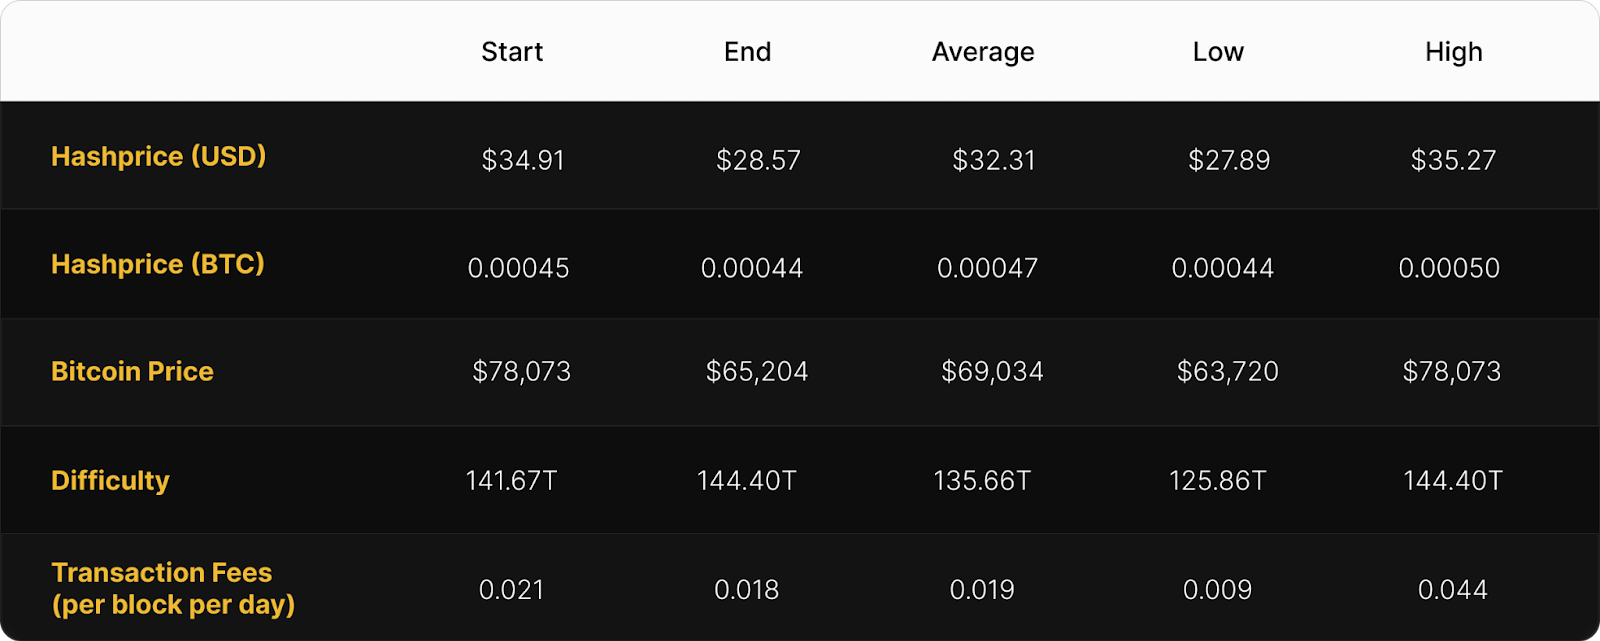
Monthly average USD hashprice fell 17.9% from $39.37 to $32.31 as BTC price declined 23.8%. USD hashprice opened the month at $34.91, briefly peaked at $35.27 on February 8 following a -11.16% downward difficulty adjustment, then deteriorated steadily through the second half of the month. It closed at $28.57, touching a new all-time daily low of $27.89 per PH/s/day on February 24.
BTC Price — Worst Drawdown of the Cycle
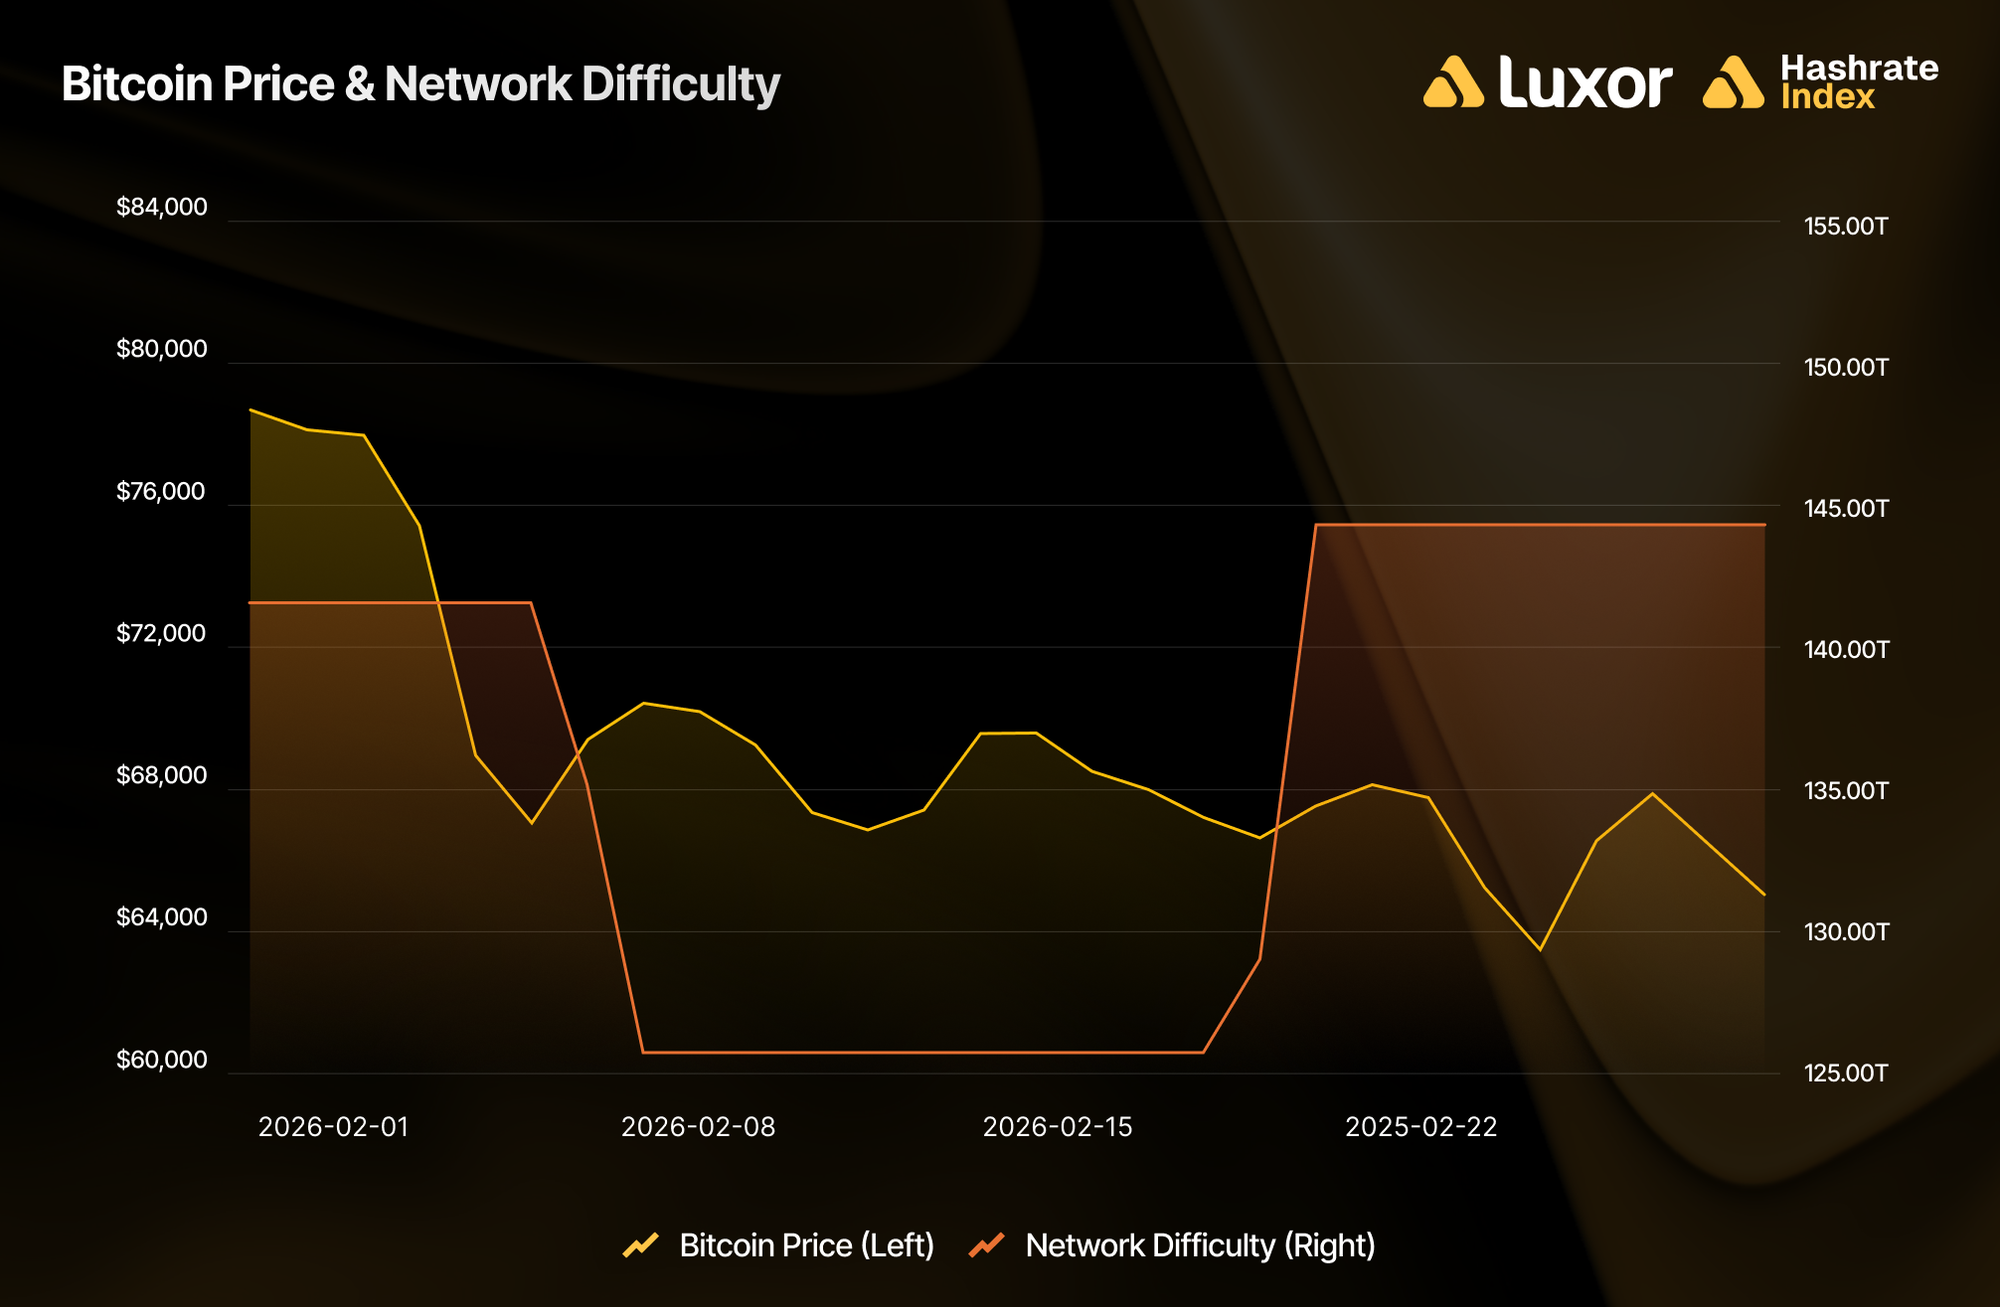
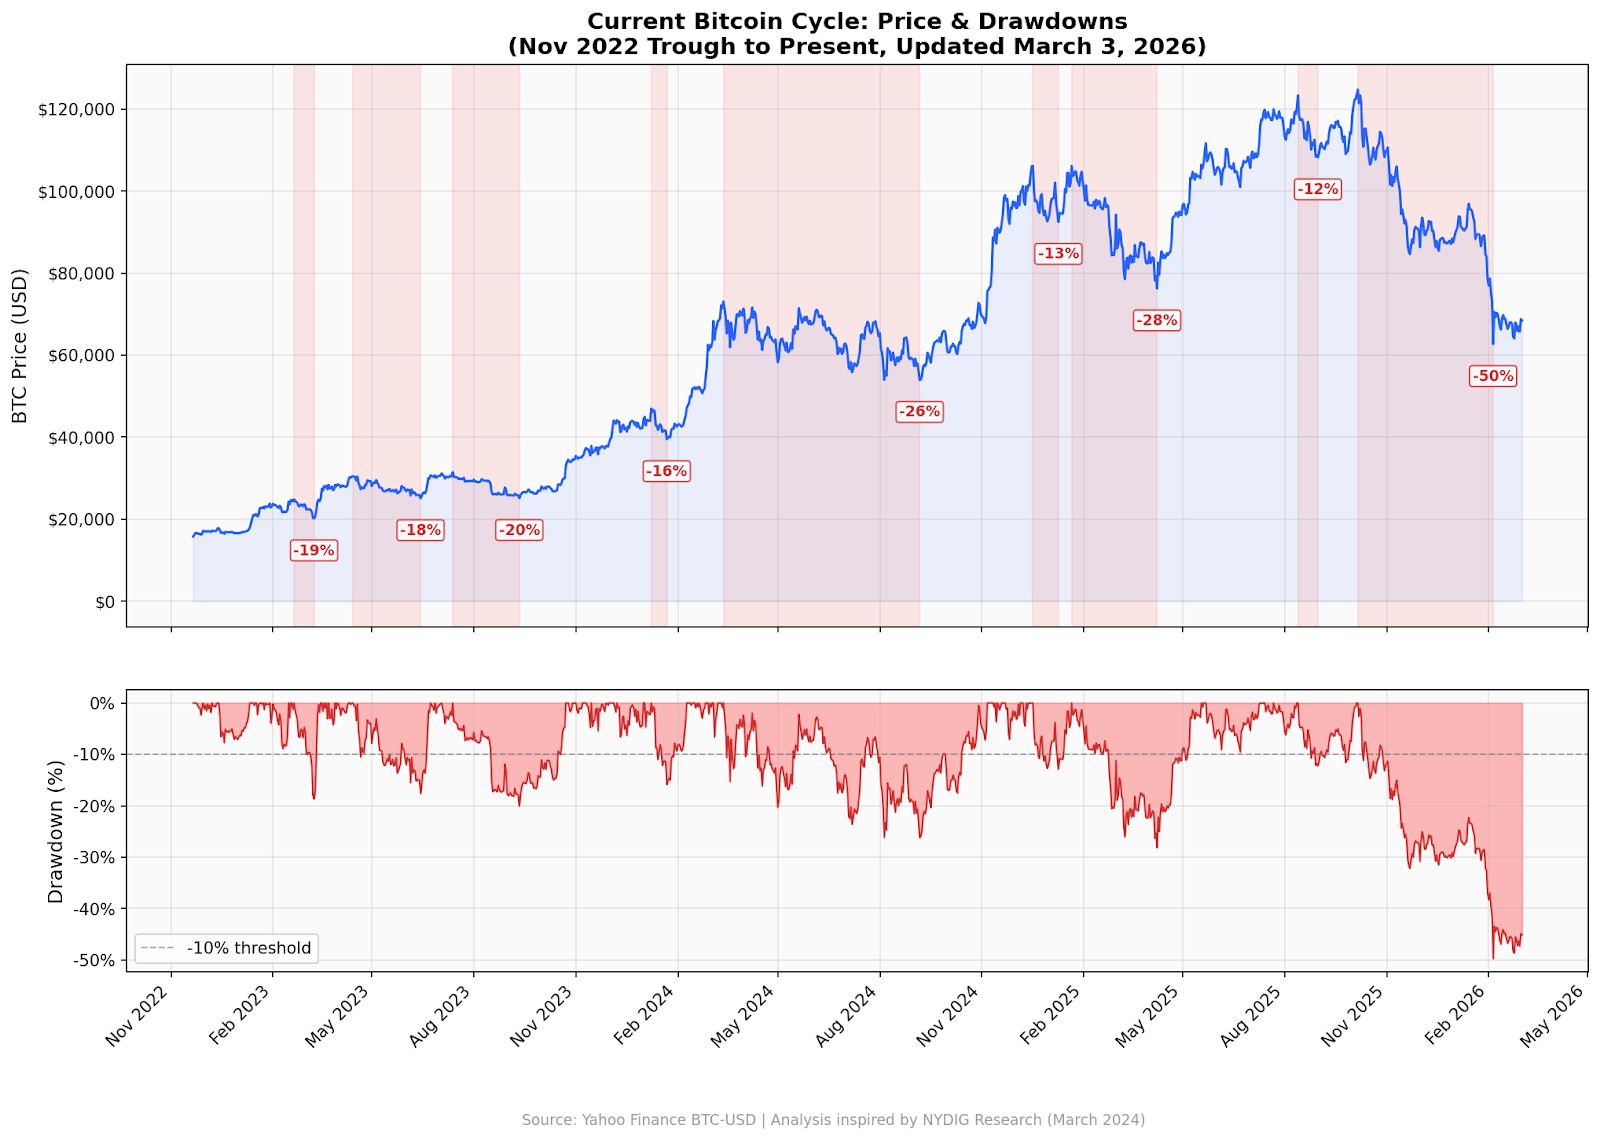
BTC opened February at $78,073, dropped 23.8% throughout the month, and closed at $65,204, averaging $69,034.
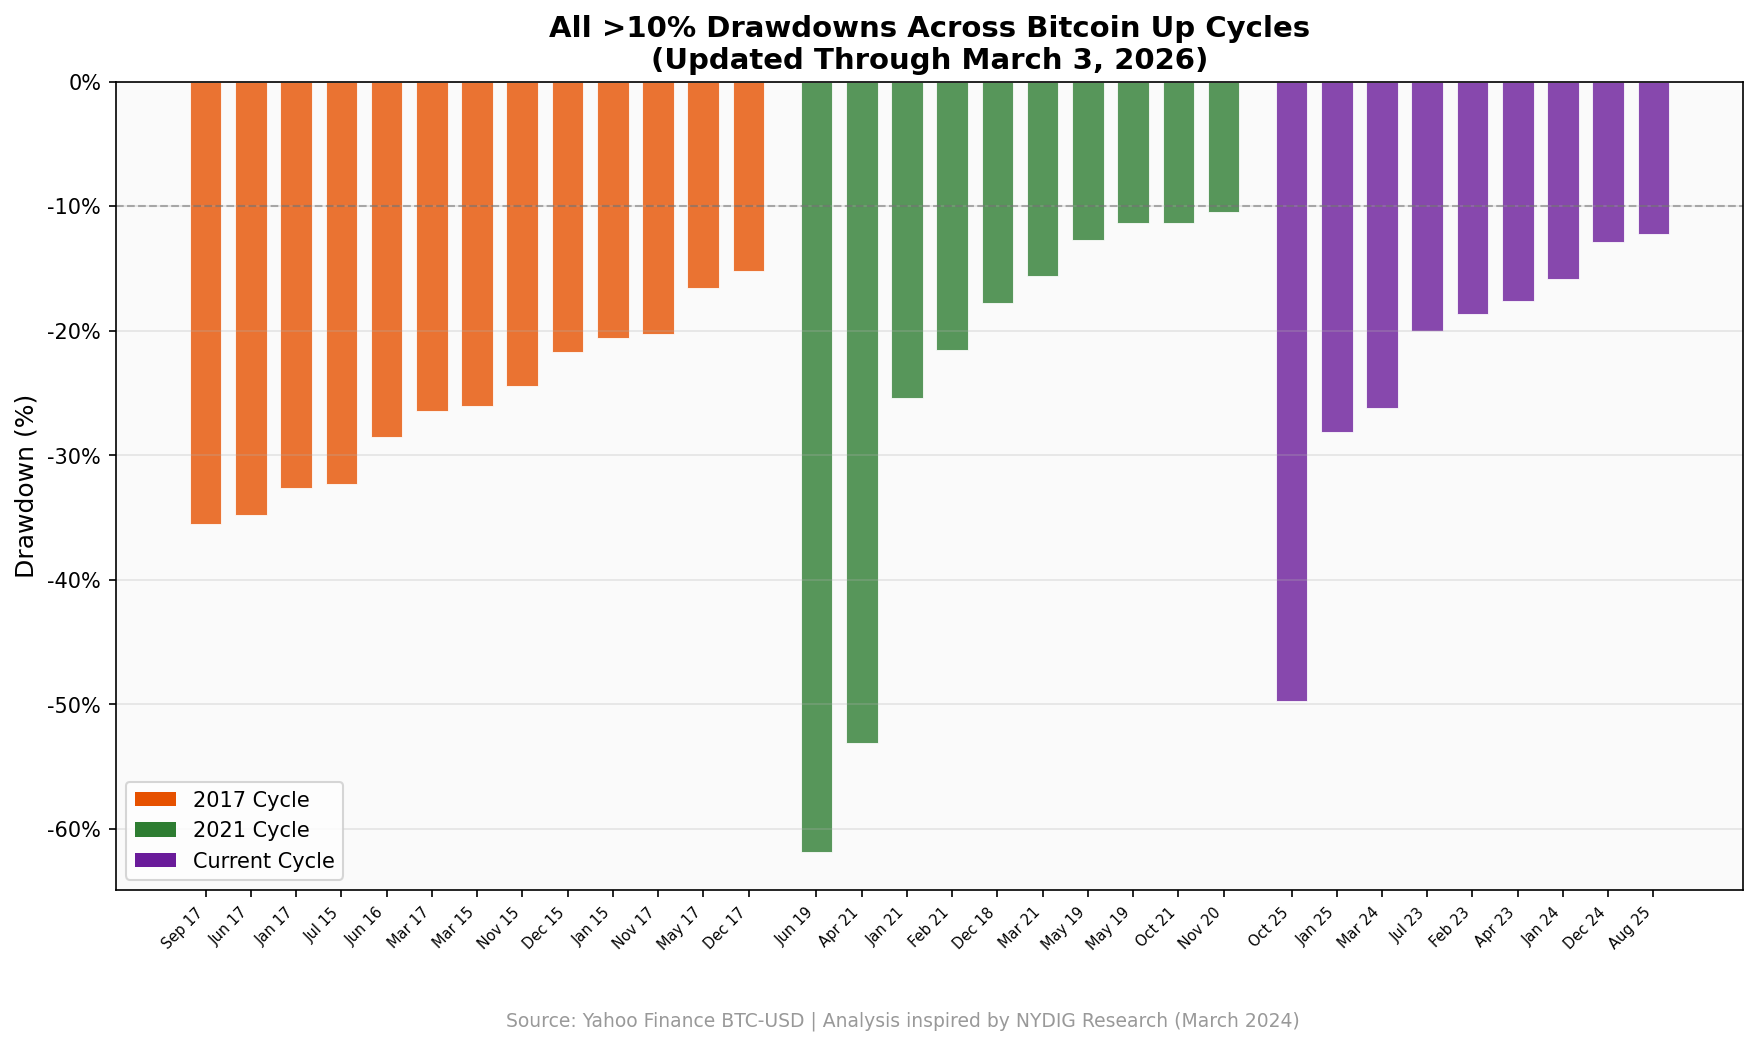
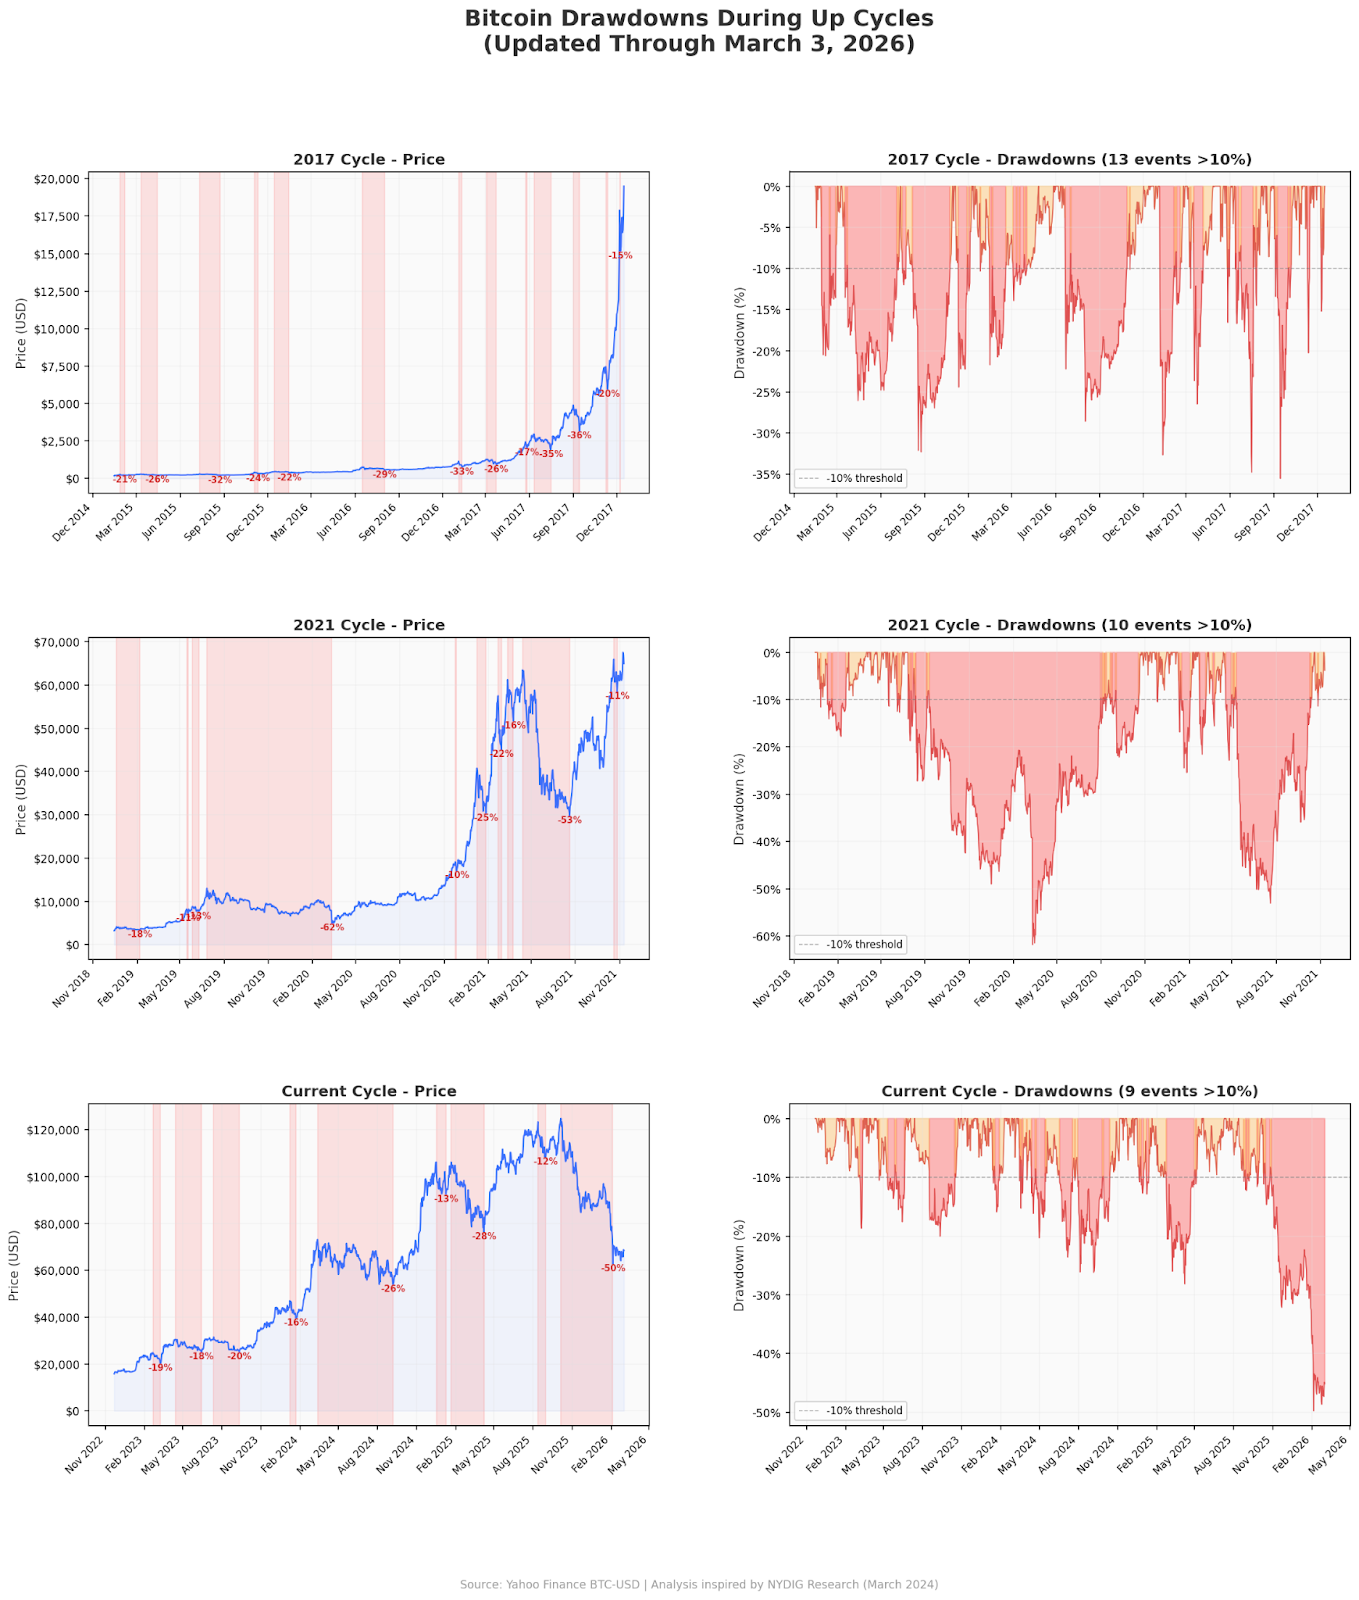
February’s 23.8% decline extended what is now the deepest BTC drawdown of the current cycle. After peaking at ~$126,000 in early October 2025, BTC fell ~50% to ~$63,000 by late February 2026 — the 9th drawdown exceeding 10% since the cycle trough of $15,460 in November 2022.
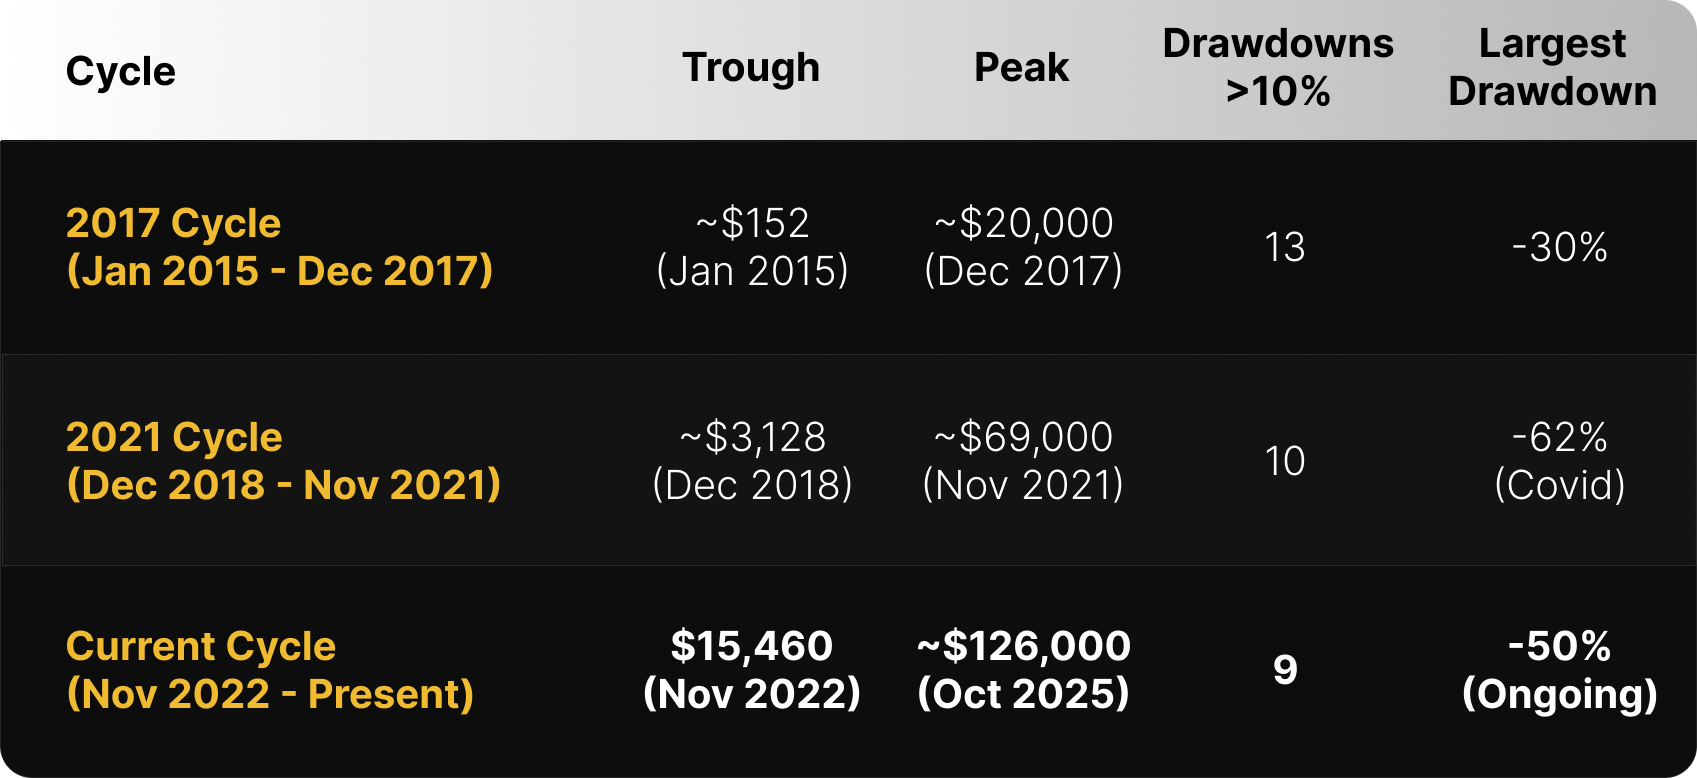
To put this in context: drawdowns of this magnitude are painful but not historically unusual during Bitcoin bull markets. The 2021 cycle (Dec 2018 trough → Nov 2021 peak) included a -62% COVID crash and a -53% mid-cycle correction, yet still peaked at $69,000. The 2017 cycle (Jan 2015 trough → Dec 2017 peak) saw 13 separate drawdowns exceeding 10%, with a largest correction of -39%, before reaching $20,000.
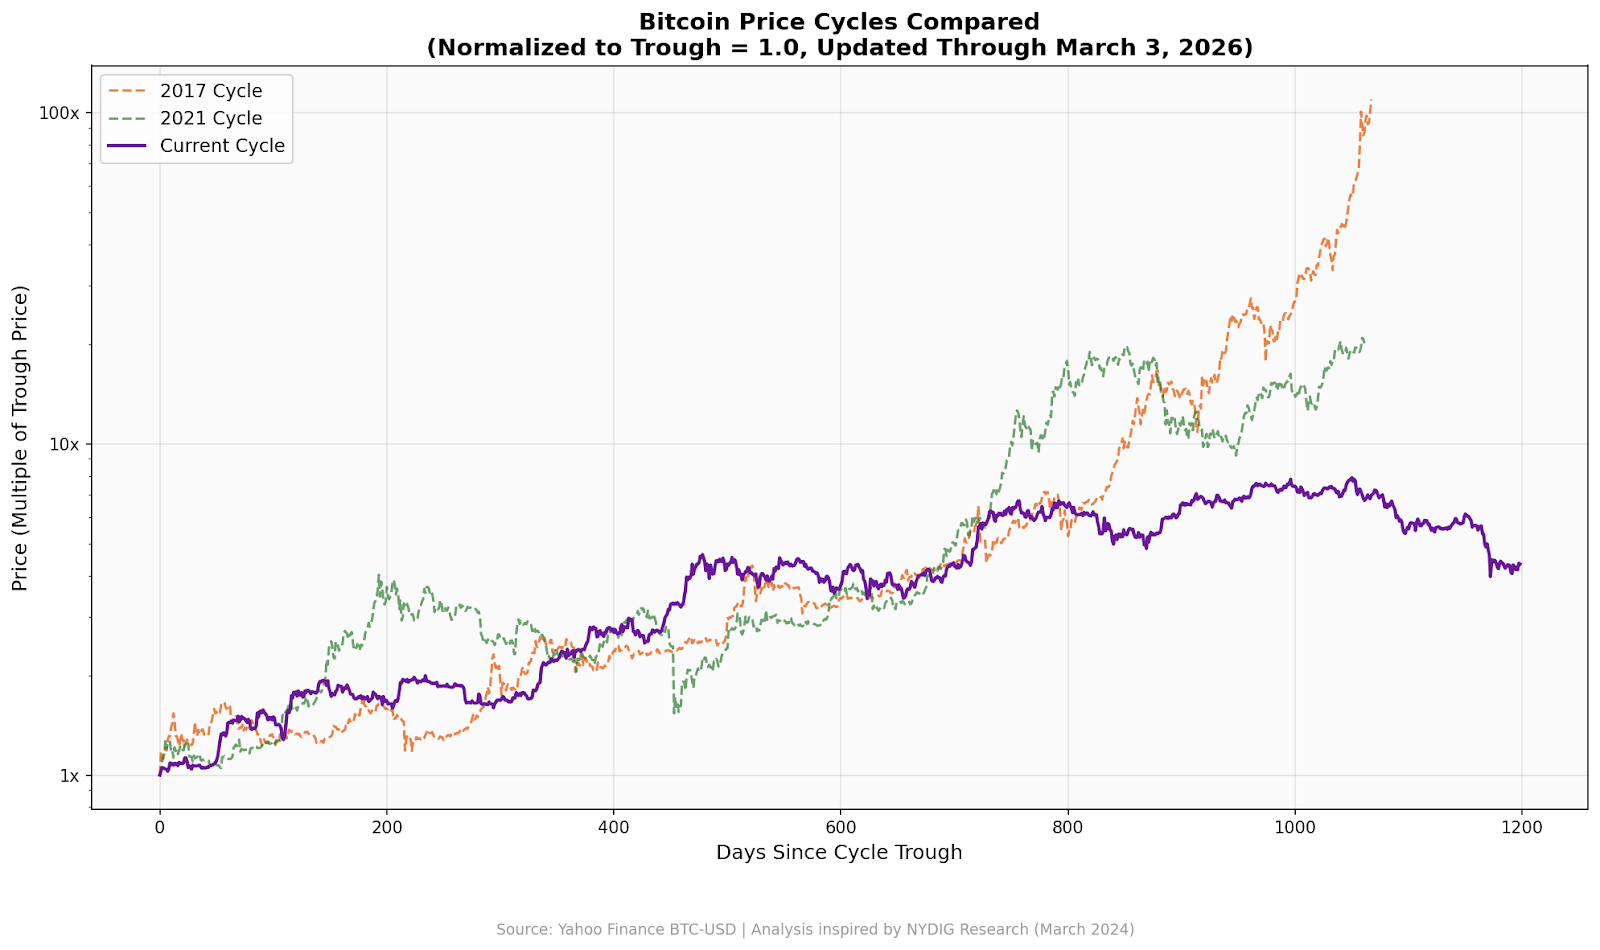
What separates the current cycle from its predecessors is the smaller magnitude of gains, not the pain of corrections. Each cycle's returns look dramatically different in dollar terms, but normalizing them to a common starting point (expressing BTC price as a multiple of each cycle's trough) reveals a consistent pattern of diminishing returns. The 2017 cycle peaked at ~131x its trough. The 2021 cycle peaked at ~22x. The current cycle peaked at ~8x ($15,460 → $126,000).
Network Difficulty — A Historic Whipsaw
February's difficulty story is one of the most dramatic on record, and its resolution was equally sharp.
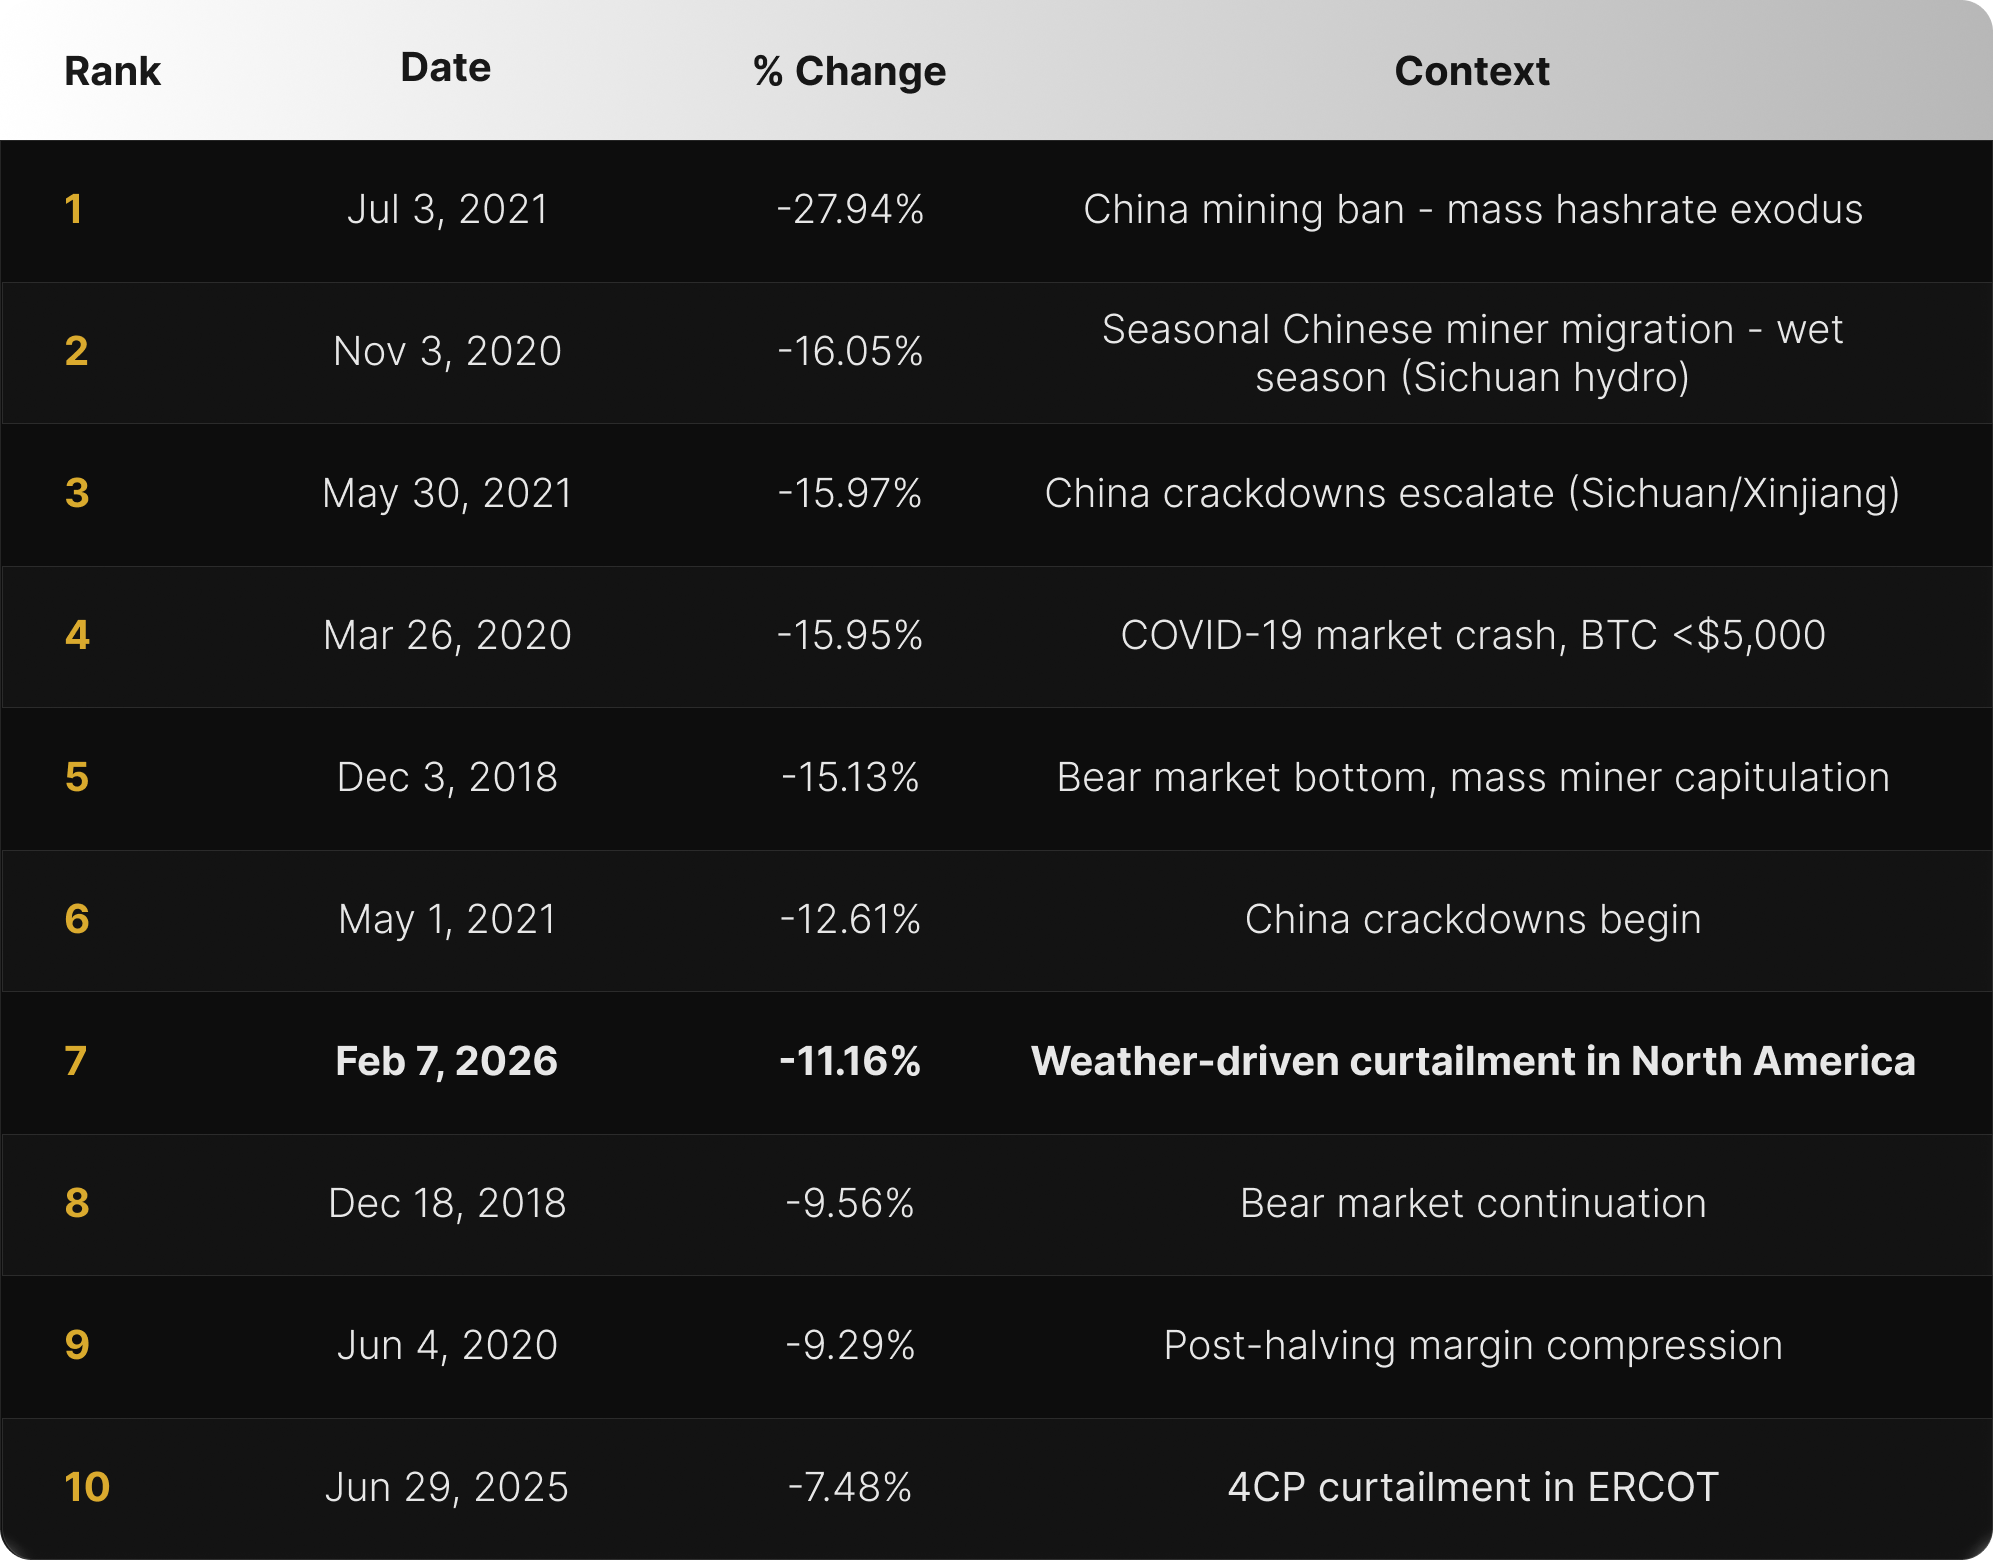
Following two consecutive downward adjustments, a -11.16% adjustment on February 7 extended the streak to three. In the modern ASIC era (defined here as 2016 onwards, after the GPU-to-ASIC transition period had normalized) it ranks as the 7th largest difficulty decrease on record, and the largest single-epoch drop since the China mining ban of July 2021.
Note: We exclude the 2013–2015 period from the modern ranking because it captures the step-change transition from GPU and FPGA mining to ASICs, a structural shift that produced extreme adjustments not analogous to the steady-state ASIC improvement era since 2016.
Then came the rebound. Just 12 days later, on February 19, a +14.73% upward adjustment brought network difficulty from 125.86T back up to 144.40T. That ranks as the 12th largest positive adjustment in the modern ASIC era. The five largest have all been driven by either the 2017 bull market hashrate surge or China ban recovery dynamics.
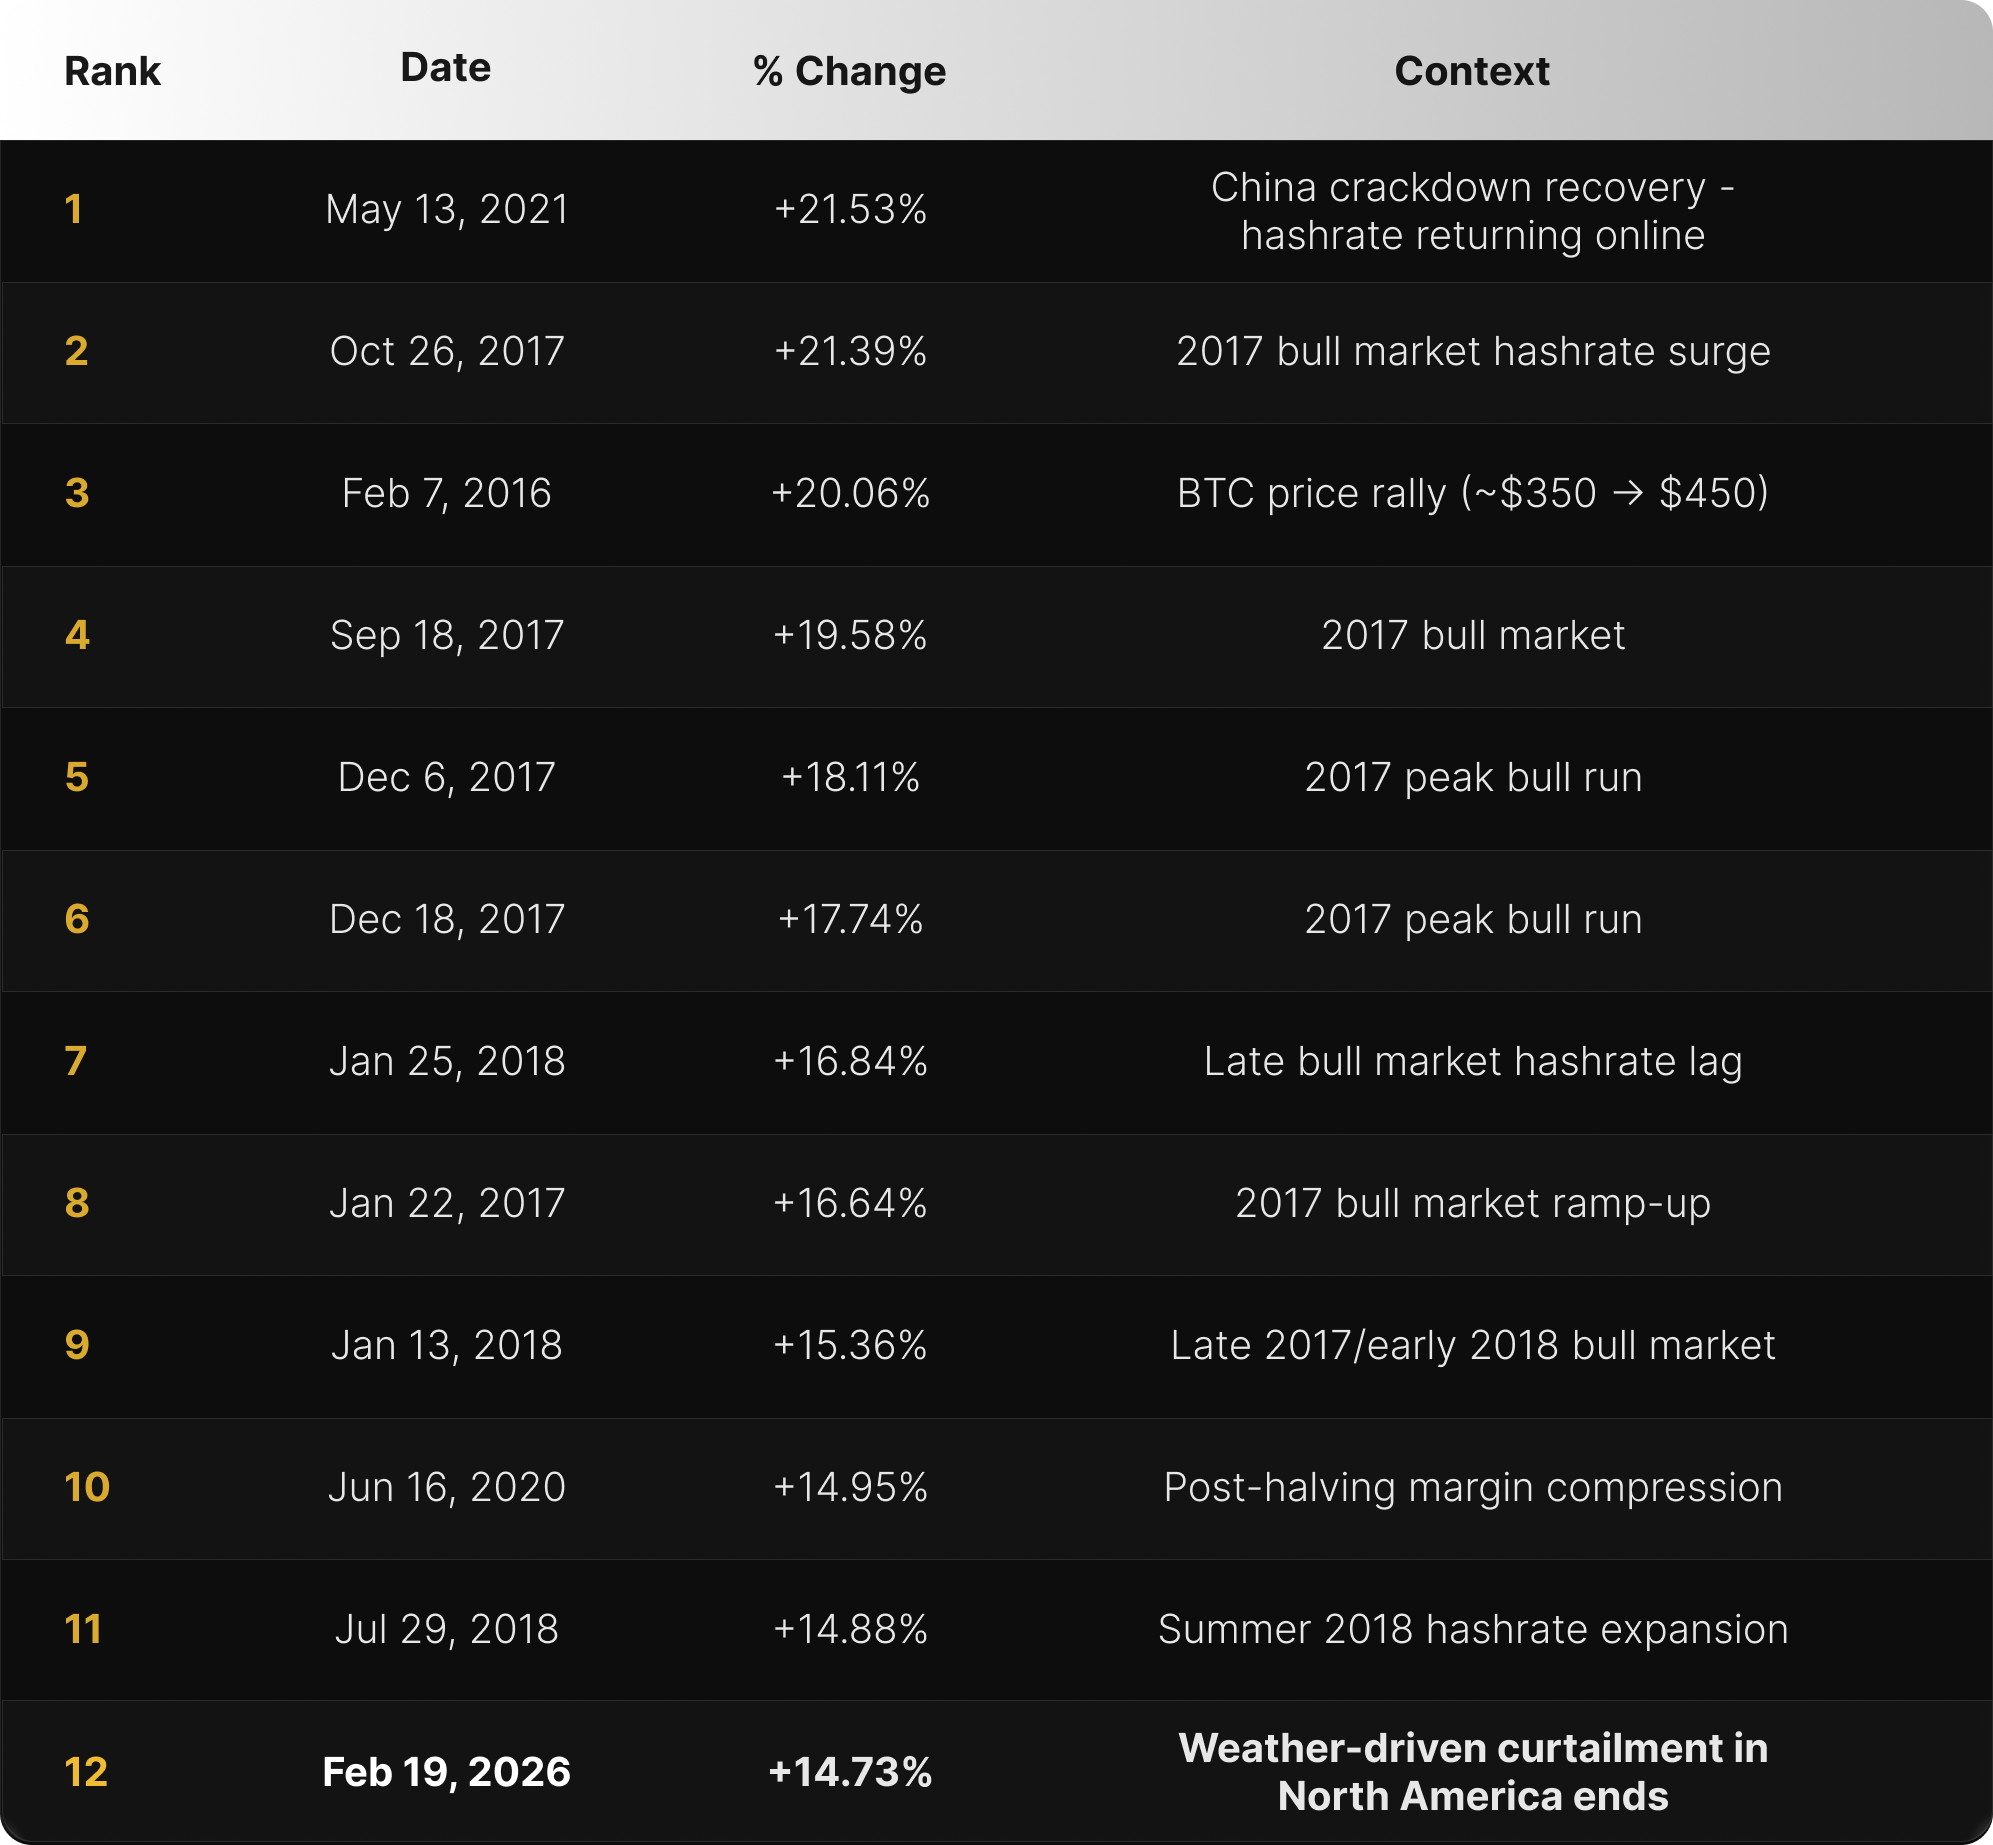
The combined -11.16% / +14.73% consecutive swing totals ~26 percentage points — the 4th largest two-epoch opposite-direction swing in the modern ASIC era. The three larger swings were all products of the China ban in May–July 2021. February 2026 is the most extreme difficulty whipsaw since that period.
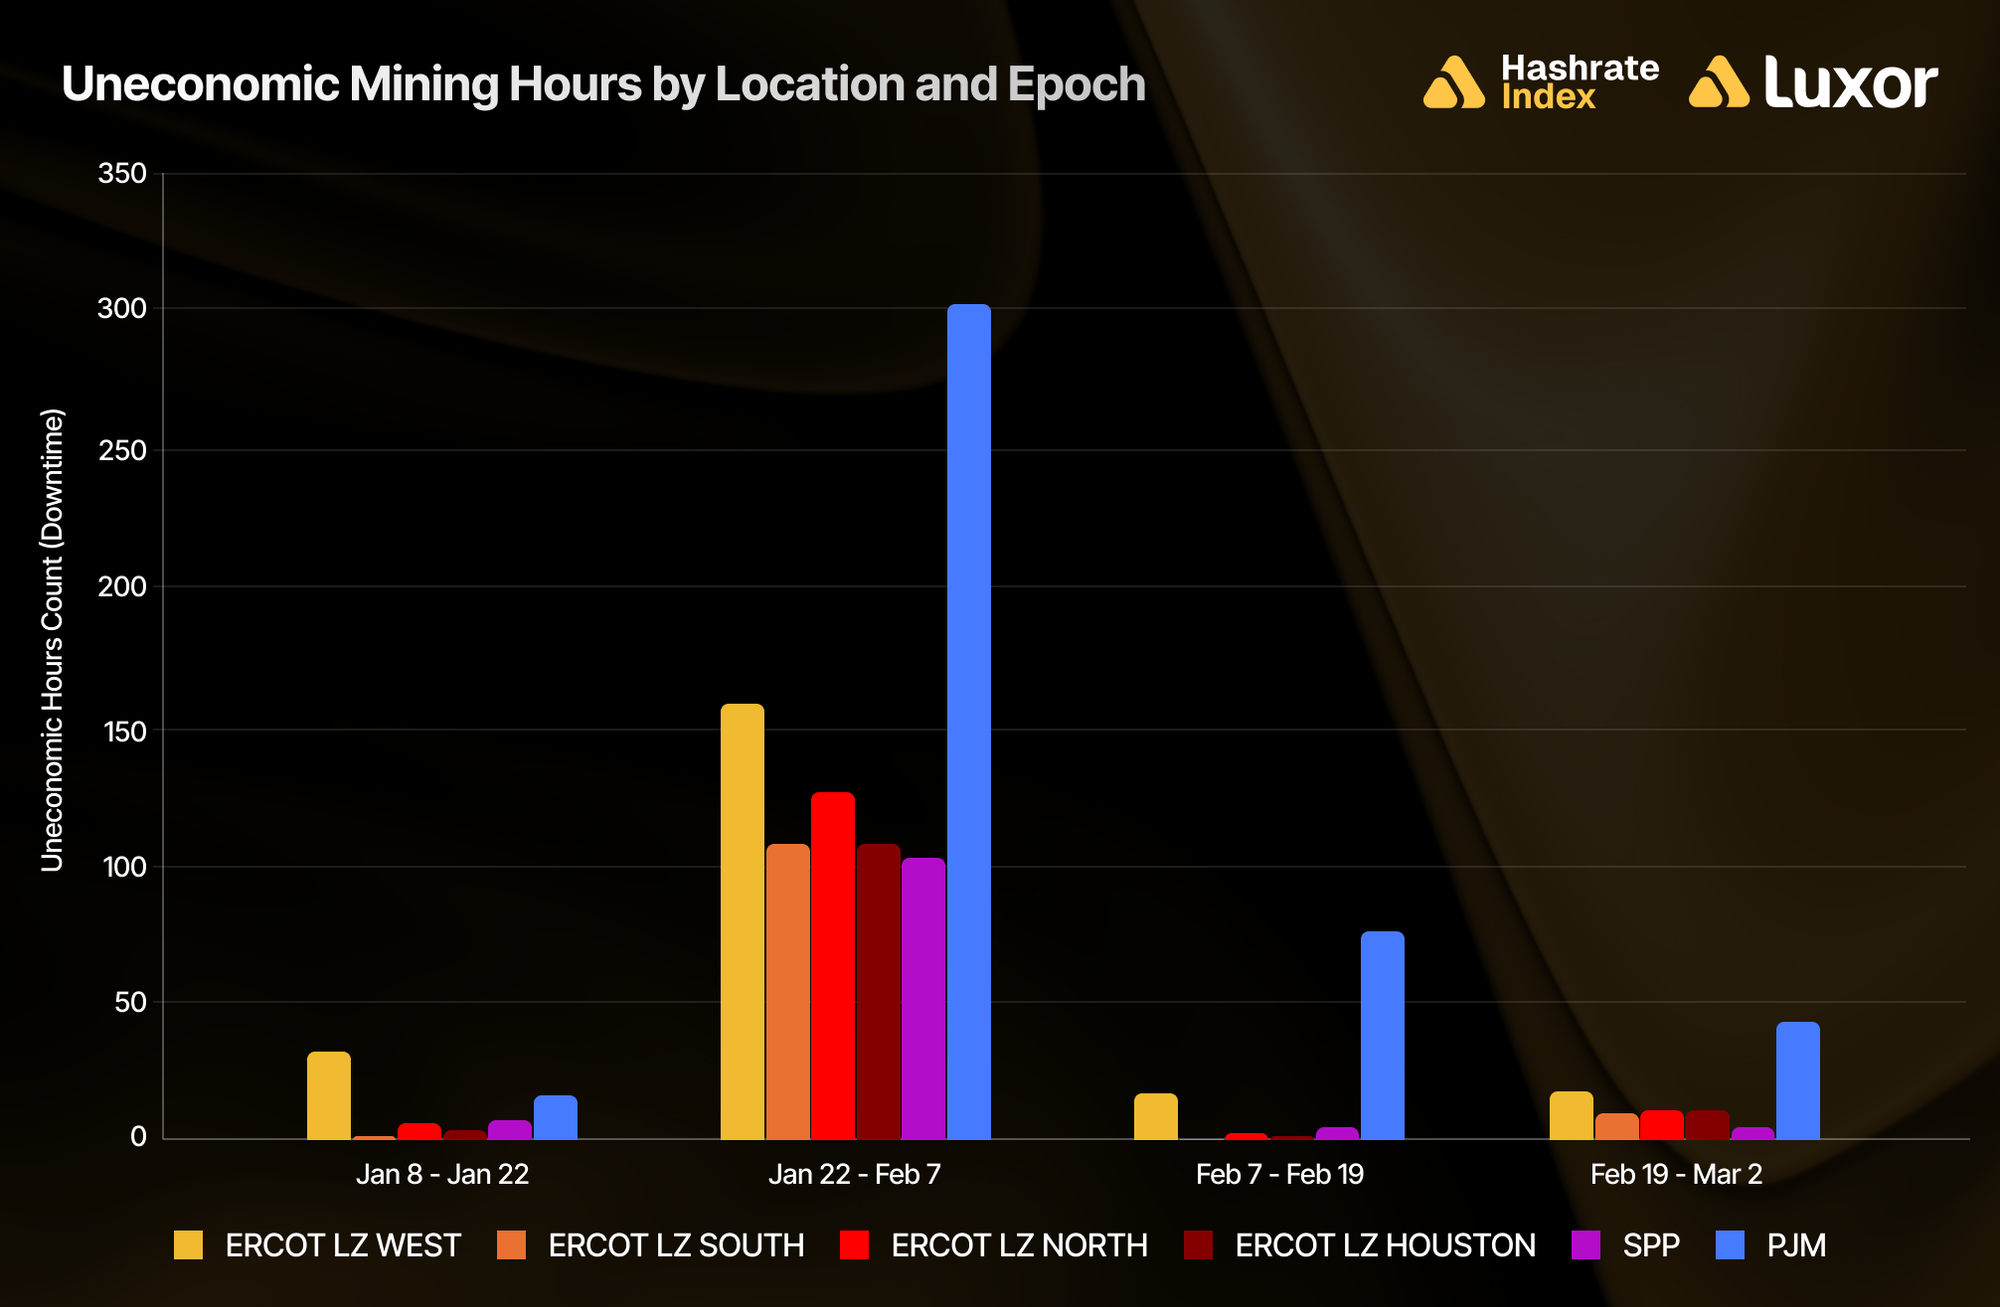
This was driven by an identifiable cause: weather in North America. Late January winter conditions across ERCOT and other power grids drove power prices above hashprice for miners in those regions, forcing curtailment. When temperatures normalized, that hashrate came back online. We estimate uneconomic hours in ERCOT and other grids fell by ~95% since the January 22–February 7 epoch, between February 7–February 19, coming back down to pre-storm levels.
Unlike the China ban (structural and geographic, hashrate physically relocated over months) or the 2018 bear market (prolonged capitulation over three months), the February 2026 whipsaw resolved in less than two weeks. This speed is clear evidence of curtailment, not permanent capacity loss.
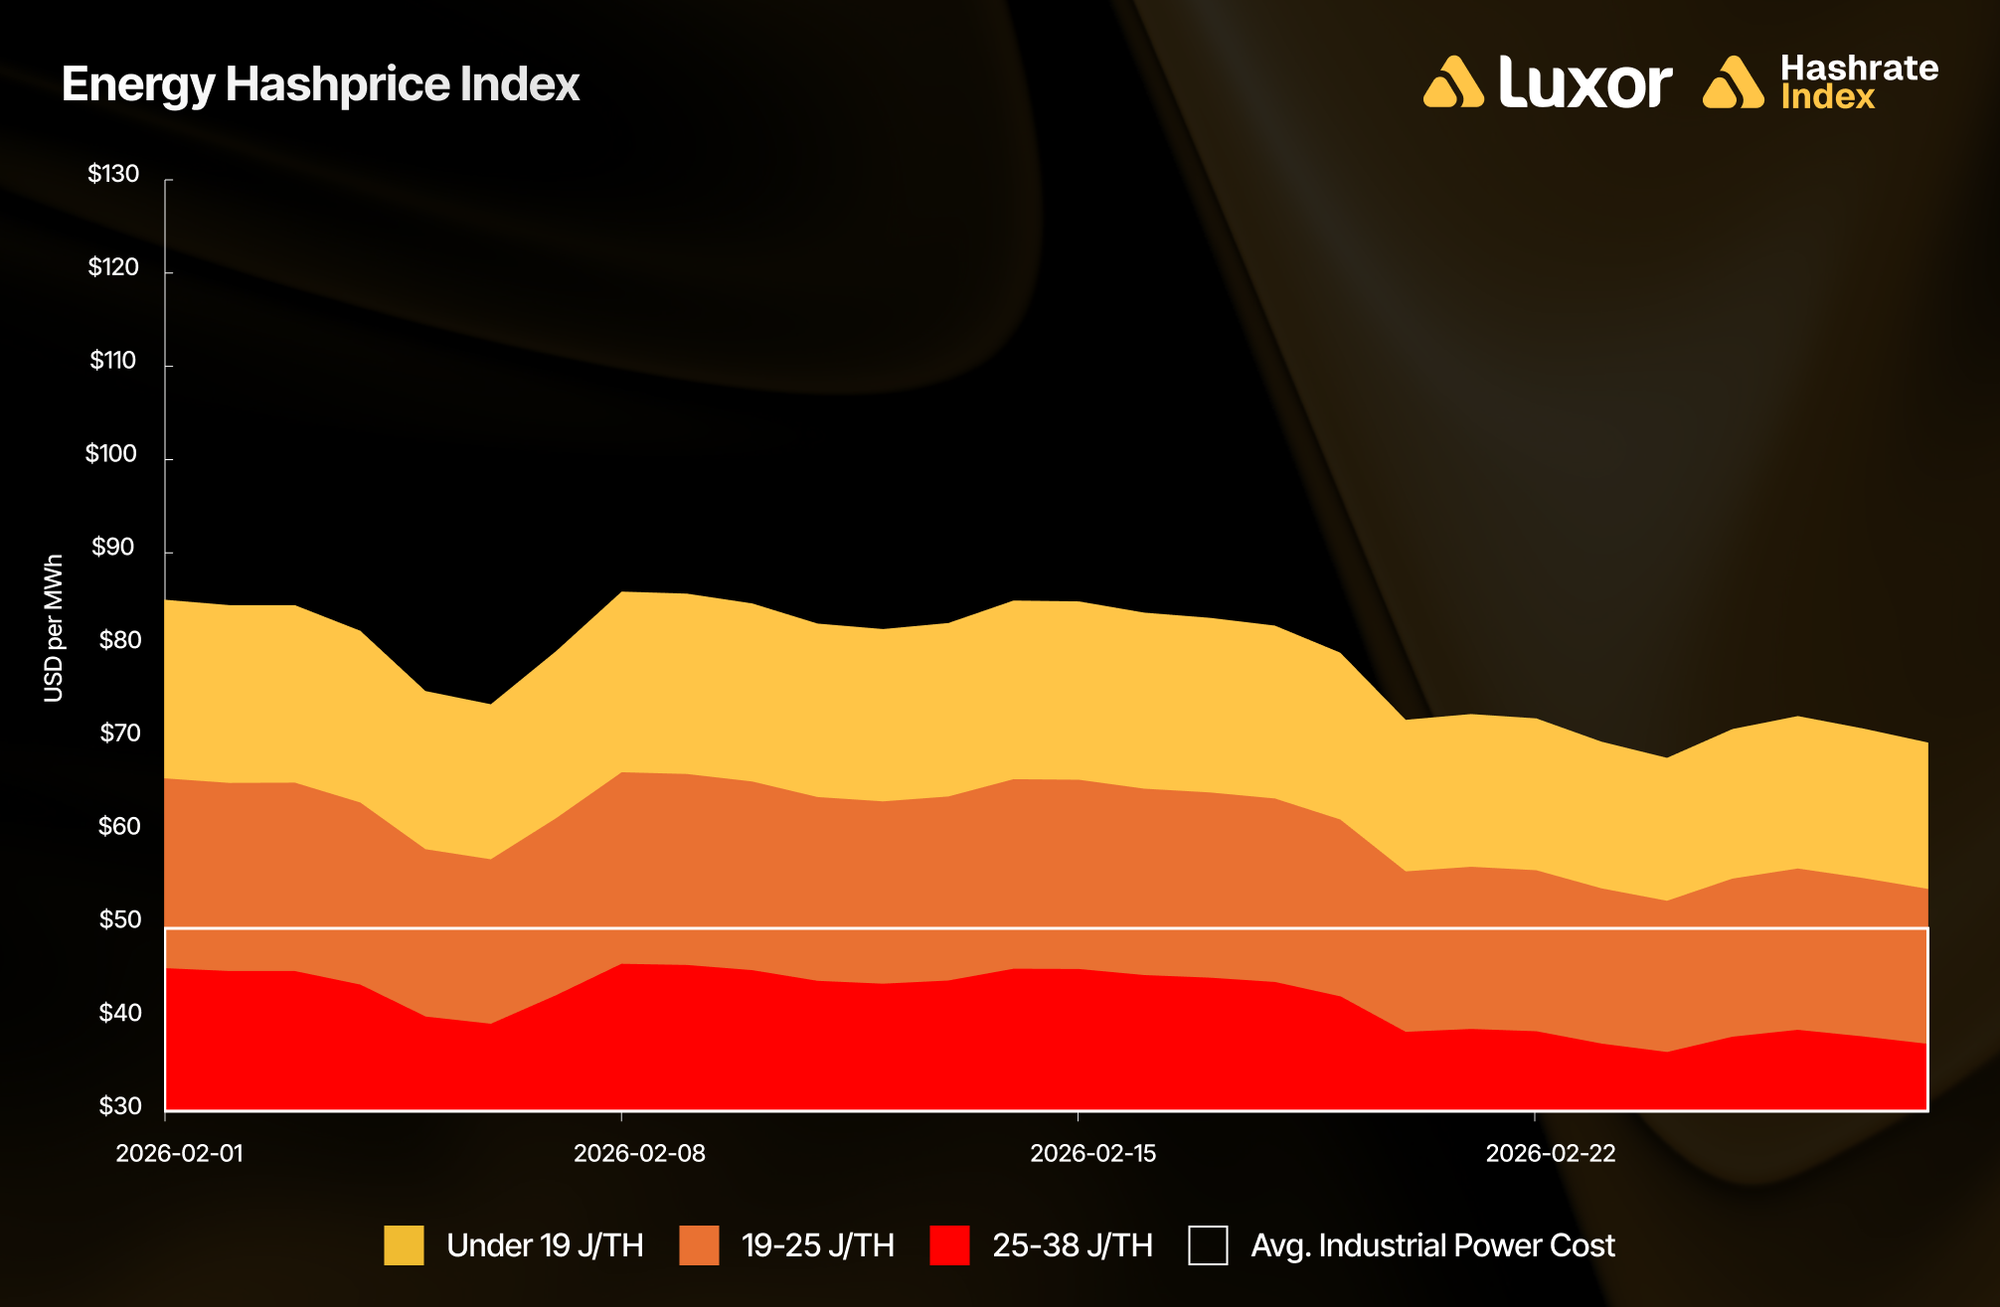
Beyond seasonal curtailment, bearish BTC price action continued to keep legacy hardware off the network as gross margins were in negative territory. In February, implied mining revenue per unit of electricity consumed was approximately $79/MWh for fleets running under 19 J/TH, $61/MWh for 19–25 J/TH fleets, and $42/MWh for 25–38 J/TH fleets. At an estimated network-average power cost of $50/MWh, S19 series and equivalent machines saw negative gross margins every day of the month. Without a meaningful BTC price recovery, this subset of marginal hashrate faces forced shutdown.
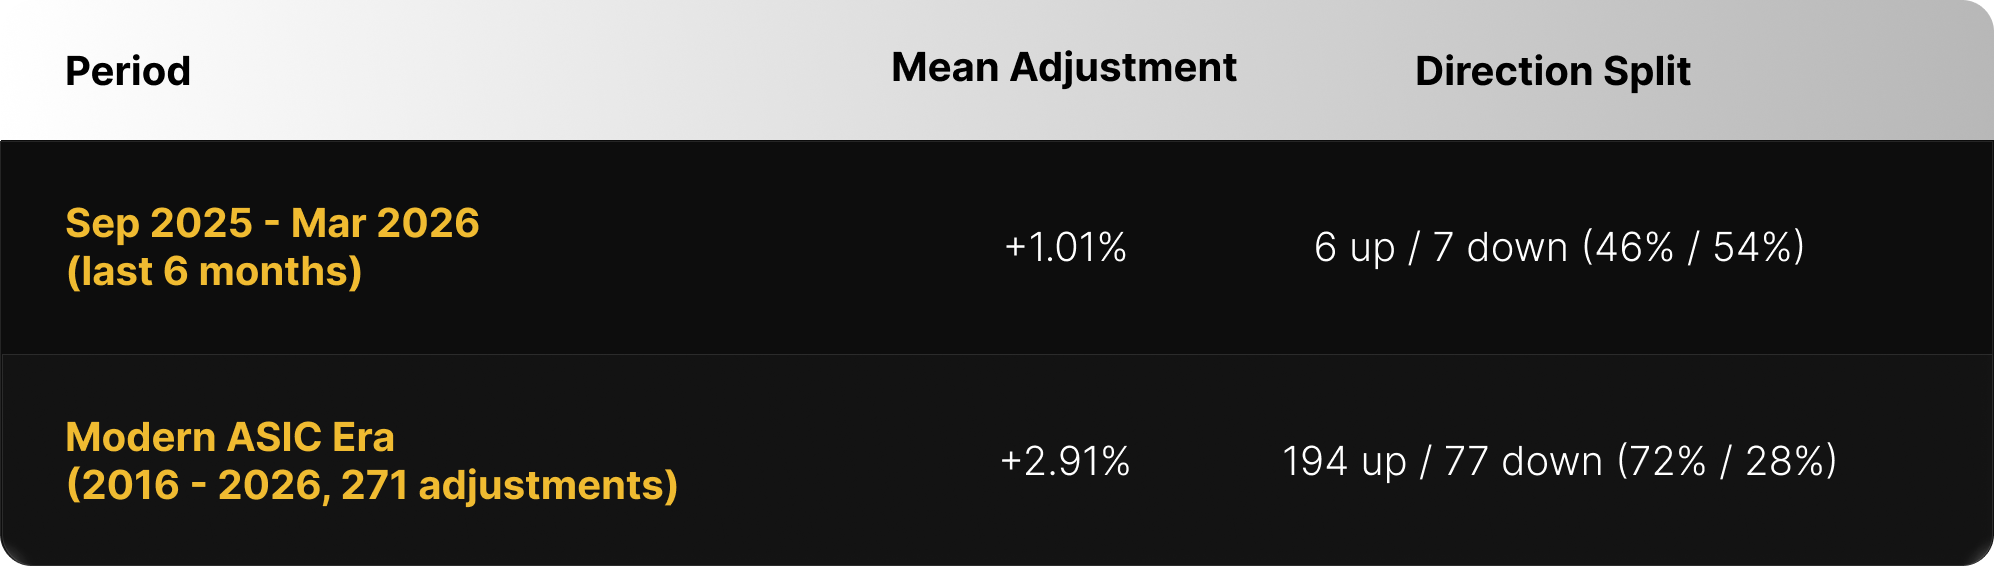
Zooming out to the last six months, Bitcoin's difficulty growth has effectively stalled. Difficulty declined in 7 of the last 9 epochs since mid-October 2025 — a pattern of sustained downward pressure without precedent in the modern mining era outside the China ban.
The table below reveals the divergence from historical norms. Over the past six months, the mean adjustment was just +1.01% — against a modern ASIC era mean of +2.91%. More striking is the direction split: 54% of adjustments over this period were negative, compared to just 28% historically across the 2016+ era. A six-month period where downward adjustments outnumber upward ones reflects a sustained contraction in active hashrate.
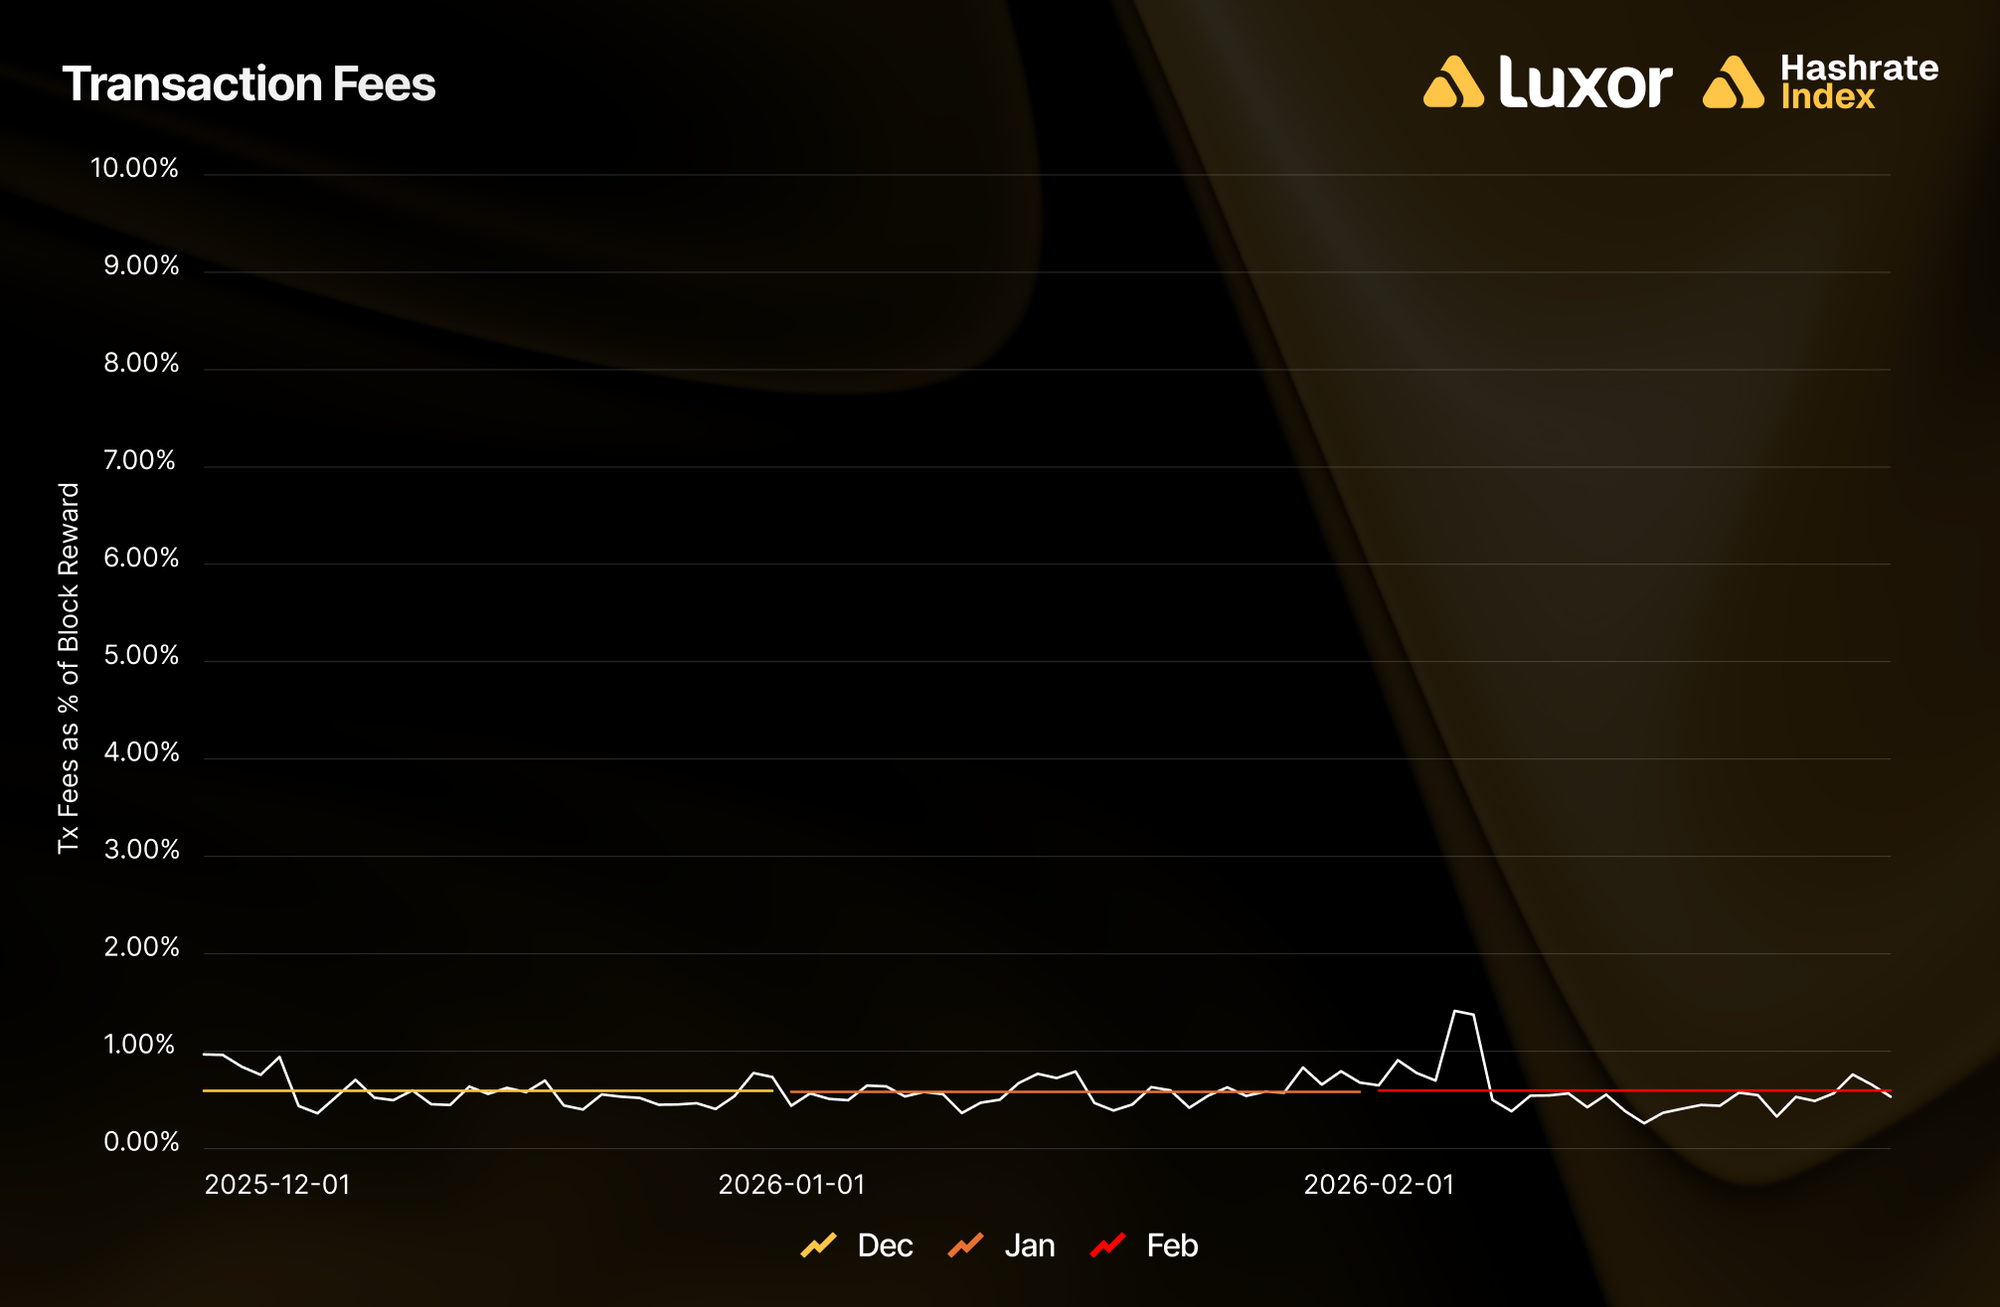
Transaction Fees — Marginal Relief
Average fee collection rose 1.9% to 0.019 BTC per block in February, the first increase since September 2025. In USD terms, however, average fee revenue per block fell 22.0% from $1,733 to $1,352, dragged down by BTC price. Fees accounted for 0.62% of total block rewards.
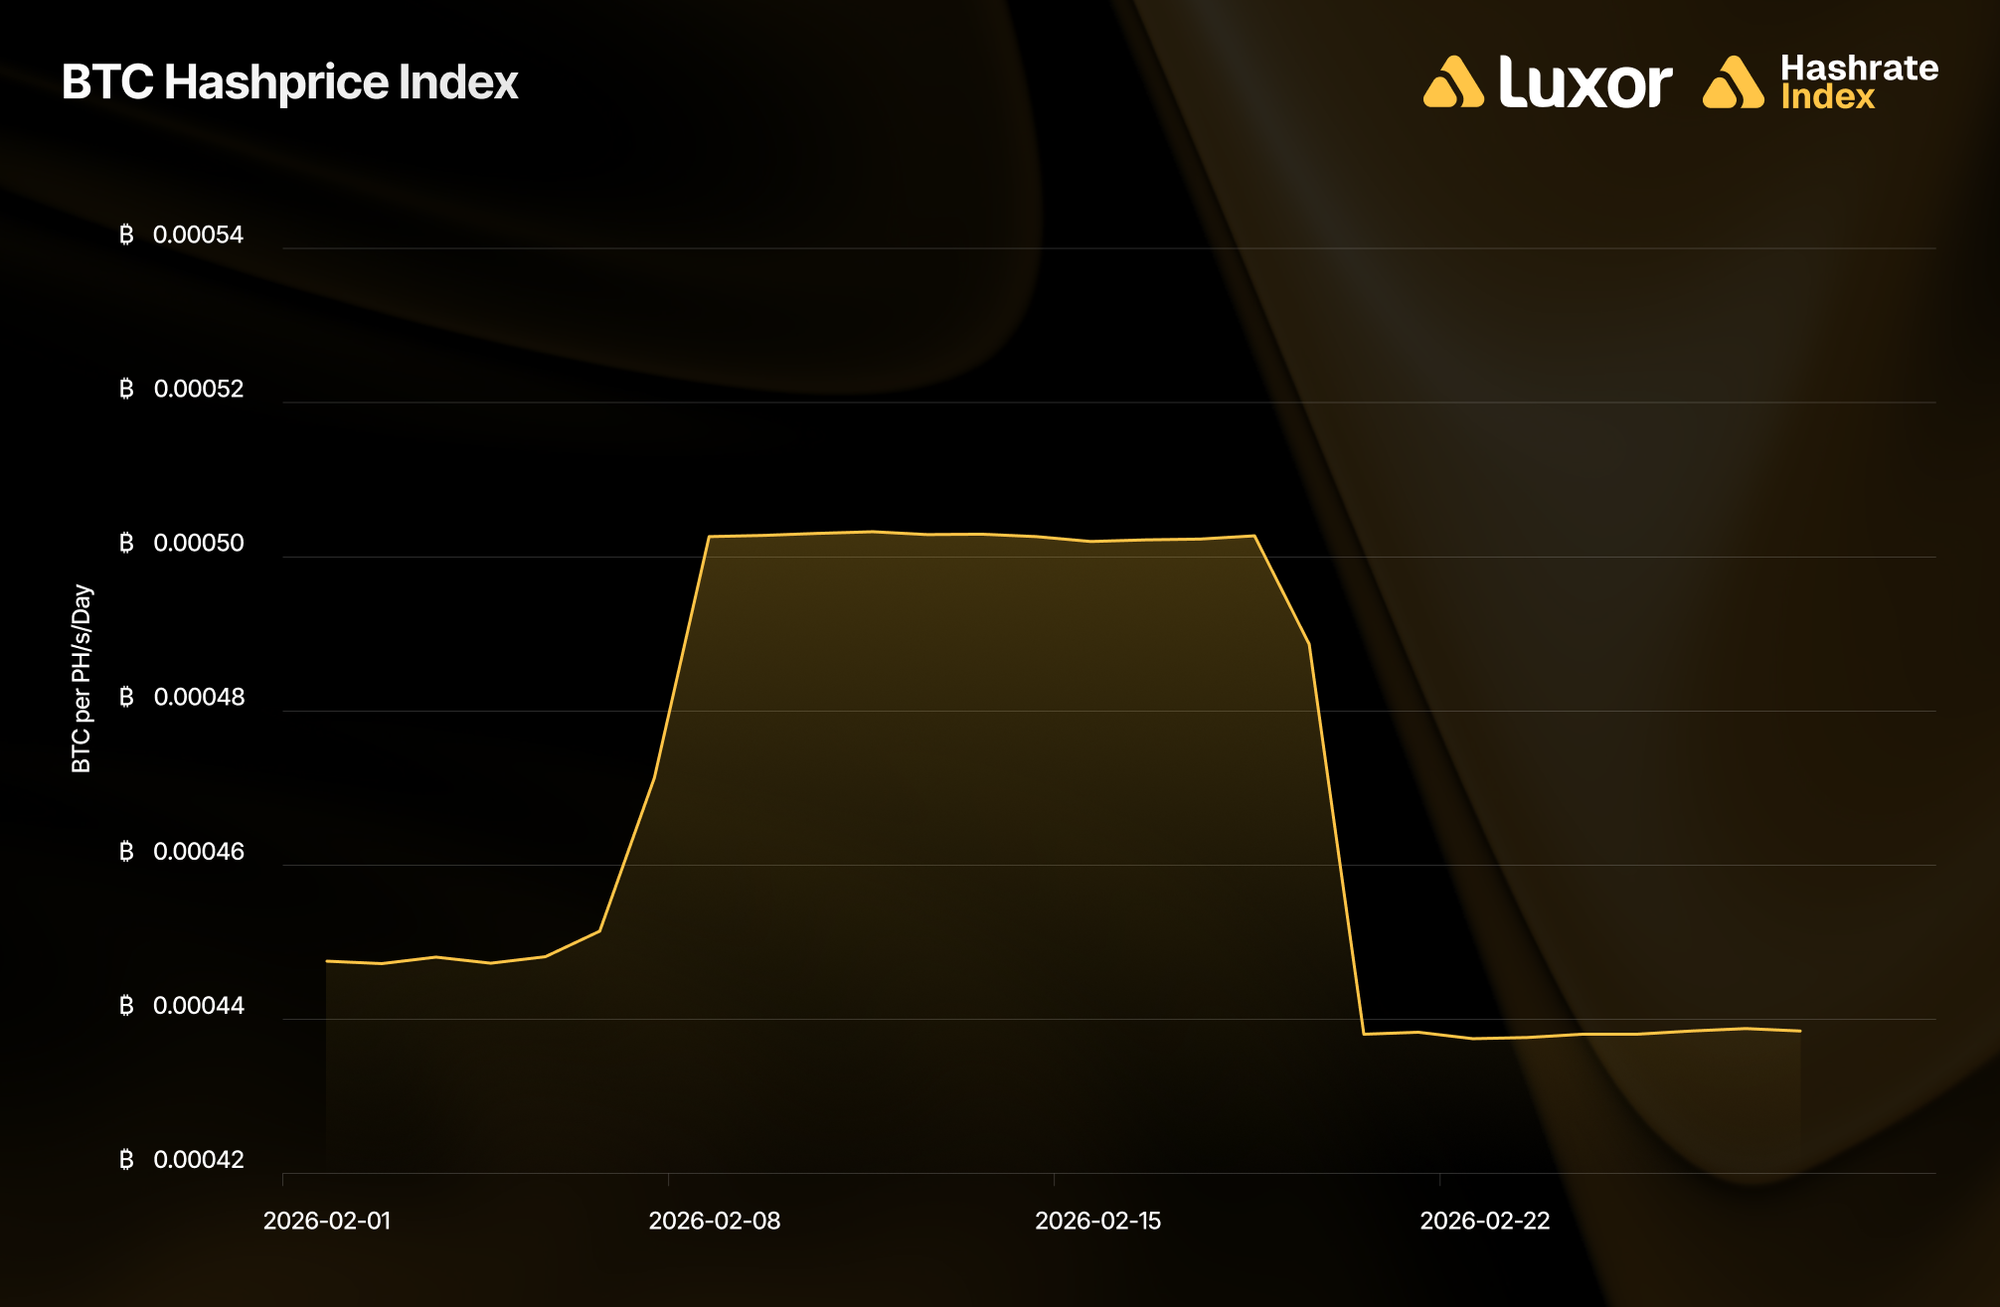
BTC Hashprice — Inverse Relief
BTC hashprice moved inversely to difficulty throughout the month, as expected. It opened at 0.00045 BTC per PH/s/day, rose during the first half as the -11.16% adjustment took effect, then declined in the second half as the +14.73% reversal compressed BTC-denominated rewards.
Monthly average BTC hashprice rose 7.6% to 0.00047 BTC per PH/s/day — the one bright spot for miners.
February 2026 Hashrate Market Activity
Our analysis of the February 2026 hashrate market focuses on two key points: how the February 2026 hashrate contract traded in previous months and how the forward curve shifted in February, based on pricing for forward hashrate during the month.
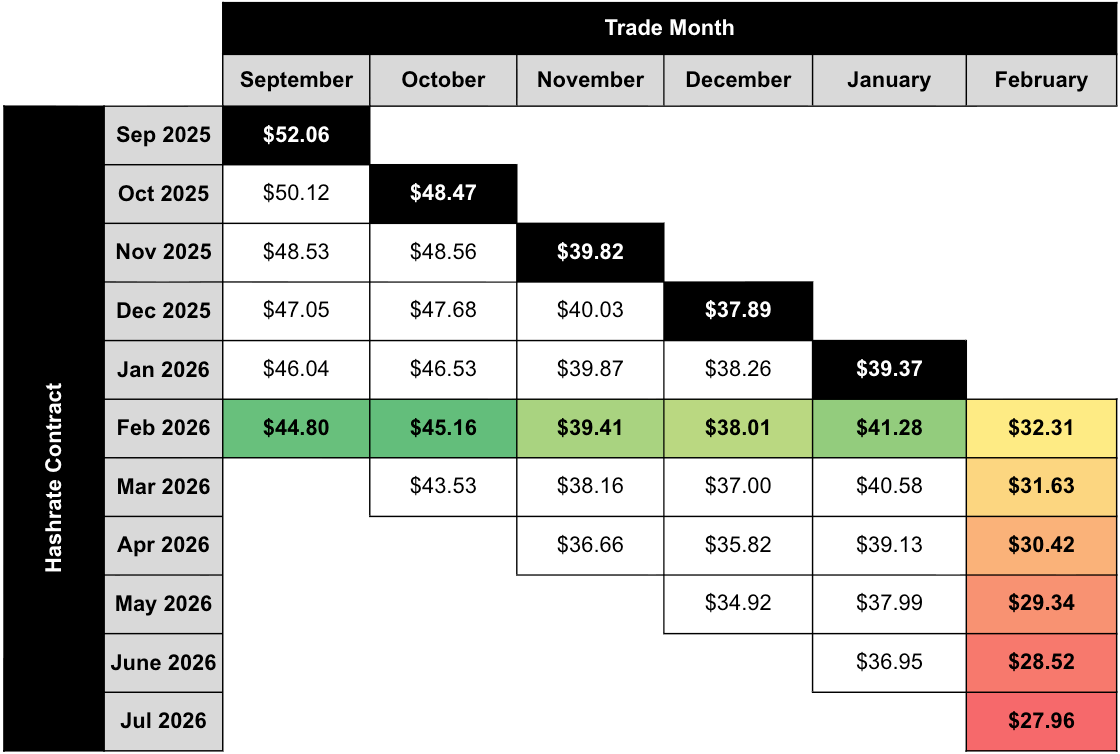
The two tables below show the evolution of Luxor’s USD and BTC-denominated hashrate forward markets from September 2025–February 2026. Rows represent specific monthly contracts, while columns represent each trading month. Cell values indicate the average monthly mid-market hashprice — except for the bold highlighted main diagonal — which shows actual spot hashprice settlement in each month.
This table summarizes both the trading history of the February 2026 USD-denominated contract (colored row) and the forward curve in February (colored column).
This table summarizes both the trading history of the February 2026 BTC-denominated contract (colored row) and the forward curve in February (colored column).
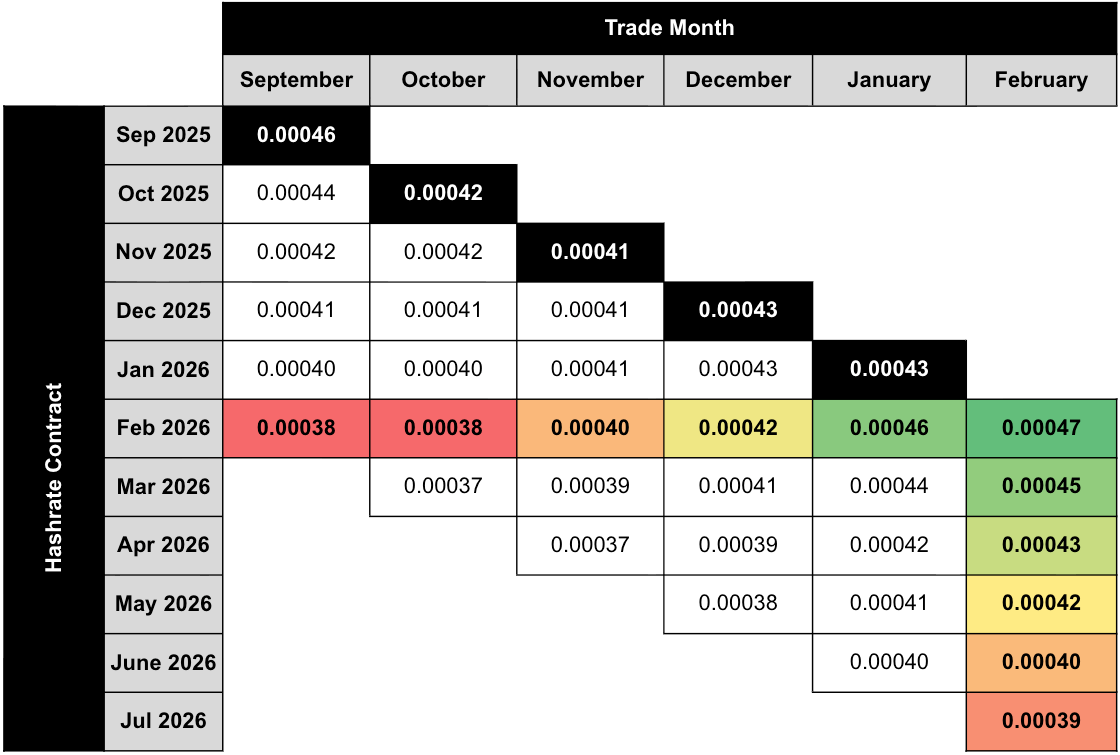
Note: all values (except for the bold highlighted main diagonal) shown in figures represent mid-market rates, the midpoint of the best bid and ask on Luxor's Non-Deliverable Hashrate Forward market. The bold highlighted main diagonal shows actual spot hashprice settlement in each month, measured by Luxor’s Bitcoin Hashprice Index.
The table below shows the type of market participants on the buy and sell side of Luxor’s deliverable (DF) and non-deliverable hashrate forward (NDF) market. In February, lenders were active on the buy side of the DF market, while public and private miners used the contract to sell forward, receive financing, and expand their fleet.
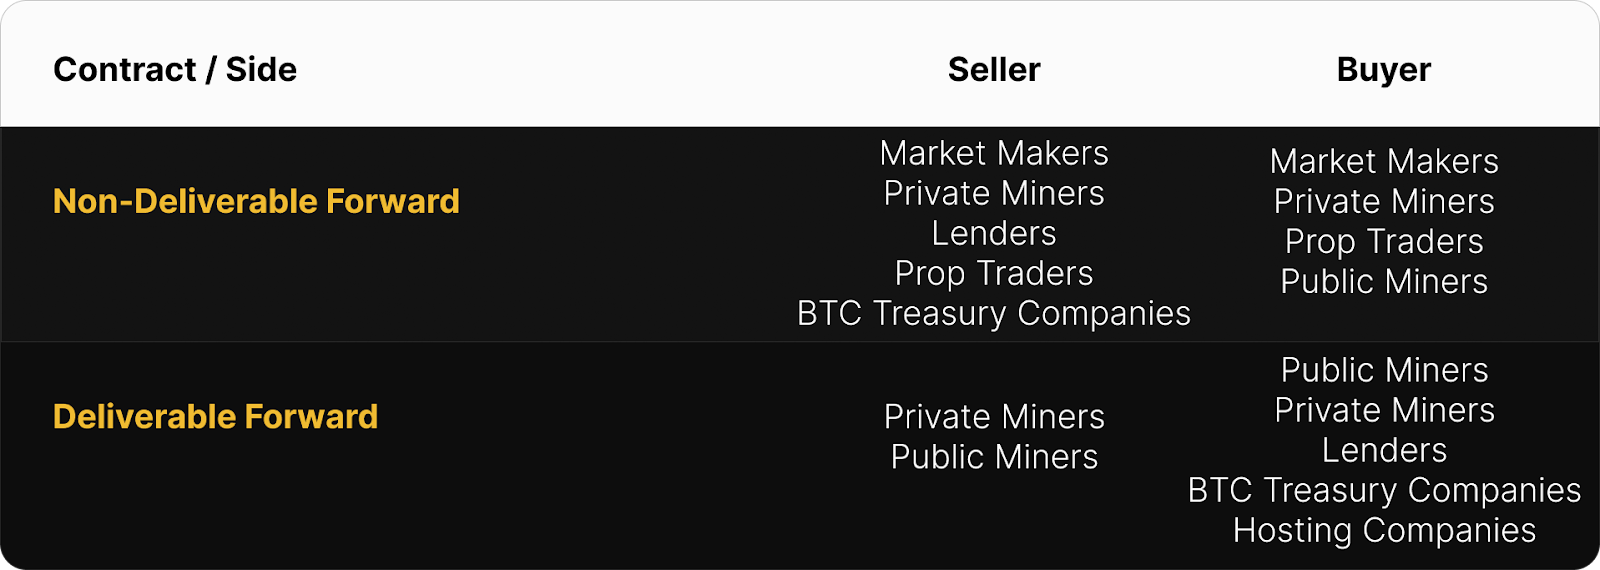
Since the DF involves upfront payment, it tends to trade at a discount to the NDF, compensating the buyer for the inherent credit risk. We interpret the discount of DFs relative to NDFs as the interest rate in hashrate-based lending markets. Buyers and sellers of the DF with upfront payment can use the NDF to lock-in a fixed yield (cost of capital) instead of having exposure to hashprice uncertainty.
This strategy was used by lenders and Bitcoin treasury companies (buy DF & sell NDF) to earn a BTC-denominated return and by miners (sell DF & buy NDF) to obtain non-dilutive financing. In February 2026, that yield (cost of capital) was 6–13% annualized.
How February 2026 Hashrate Traded
February delivered a clean "fiat fork" in hashrate hedging outcomes: sellers won in USD-denominated contracts whereas buyers won in BTC-denominated contracts. The divergence was driven by BTC price collapsing faster than difficulty fell — compressing USD hashprice beyond what forward markets had priced in, while BTC hashprice settled higher than expected as difficulty relief outpaced expectations.
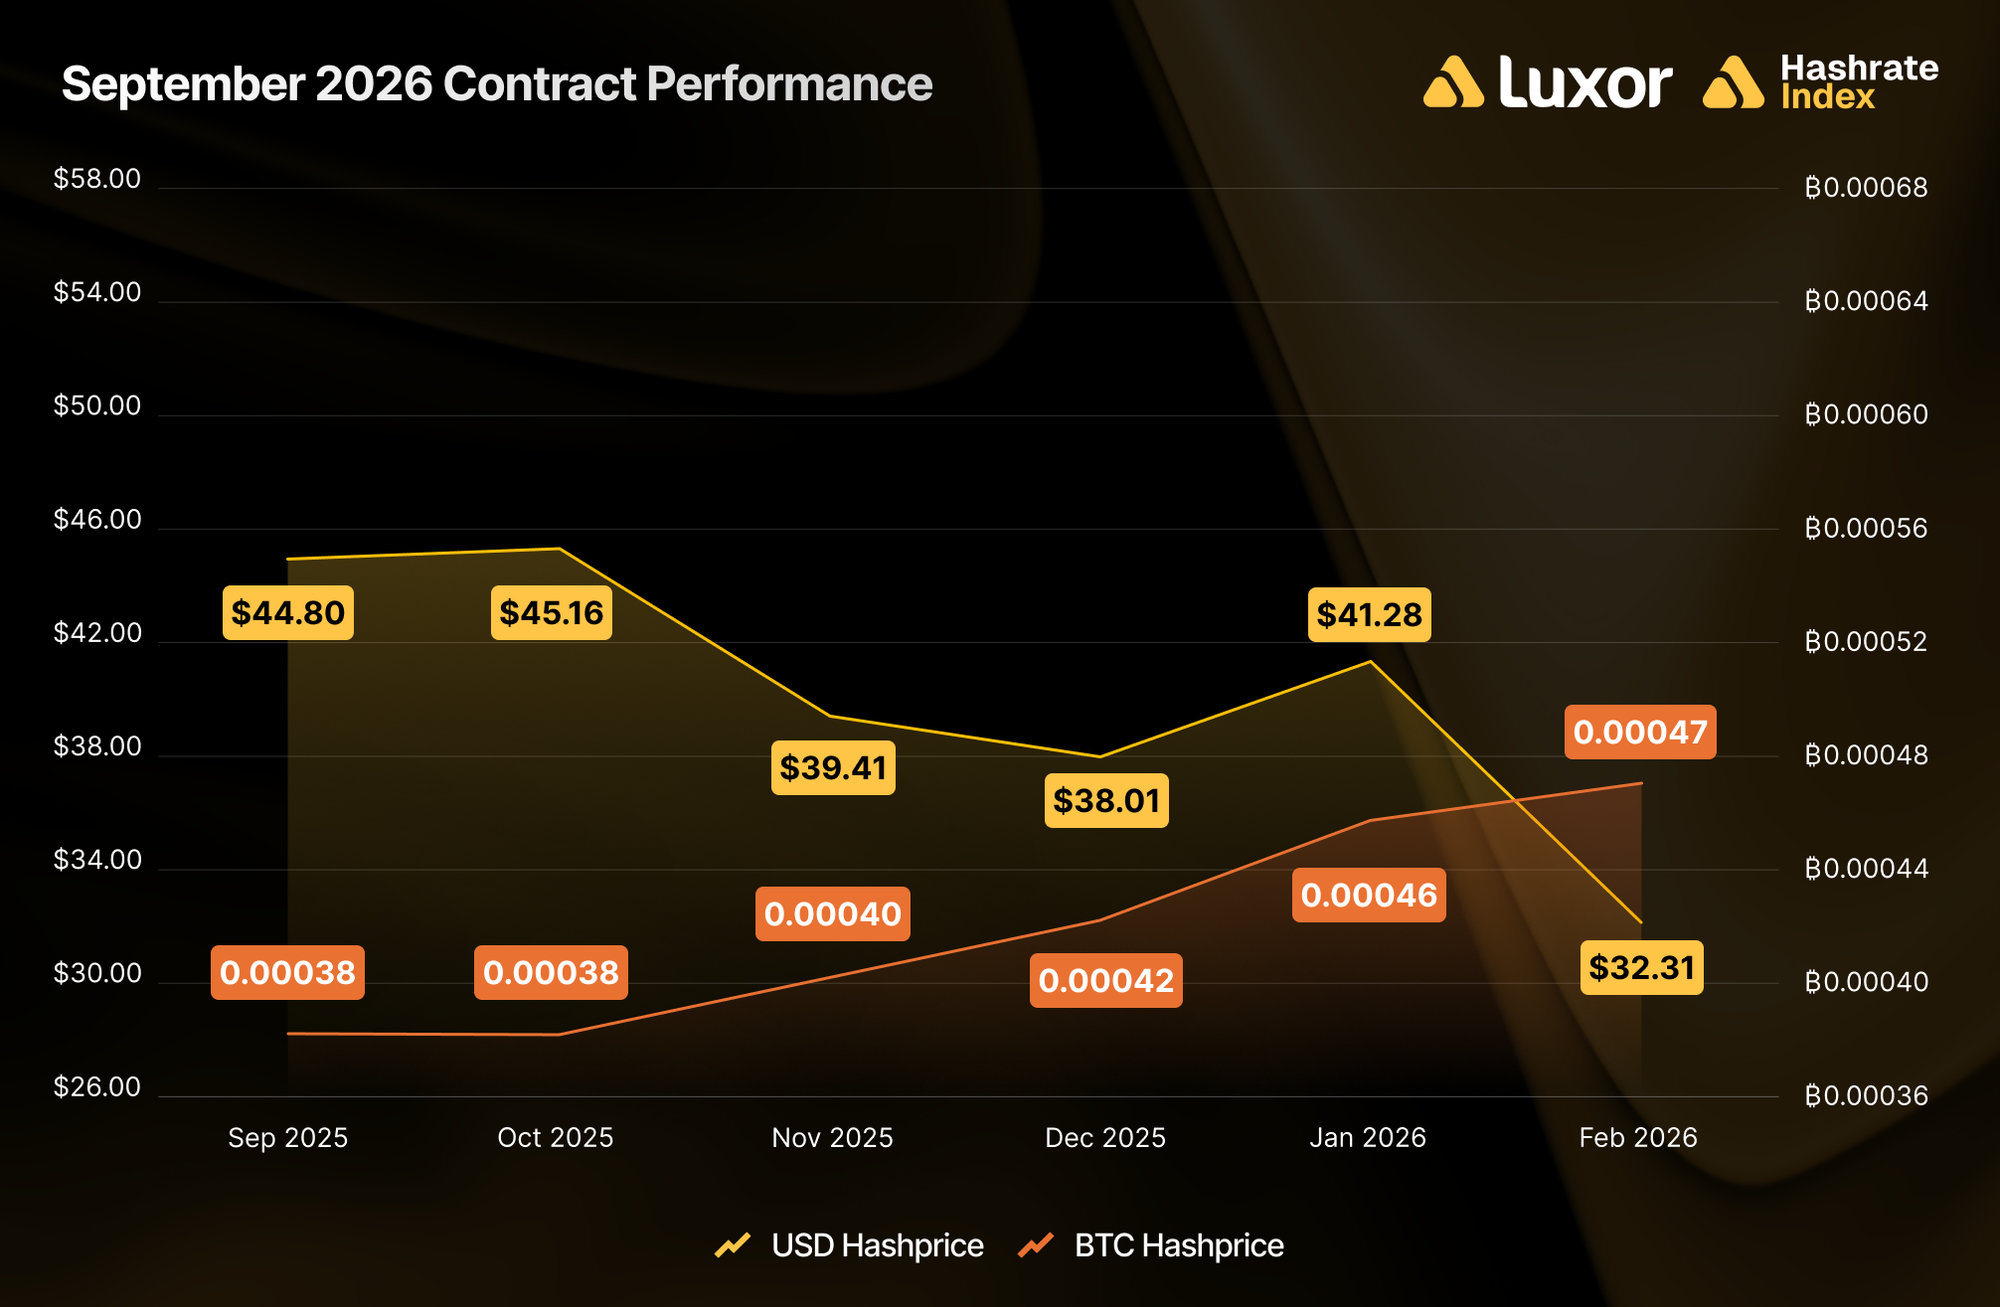
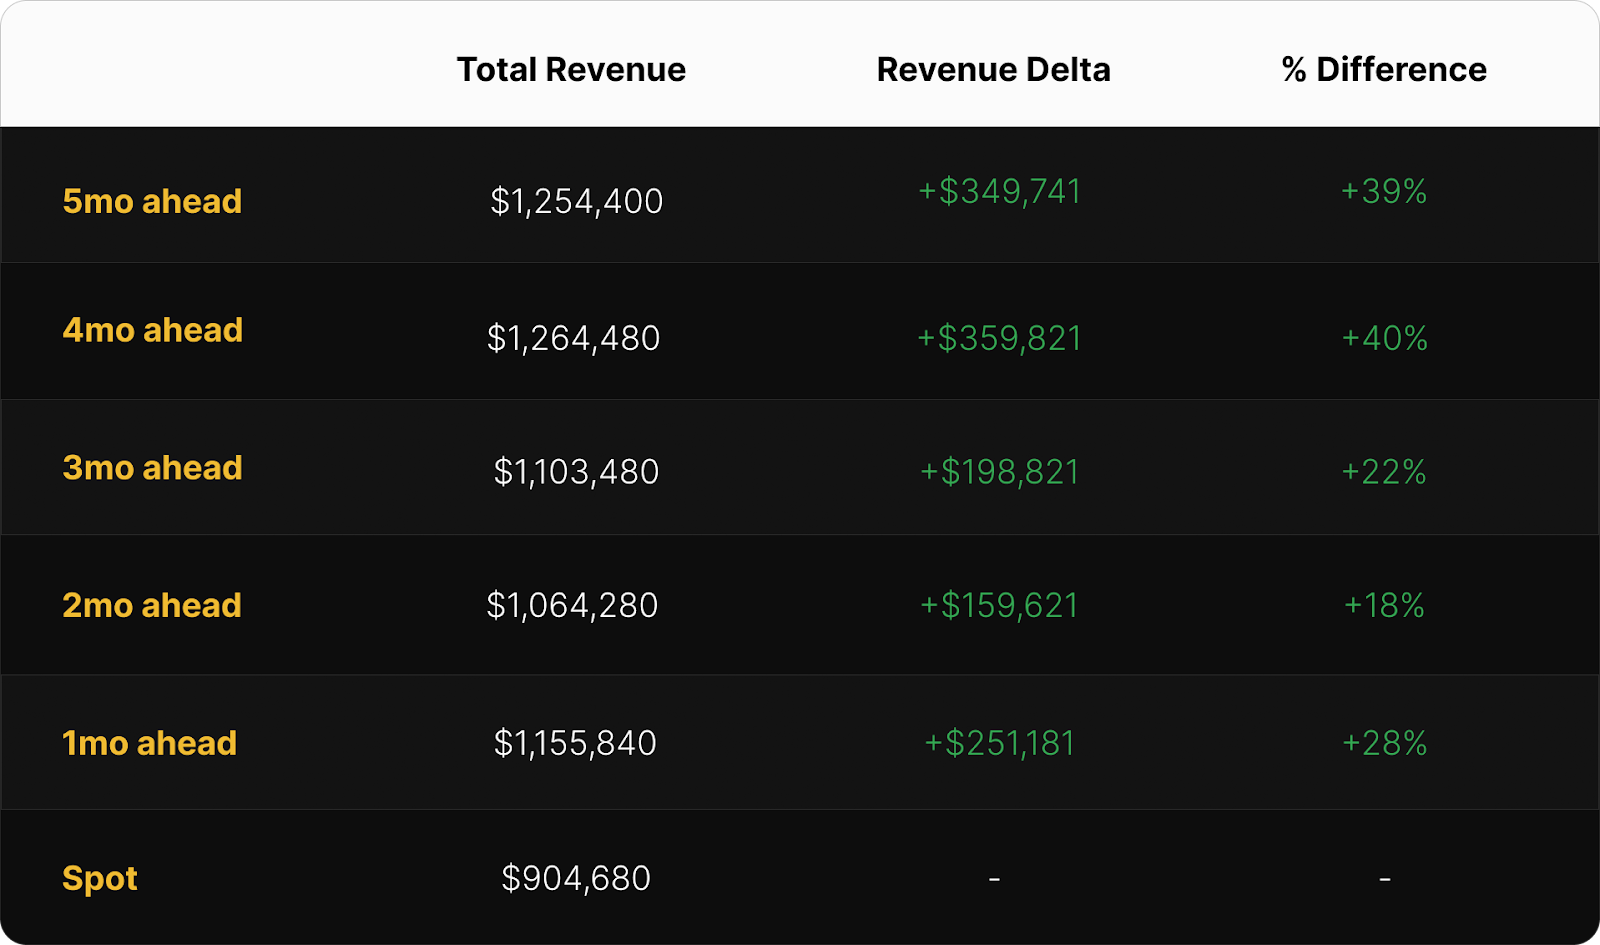
USD-denominated sellers outperformed spot (FPPS) mining across all intervals. Forward sellers locked in between $41.28–$44.80 per PH/s/day versus spot settlement at $32.31. Early hedgers in September–November captured gains of 22–40% over spot, while December hedgers locked in an 18% premium. The optimal USD hedge would have been a four-month forward sale in October 2025 at $45.16 per PH/s/day (+40% vs. spot).
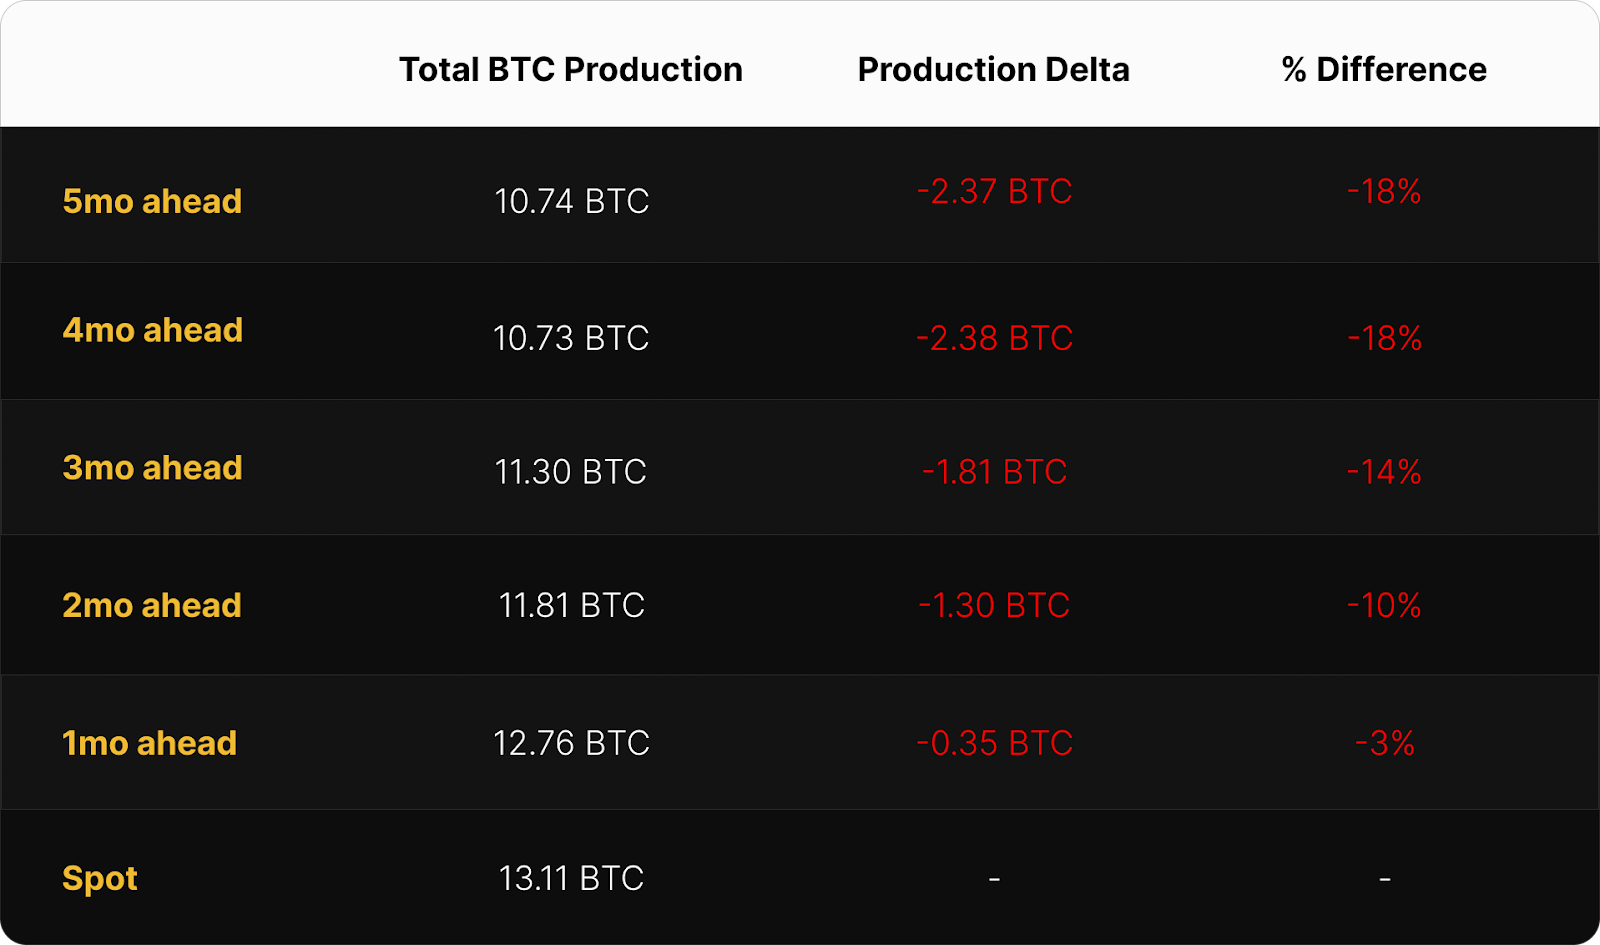
BTC-denominated buyers outperformed across the board. Miners who sold February hashrate forward earned between 3–18% less BTC than spot miners, as network difficulty growth slowed beyond expectations and BTC hashprice settled at 0.00047 — above all forward contract lock-in rates of 0.00038–0.00046 BTC per PH/s/day.
Zooming out, we examine rolling hedge performance across two windows: the trailing twelve months (March 2025–February 2026) and since the April 2024 halving.
Over the past year, rolling USD-denominated hedging strategies outperformed spot mining across the board. The strongest results came from 4-month (+8.2%) and 3-month (+7.8%) USD-denominated forward sales, which generally benefited from locking in a hashprice ahead of weak BTC price action, rising network difficulty, and low fee environments.
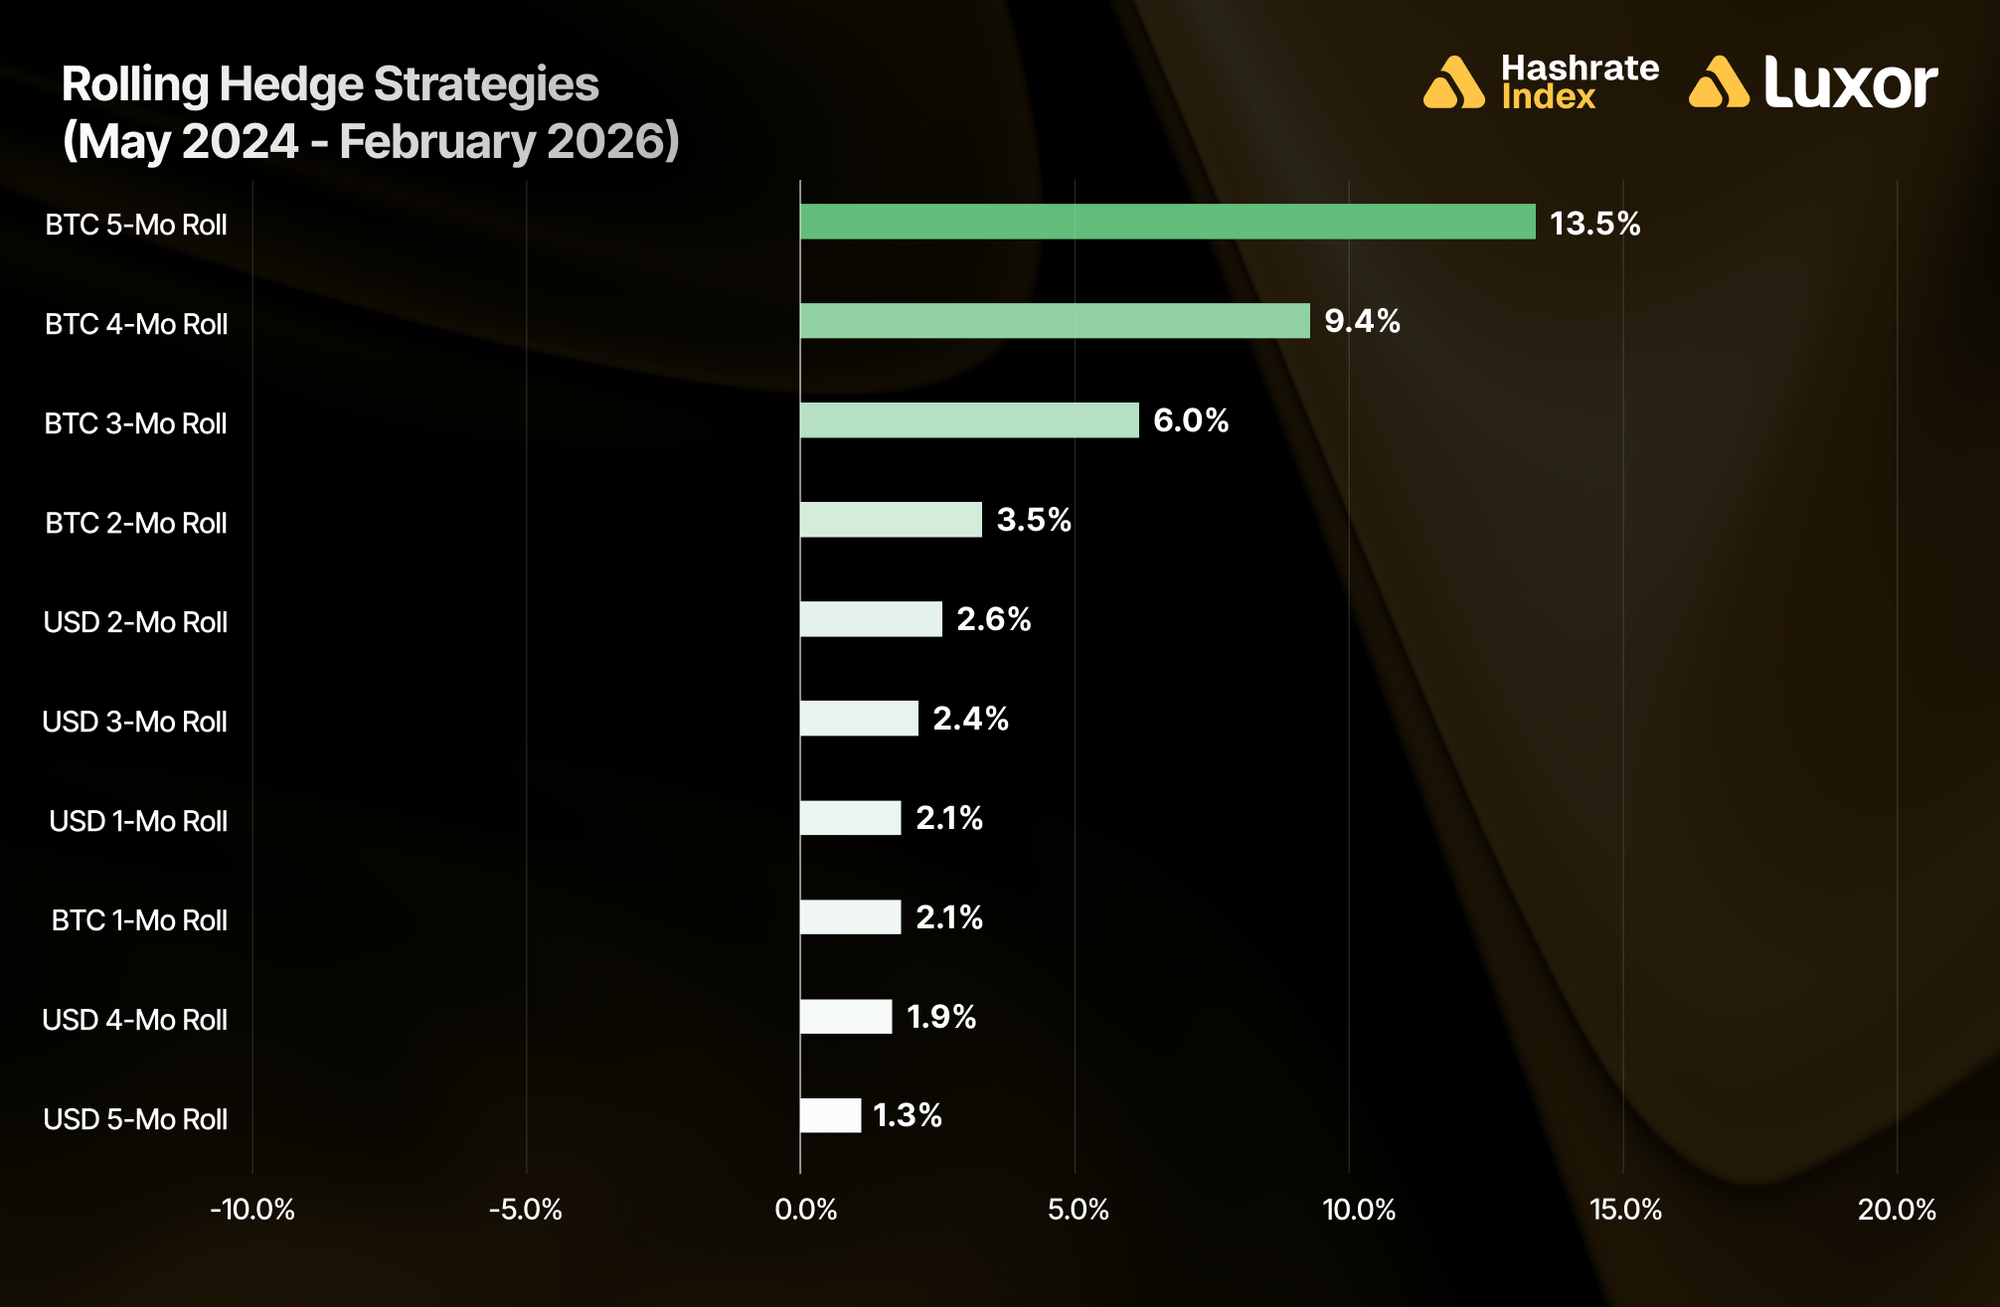
Extending the window back to the halving tells a different story. Over the full post-2024-halving period, BTC-denominated rolls dominated. The BTC 5-month roll led all strategies at +13.5% vs. spot, followed by BTC 4-month (+9.4%), BTC 3-month (+6.0%), and BTC 2-month (+3.5%). USD strategies still outperformed spot but clustered at the bottom: USD 2-month (+2.6%), USD 3-month (+2.4%), USD 1-month (+2.1%), USD 4-month (+1.9%), and USD 5-month (+1.3%).
The contrast between the two windows is instructive. Over the trailing 12 months, USD-denominated strategies led because BTC price fell faster than difficulty, compressing USD hashprice more than the forward market had priced in. Over the full post-halving period, BTC-denominated strategies led because difficulty expansion beyond expectations rewarded miners who locked in a BTC hashprice ahead of rising network difficulty.
Note: two important caveats apply to both windows. First, figures exclude fees and bid/ask spreads. Second, hedging is a cost of business rather than a revenue generation strategy. Hedgers willingly buy certainty for predictable cash flows, which increases valuations, reduces capital costs, and ultimately attracts investments.
How Future Hashrate Traded in February 2026
The two tables below summarize the evolution of hashrate forward markets during February 2026, for the subsequent five months from March 2026–July 2026. Rows represent specific monthly hashrate contracts, while columns represent specific trading days. Cell values indicate the average daily mid-market price, except for spot prices.
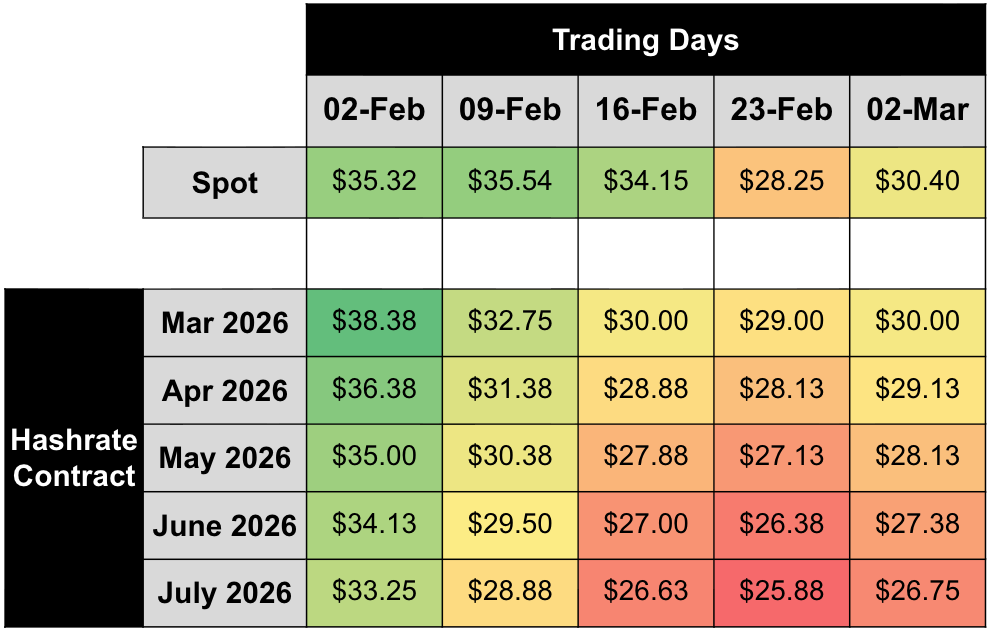
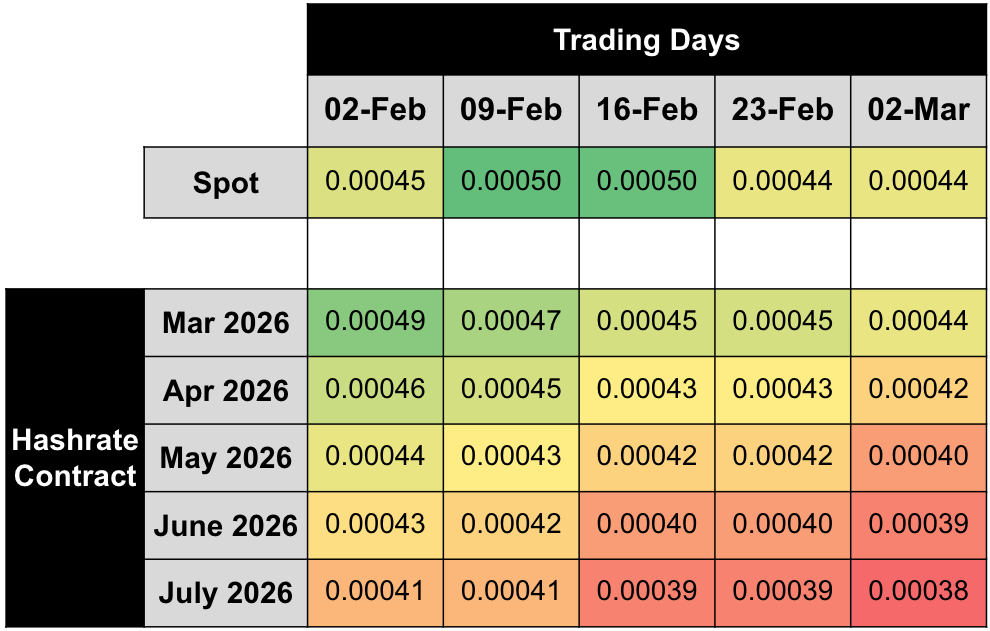
In February, mid-market rates for March–July 2026 USD contracts fell ~20%, while BTC contracts fell ~7%. Both curves generally traded in backwardation. The forward market is pricing a return to difficulty growth, with medium-term hashprice expectations remaining below spot.
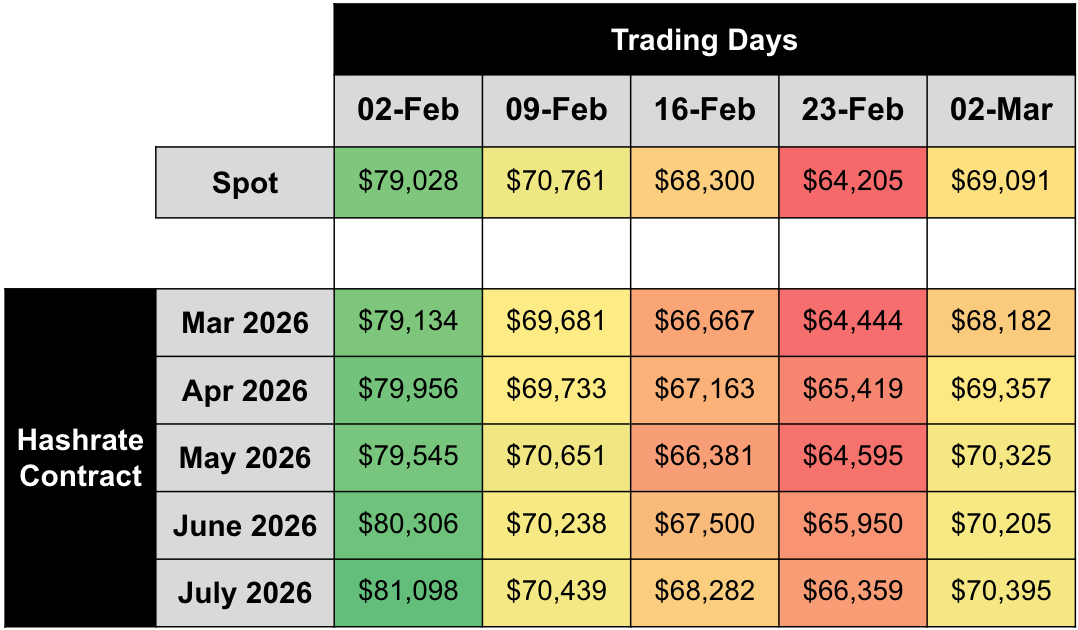
Dividing USD contract values by BTC contract values extracts the implied BTC price expectations embedded in the forward hashrate market. Throughout February, implied BTC price expectations fell ~12% on average and mostly traded in a slight contango.
Assuming 0.019 BTC per block in transaction fees, we can also back out implied difficulty and hashrate expectations:
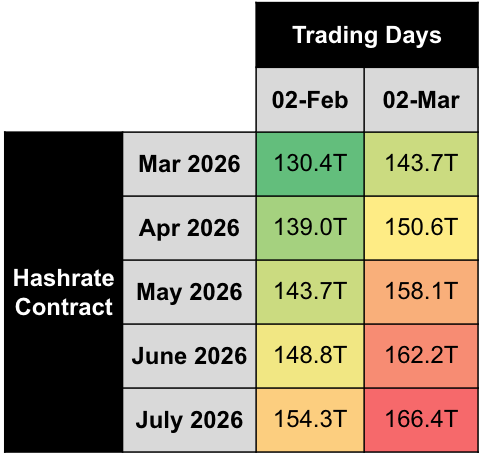
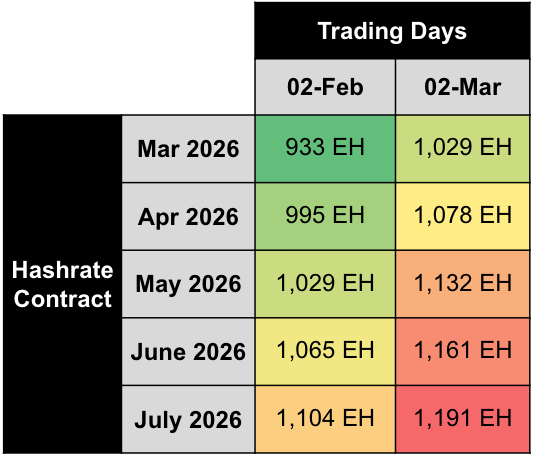
Note: figures assume 0.019 BTC per block transaction fee collection on February 2 and March 2, 2026.
Based on this analysis, the forward market priced in an average ~10% increase in difficulty and hashrate expectations for the March–July 2026 period during February 2026. This upward revision reflects the market updating its understanding of what caused the -11.6% difficulty drop. On February 2, the cause was ambiguous: BTC price had crashed, and the market assigned meaningful probability to that decline permanently shutting down marginal hardware. By March 2, the +14.73% difficulty rebound had revealed that the drop was almost entirely temporary weather-driven curtailment, not structural capacity loss. The forward market corrected accordingly, unwinding the permanent-shutdown premium it had embedded in early-February pricing. The forward curve is now pricing modest hashrate growth through mid-2026.
Concluding Thoughts and Looking Ahead
Will More Hashrate Come Offline?
Most legacy hardware isn't online and bleeding — it's already off.
Hashrate Index’s latest mining economics projections estimates total net ASIC capacity at 1,292 EH as of February: the sum of all machines that have been manufactured and haven't yet mechanically failed, modeled using a Weibull failure distribution. This is not only installed, operating hashrate. It includes machines that are already powered down, in storage, awaiting deployment, or retired from active mining.
Active network hashrate stood at ~1,040 EH/s as of early March — a gap of ~252 EH versus total net capacity. That gap accounts for machines that are not economically viable at current hashprice, curtailed due to power market conditions, in transit, or under maintenance.
The key point: legacy hardware represents a small and shrinking fraction of the supply curve. Per our Q1-2026 mining economics projections, most of this hardware has already retired from the network as hashprice declined through 2025. The machines now sitting at the margin are ~29 J/TH and higher power-cost operations with ~25 J/TH fleets.
At current hashprice and network-average operating cost of $0.05/kWh, breakeven efficiency sits at approximately 24.6 J/TH. Every machine less efficient than ~25 J/TH is operating at a gross loss at average electricity rates.
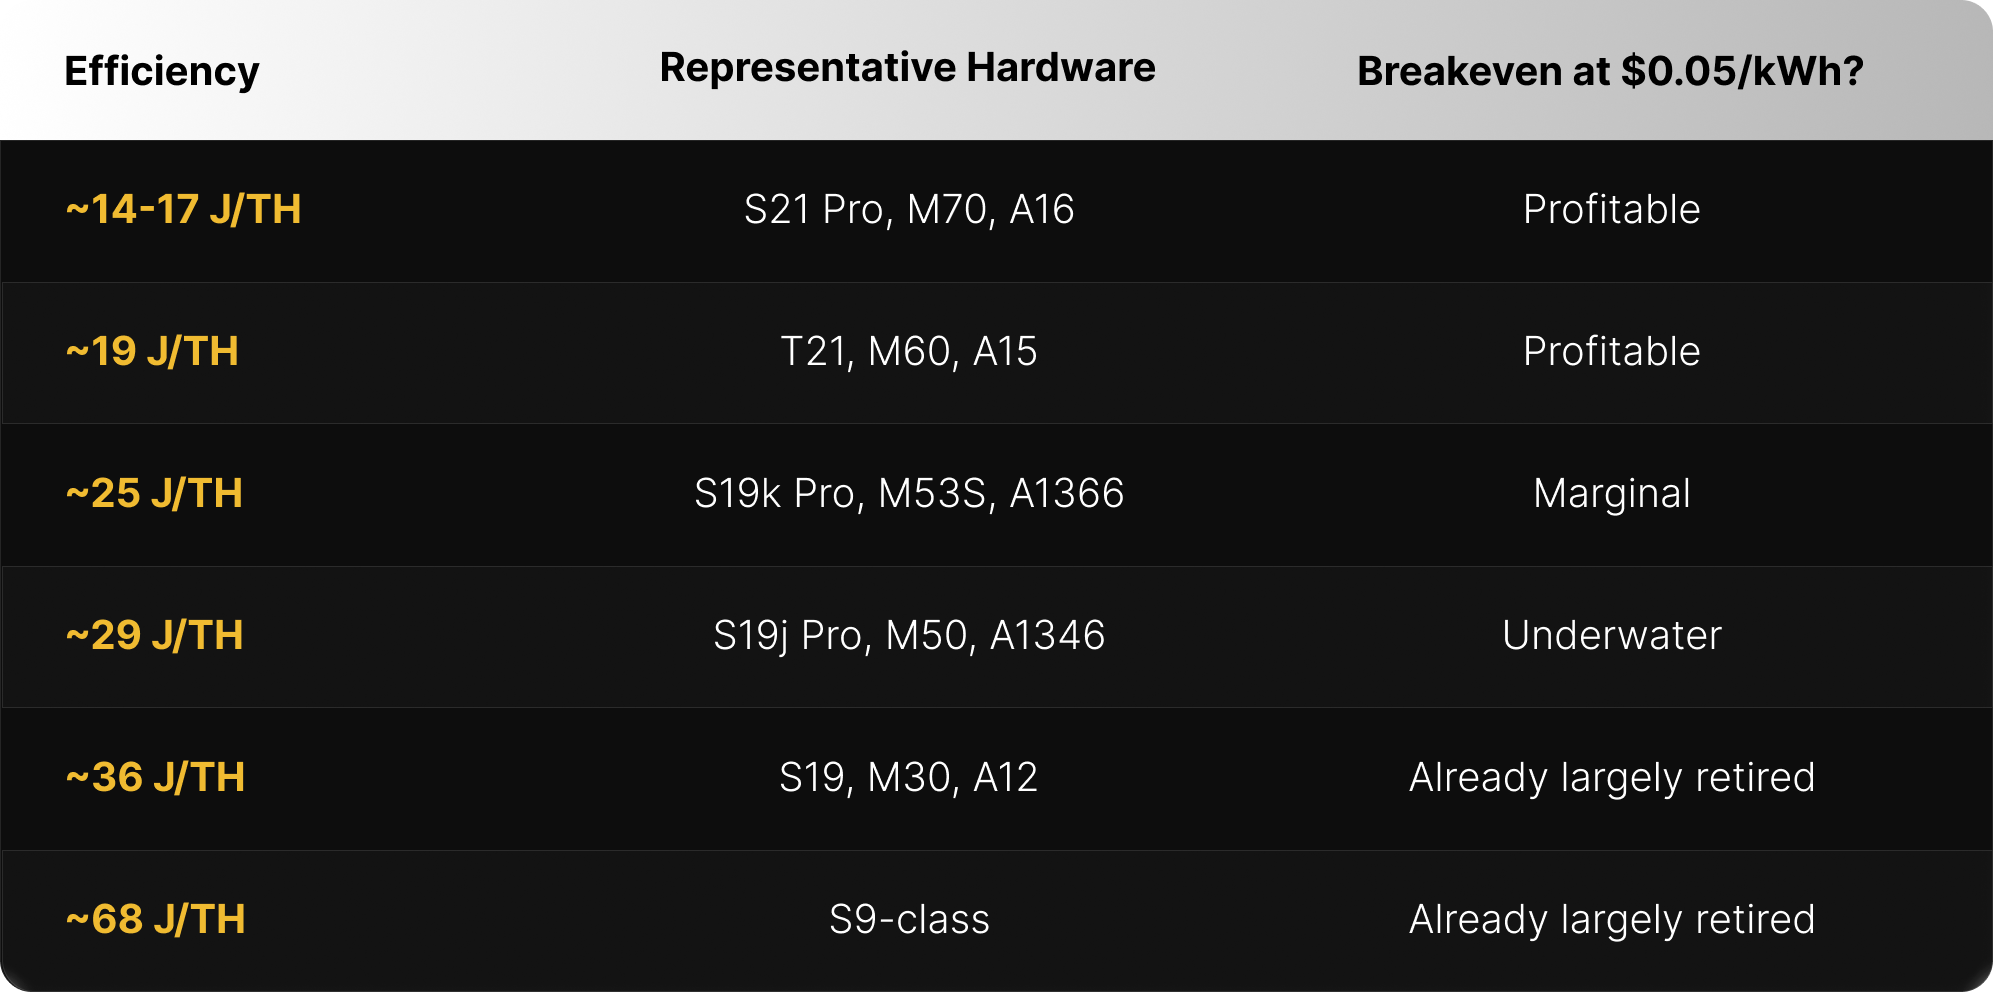
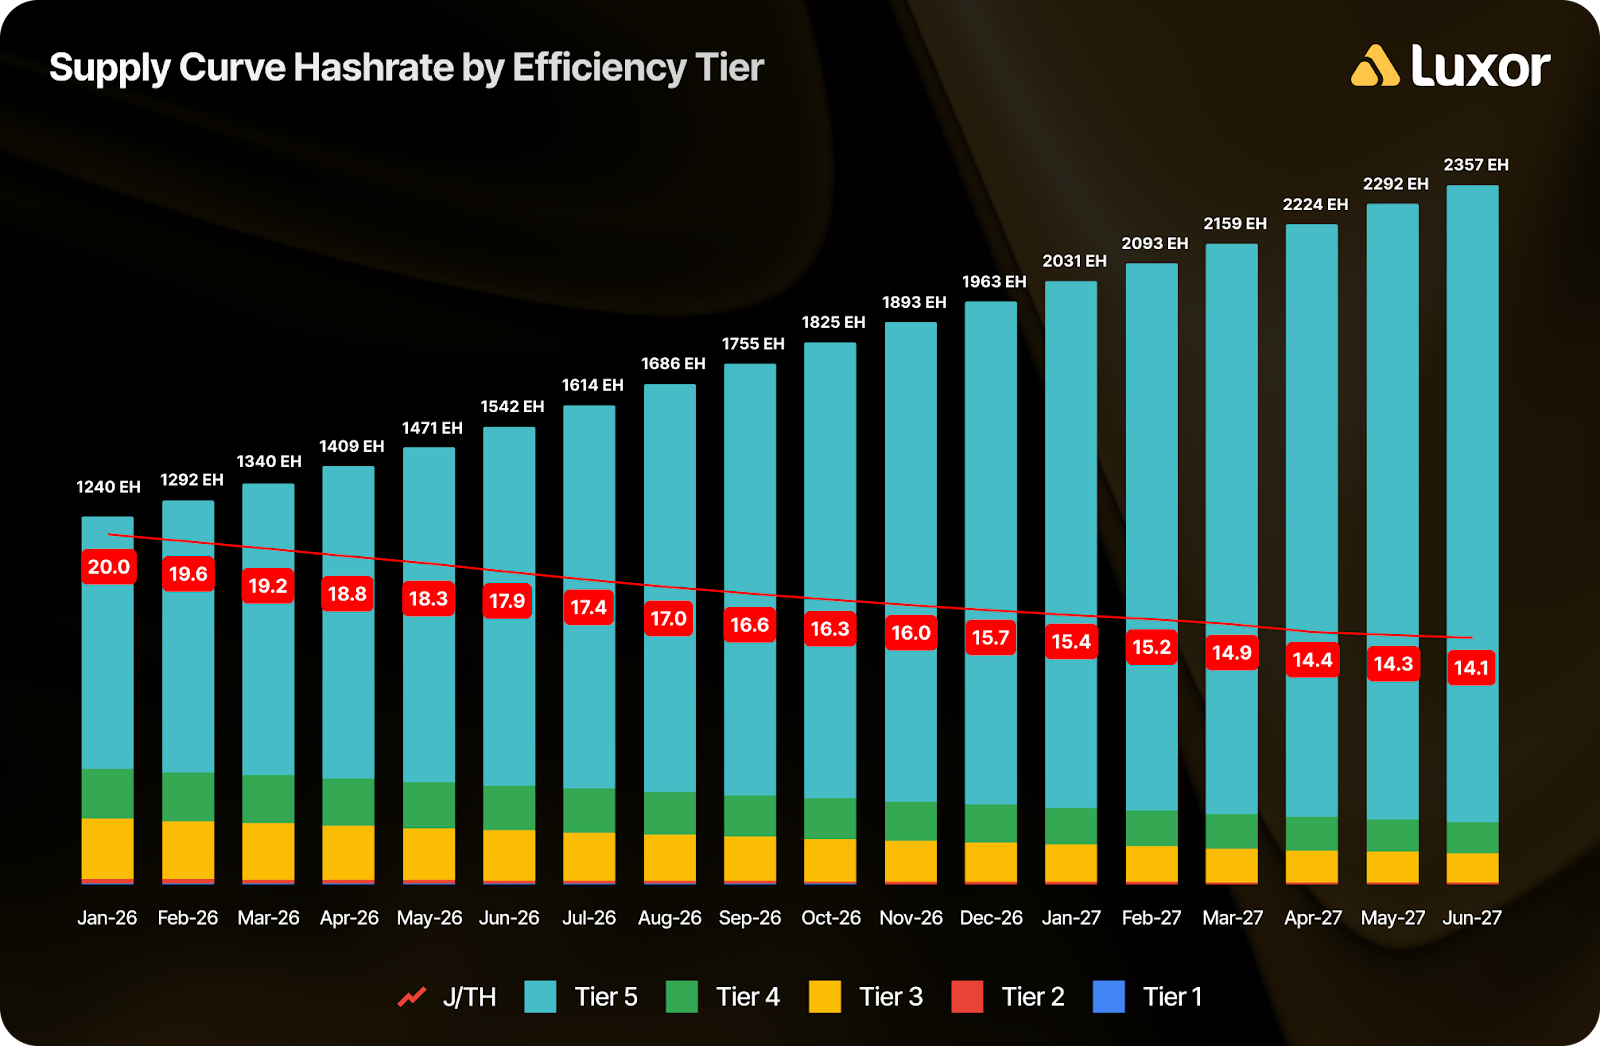
The more useful forward-looking question is what happens to active hashrate as new machines deploy alongside ongoing attrition of marginal capacity. Our model projects total net ASIC capacity growing from 1,292 EH in February to ~1,340 EH in March and ~1,409 EH by April, driven by continued deployment of new-generation S21 Pro, M70, and A15/A16-class hardware. These machines (~14–17 J/TH) remain profitable across most power cost scenarios.
However, net active hashrate growth will be muted as long as hashprice stays below ~$35 per PH/s/day: every new terahash brought online by next-gen deployments is partially offset by marginal S19-era machines going offline. This is what the projected improvement in average fleet efficiency from 19.6 J/TH to 18.8 J/TH over the next two months reflects: the network is getting leaner.
In the near-to-medium term, we expect moderate difficulty growth to resume.
BTC Price — Will History Repeat?
The ~50% drawdown from October 2025's ~$126,000 peak is severe, but it is not unprecedented.
Every prior Bitcoin bull market has included corrections of comparable or greater magnitude on the way to new highs. The 2021 cycle's -62% COVID crash and -53% mid-cycle correction both resolved to the upside. Even the 2017 cycle, which saw 13 drawdowns exceeding 10%, continued to new all-time highs each time.
What makes the current drawdown notable is where it sits in the cycle timeline. The cycle peaked approximately 17.5 months post-halving — closely aligned with the 2017 and 2021 cycle peaks at 17.2 and 18.0 months post-halving, respectively. If the cycle peak is already in, the relevant historical comparison shifts from "mid-cycle correction" to "bear market onset."’
Prior peak-to-trough bear markets were from -77.4% (2021) to -83.8% (2017). Applied to the ~$126,000 cycle peak, that range implies a potential trough of $21,000–$29,000. Structural differences from prior cycles — persistent spot ETF demand, the halving-driven supply squeeze still relatively recent, Bitcoin treasury companies — may or may not support a shallower floor.
Three scenarios for the path ahead:
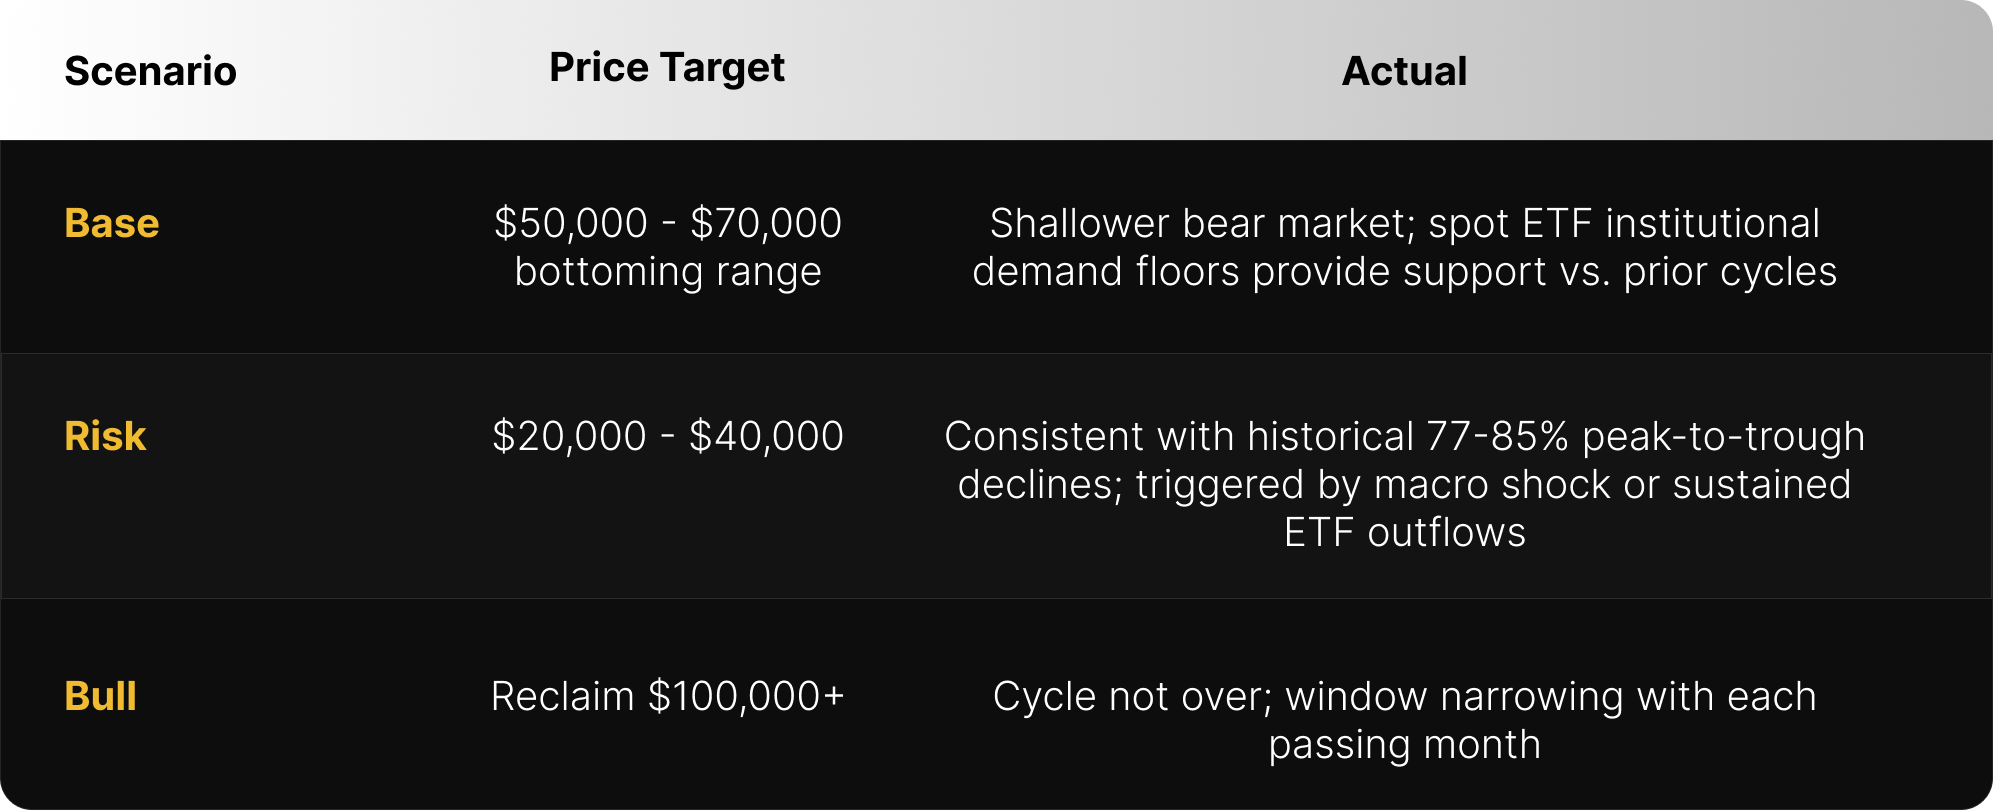
For miners, the base case matters most. A $50,000–$70,000 floor keeps hashprice in the $25–$35 range — survivable for newer operators but a prolonged grind for anyone still running older hardware. The risk case pushes hashprice toward $10–$20, which would trigger further capitulation and a difficulty reset. The bull case restores margins and reverses the natural selection currently pruning the network.
Looking Ahead
As of early March, BTC has shot back up to around ~$71,000 and USD hashprice is currently hovering around ~$31 per PH/s/day.
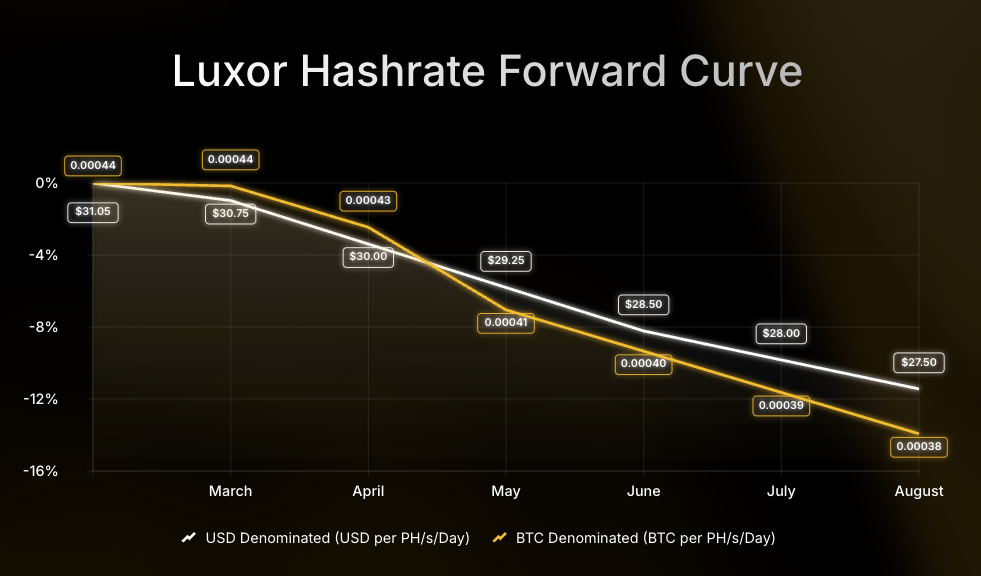
Looking forward, Luxor’s Hashrate Forward Market is pricing in an average hashprice of $29.00 or 0.00040 BTC per PH/s/day over the next six months. Sellers can currently secure this hashprice while buyers have the opportunity to lock in the same hashcost through August 2026.
If you’d like to learn more about Luxor’s Bitcoin mining derivatives, please reach out to [email protected] or visit https://www.luxor.tech/derivatives.
About Luxor Technology Corporation
Luxor delivers hardware, software, and financial services that power the global compute and energy industry. Its product suite spans Bitcoin Mining Pools, ASIC Firmware, Hardware trading, Hashrate Derivatives, Energy services, and a Bitcoin mining data platform, Hashrate Index.
Disclaimer
This content is for informational purposes only, you should not construe any such information or other material as legal, investment, financial, or other advice. Nothing contained in our content constitutes a solicitation, recommendation, endorsement, or offer by Luxor or any of Luxor’s employees to buy or sell any derivatives or other financial instruments in this or in any other jurisdiction in which such solicitation or offer would be unlawful under the derivatives laws of such jurisdiction.
There are risks associated with trading derivatives. Trading in derivatives involves risk of loss, loss of principal is possible.


Hashrate Index Newsletter
Join the newsletter to receive the latest updates in your inbox.


