
Luxor Hashrate Lookback Series – January 2026
January 2026’s hashrate and hashprice trends, forward market participation, trading activity and contract performance.
Luxor’s Monthly Lookback Series is a deep dive into Bitcoin hashrate market activity. In this post, we cover January 2026’s hashrate market and hashprice trends, forward market participation, trading activity and contract performance.
Summary
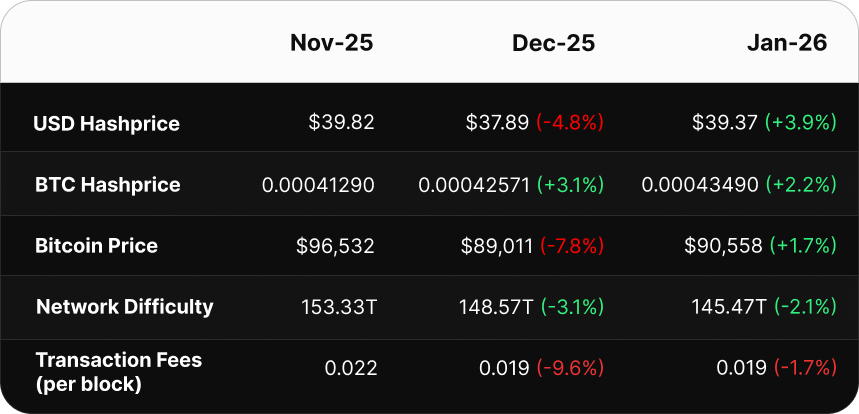
- Hashprice Rebound: USD monthly average Hashprice staged a "dead cat bounce," rising 3.9% to $39.37 per PH/s/Day in January. This increase was driven by two negative difficulty adjustments rather than sustained bullish BTC momentum.
- Winter Storm Impact: In late January, a severe Arctic blast forced massive weather-induced curtailment, pushing approximately 200 EH/s offline, causing block times to slow, and significant downward difficulty adjustment of 11.16% on February 7.
- Hedging Reversal in the Forward Market: While USD sellers largely outperformed in January, the buyers of the BTC-denominated January contract won across the board for the first time since inception of Luxor’s hashrate forward market in 2024.
- Hashrate Hedgers Won: Regardless of contract denomination or hedge horizon, rolling hedge strategies outperformed mining at spot FPPS over the past year.
January Spot Hashprice & Its Constituents
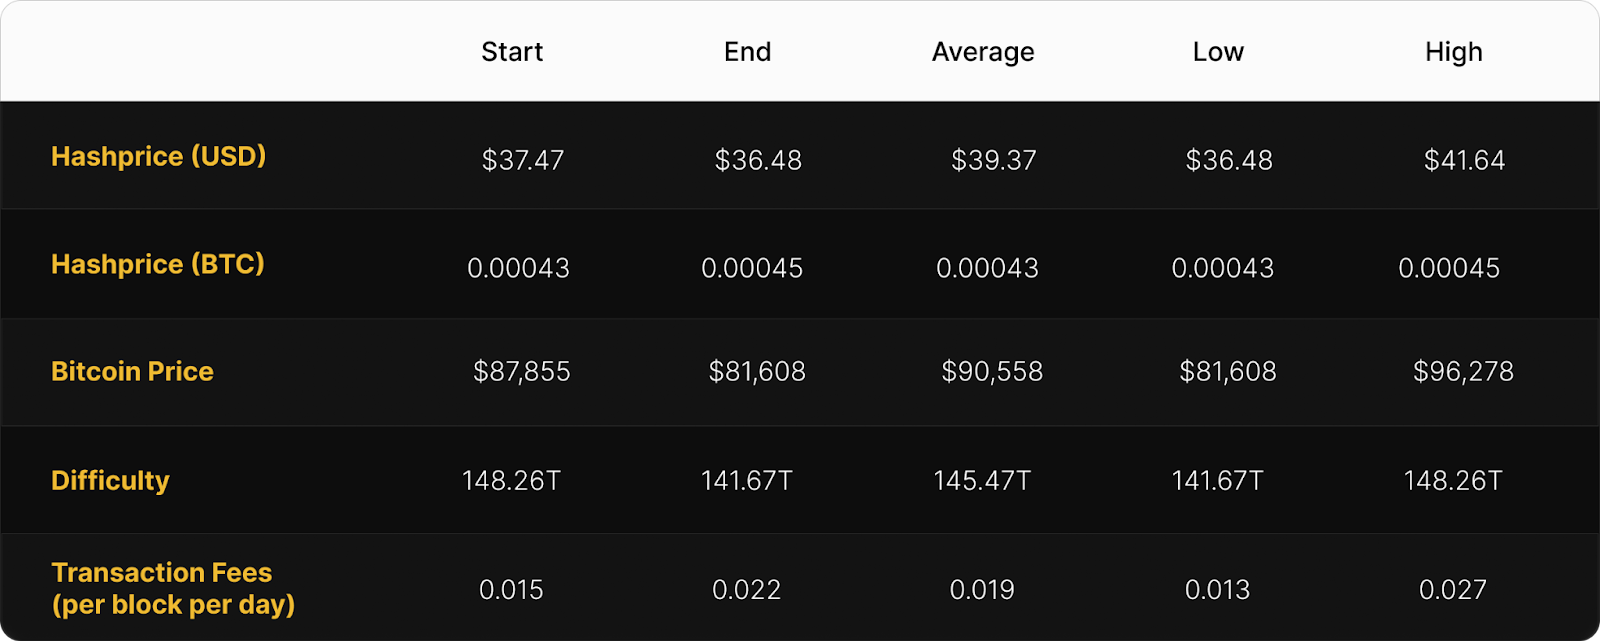
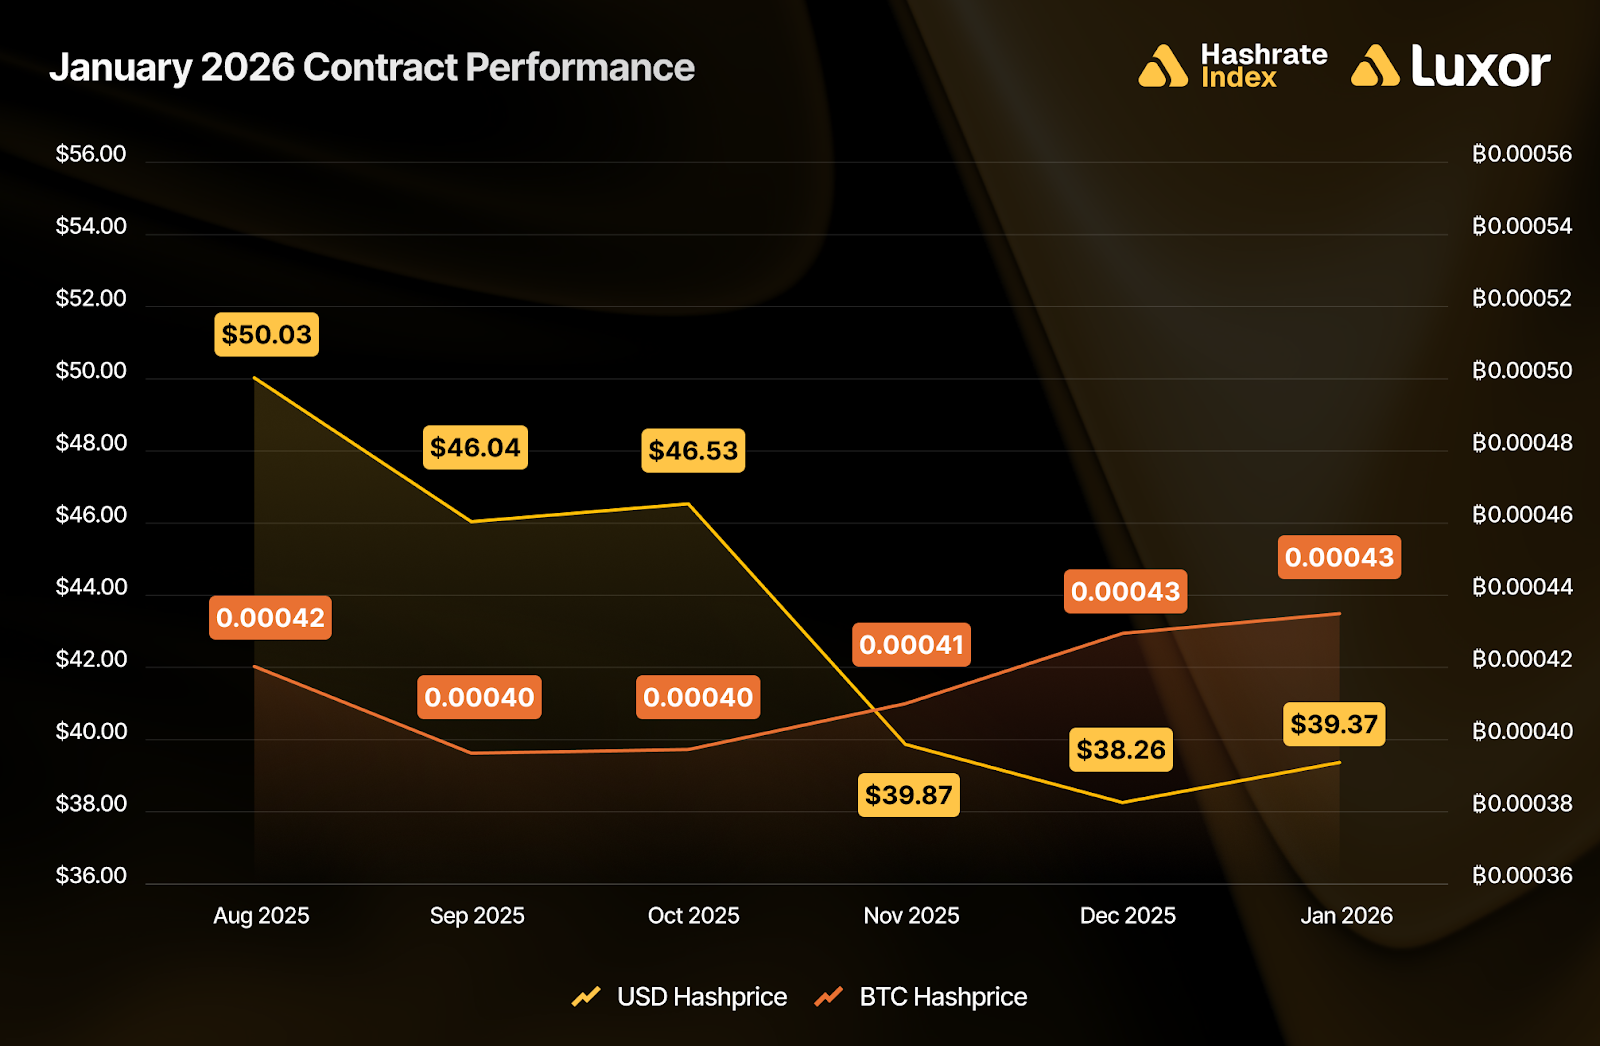
January 2026 was a dead cat bounce for Bitcoin mining markets. Average USD hashprice rose 3.9%, from $37.89 in December to $39.37 in January, driven by two downward difficulty adjustments and a modest increase in BTC prices. Despite the higher monthly average, the month ended on a bearish note as BTC prices fell sharply.
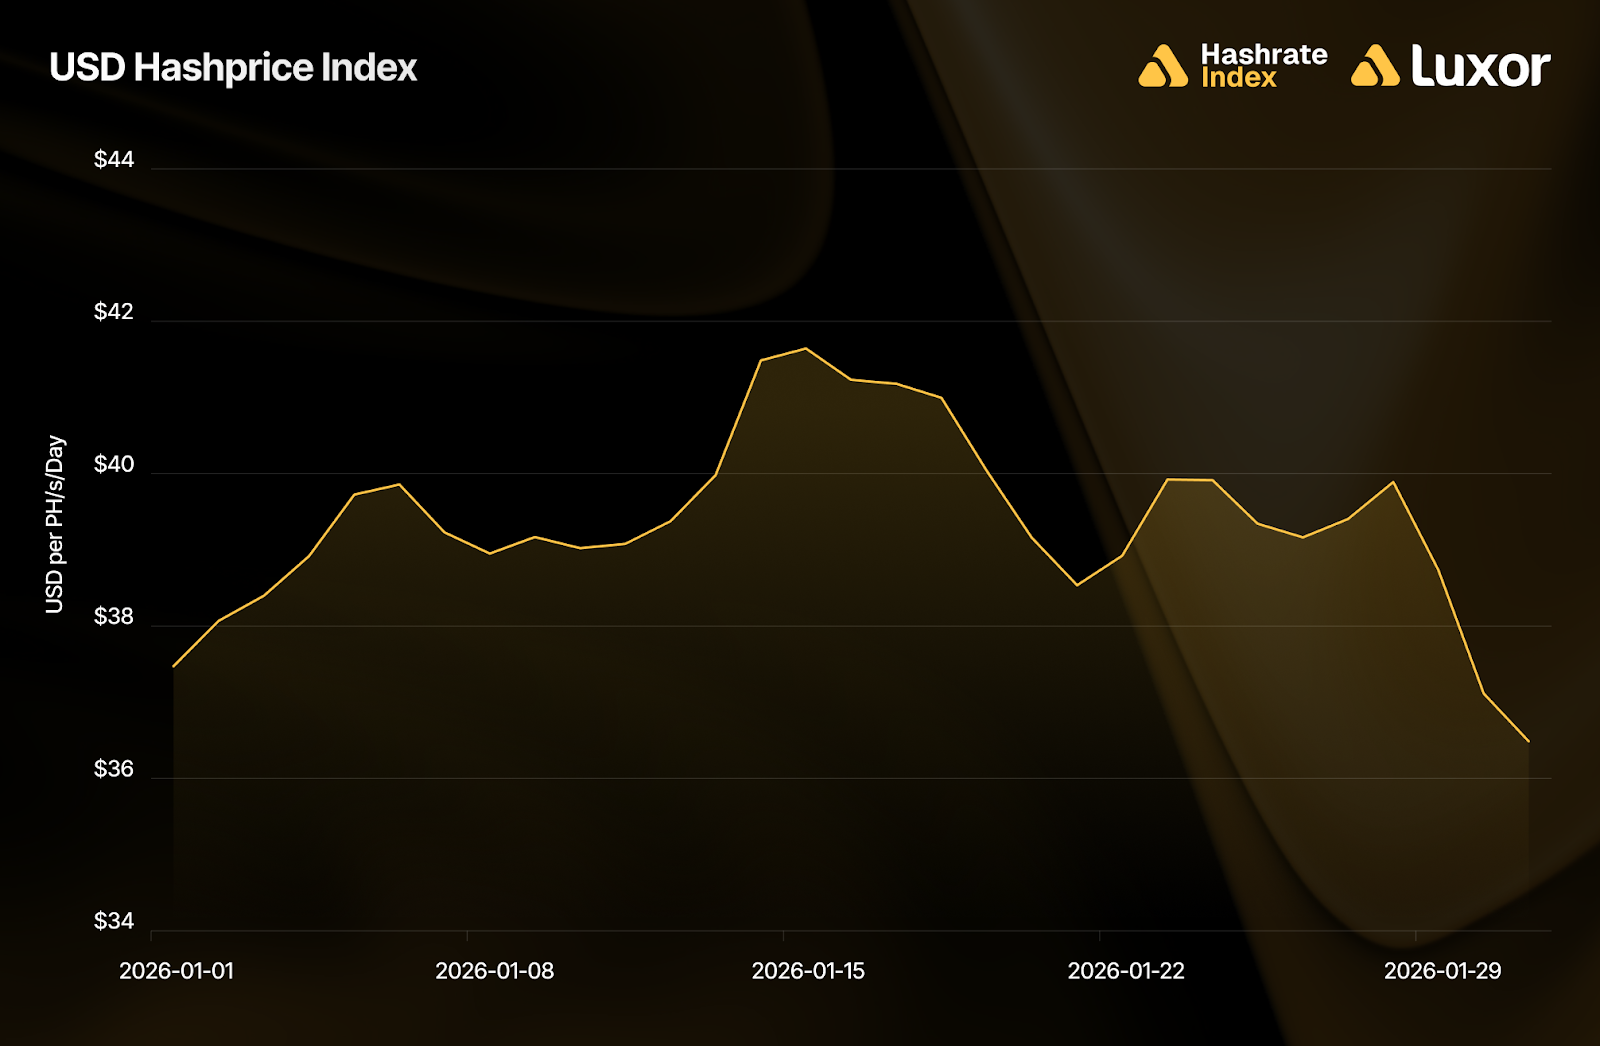
USD hashprice opened January at $37.47 and climbed to a monthly peak of $41.64 on January 15 before weakening into early February. The rally was fueled by a short-lived BTC price rebound and two consecutive downward difficulty adjustments. However, momentum faded quickly as BTC fell 15% from $96,277 on January 15 to $81,608 by month-end, pulling hashprice lower with it.
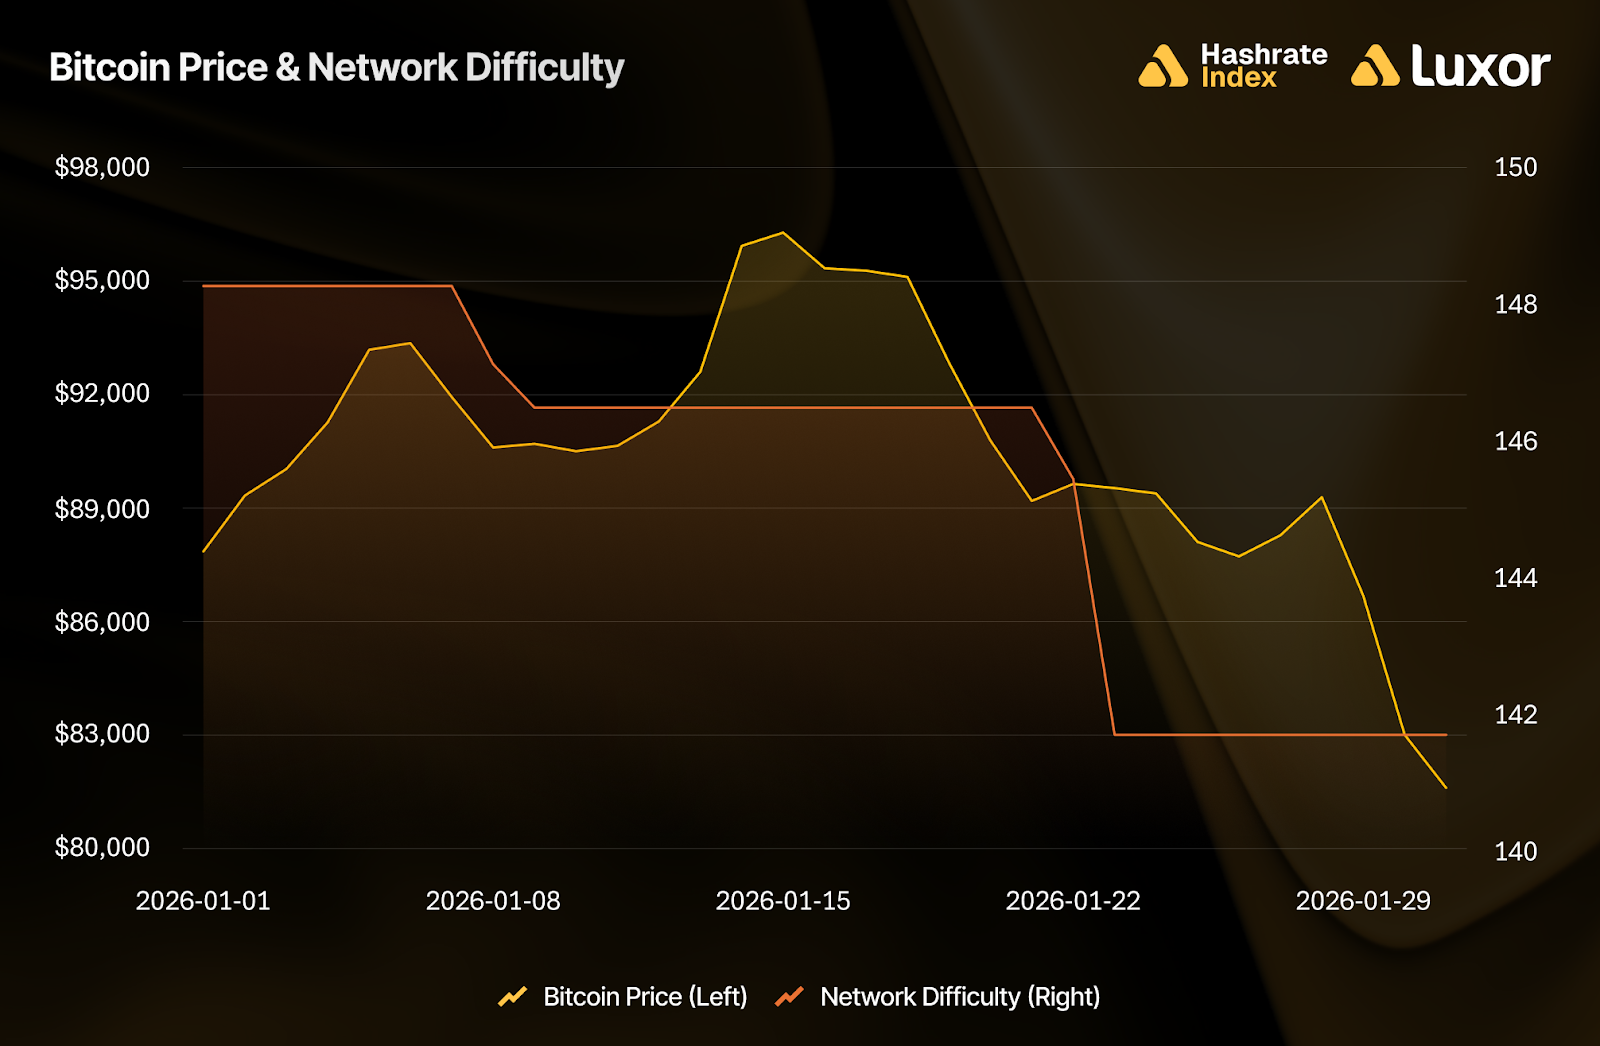
January’s two downward difficulty adjustments extended a broader trend: five of the last six epochs have adjusted lower, producing a cumulative 9% decline since early November. This streak is unprecedented in the modern mining era. The China mining ban in 2021 caused larger individual drops — including a record 27.9% decline — but the negative run lasted only four consecutive epochs. The last comparable stretch occurred in 2011, when the network saw eight straight downward adjustments. For context, at that time BTC was trading around $30, total network hashrate was just 13 TH/s, and difficulty sat below 2 million.
The decline from peak hashrate in Q4 2025 has been driven by three factors: declining Bitcoin prices pushing legacy hardware into negative margins, rising winter energy costs triggering seasonal curtailment across North America, and regional enforcement actions removing capacity from major mining regions.
At an estimated network average power cost of $50/MWh, older-generation miners operated at negative gross margins every day in January. Unlike hashrate lost to temporary weather or policy curtailments, this capacity is unlikely to return without a meaningful BTC price rally. As of late January, Hashrate Index’s latest Q1-2026 mining economics projections model estimates that roughly half of the difficulty decline observed since mid-October was driven by falling BTC prices.

Following two downward difficulty adjustments of -1.20% and -3.28% on January 8 and 22, an Arctic blast swept across major U.S. mining regions, driving widespread curtailment and sharply reducing online hashrate. Block times slowed to roughly 12 minutes, triggering an 11.16% difficulty adjustment on February 7 which lowered network difficulty to 125.86T.
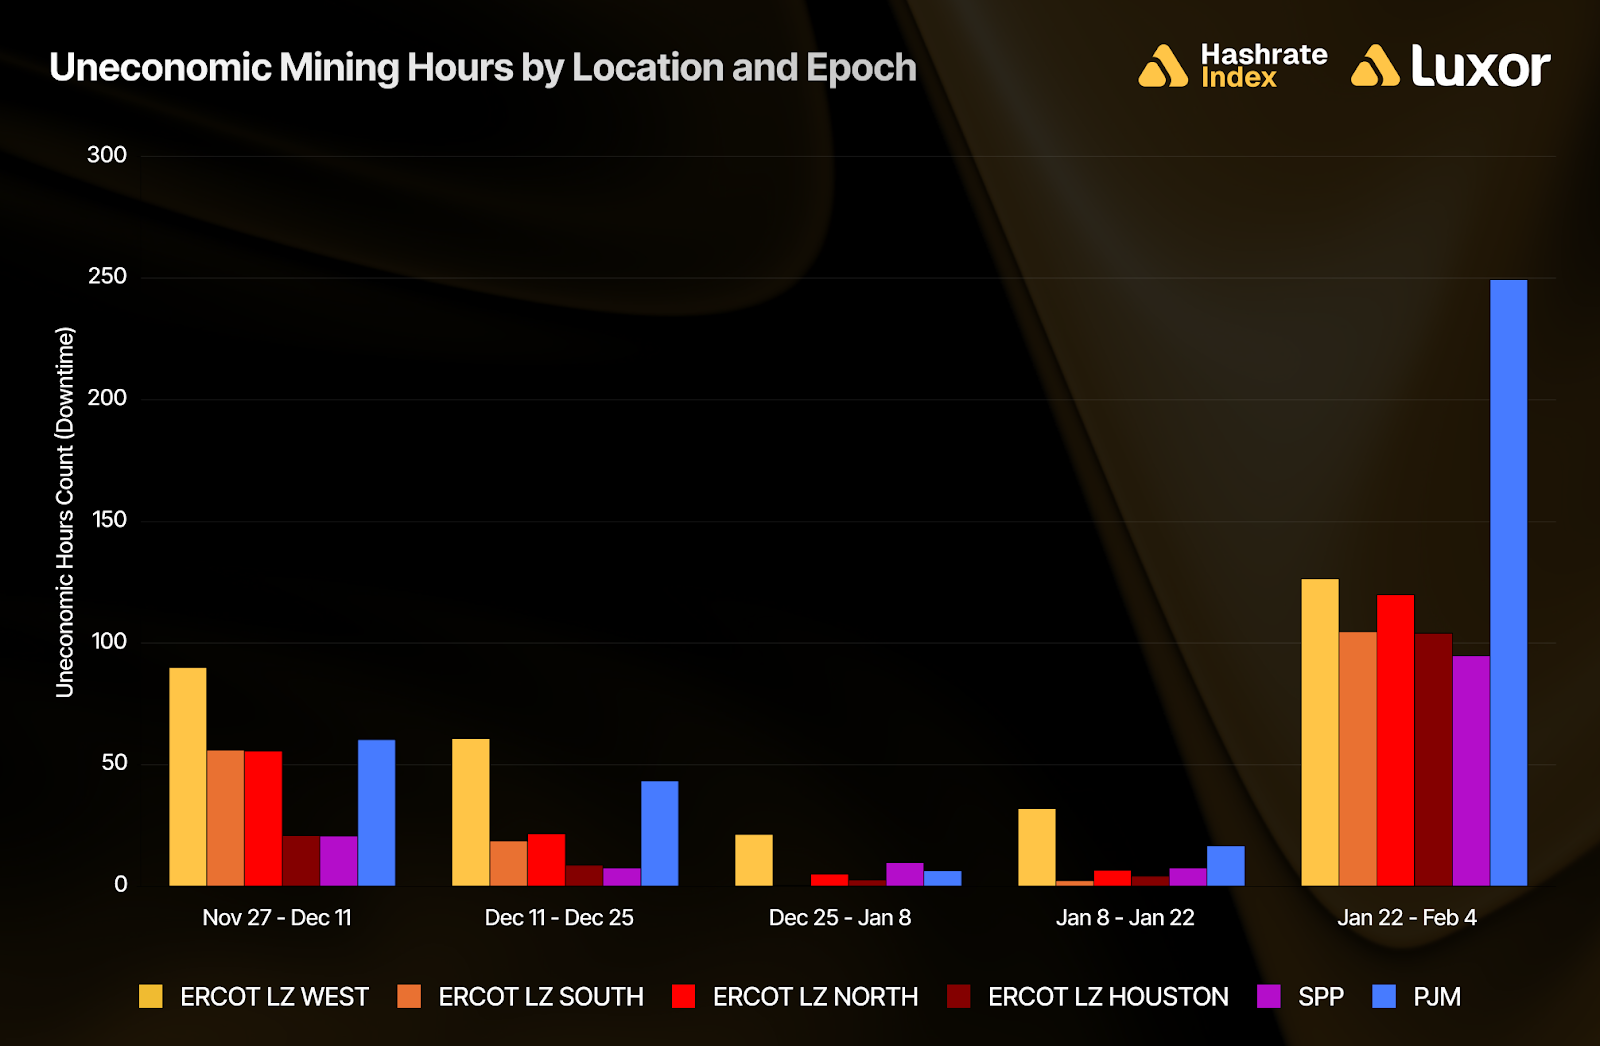
Based on Hashrate Index’s mining economics projections, we estimated that the entirety of this difficulty adjustment was explained by weather-driven curtailment, as uneconomic hours in ERCOT increased by 908% during the January 22–February 4 epoch relative to the prior January 8–January 22 epoch, compared to a 439% increase in all other ISOs across the U.S.
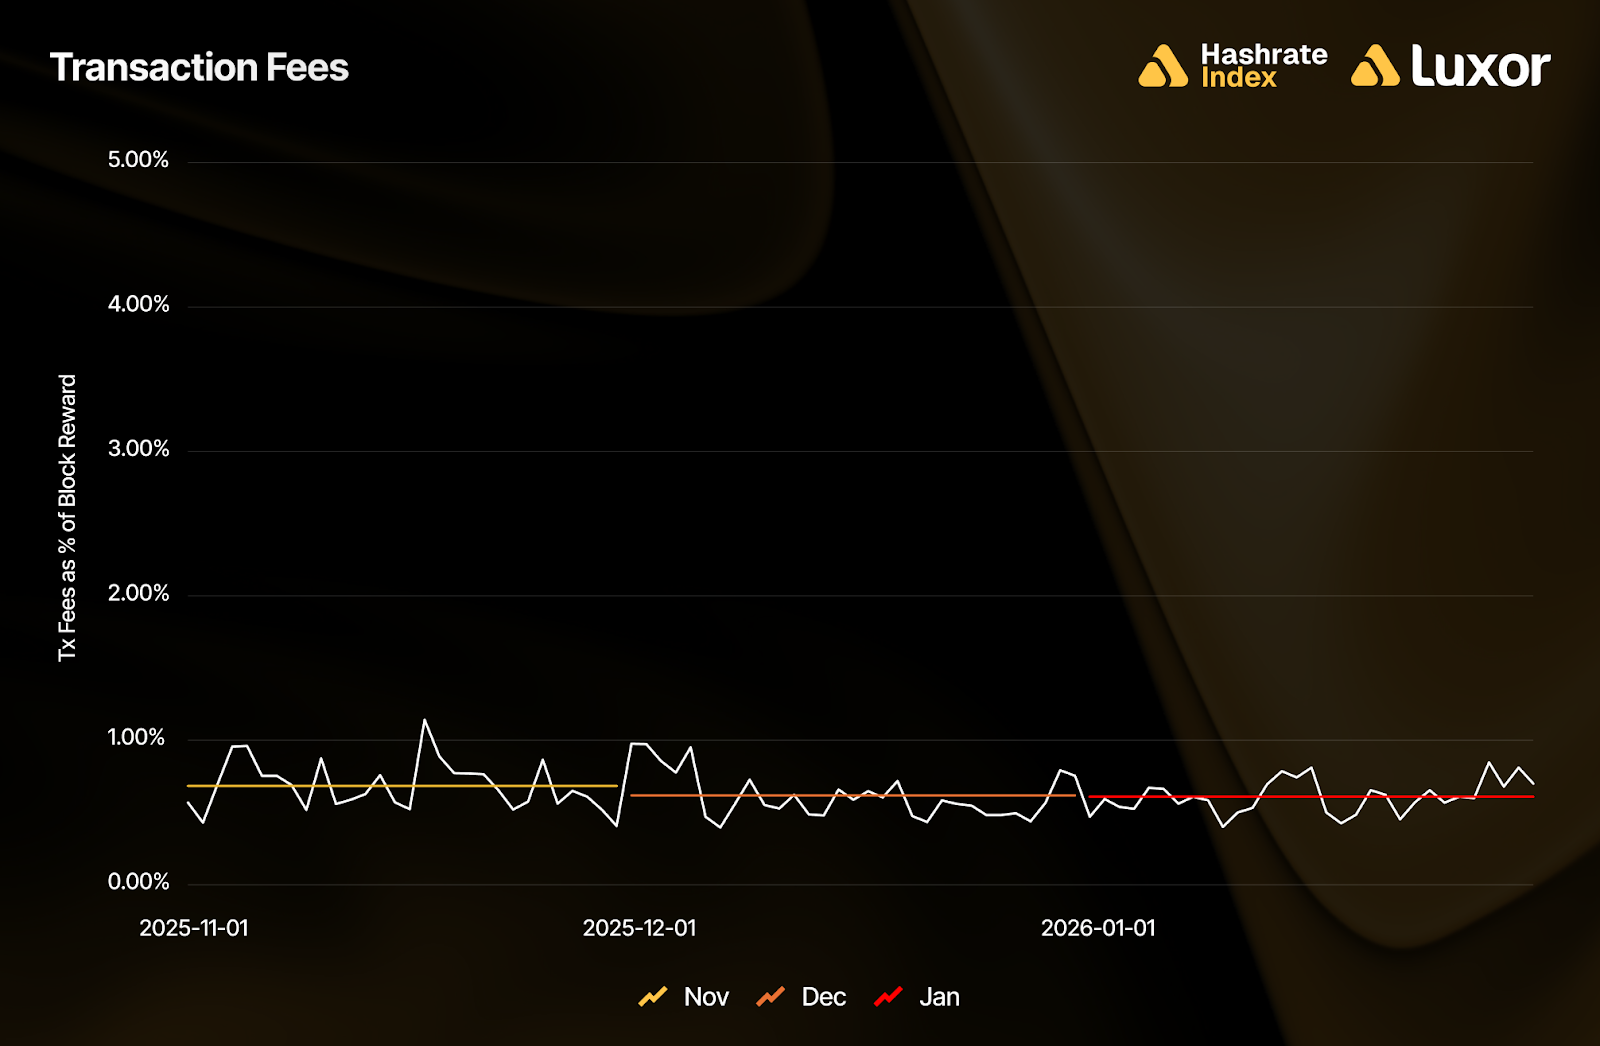
In January, transaction fees remained muted, averaging just 0.019 BTC per block, or approximately 0.7% of total block rewards. Fees are effectively non-existent as a revenue driver, hitting lows not seen in USD terms since 2022.
When the USD:BTC exchange rate is removed from the equation, BTC-denominated hashprice increased 2.2% to 0.000435 BTC per PH/s/Day. With negligible contribution from transaction fees, this was driven mainly by the two difficulty drops.

January 2026 Forward Hashrate Market Activity
Our analysis of the January 2026 hashrate market focuses on two key points: how the January 2026 hashrate contract traded in previous months and how the forward curve shifted in January, based on pricing for forward hashrate during the month.
The two tables below show the evolution of Luxor’s USD and BTC-denominated hashrate forward markets from August 2025–January 2026. Rows represent specific monthly contracts, while columns represent each trading month. Cell values indicate the average monthly mid-market hashprice — except for the highlighted main diagonal — which shows actual spot hashprice settlement for each month. The tables summarize both the trading history of the January 2026 contract (colored row) and the forward curve in January (colored column).
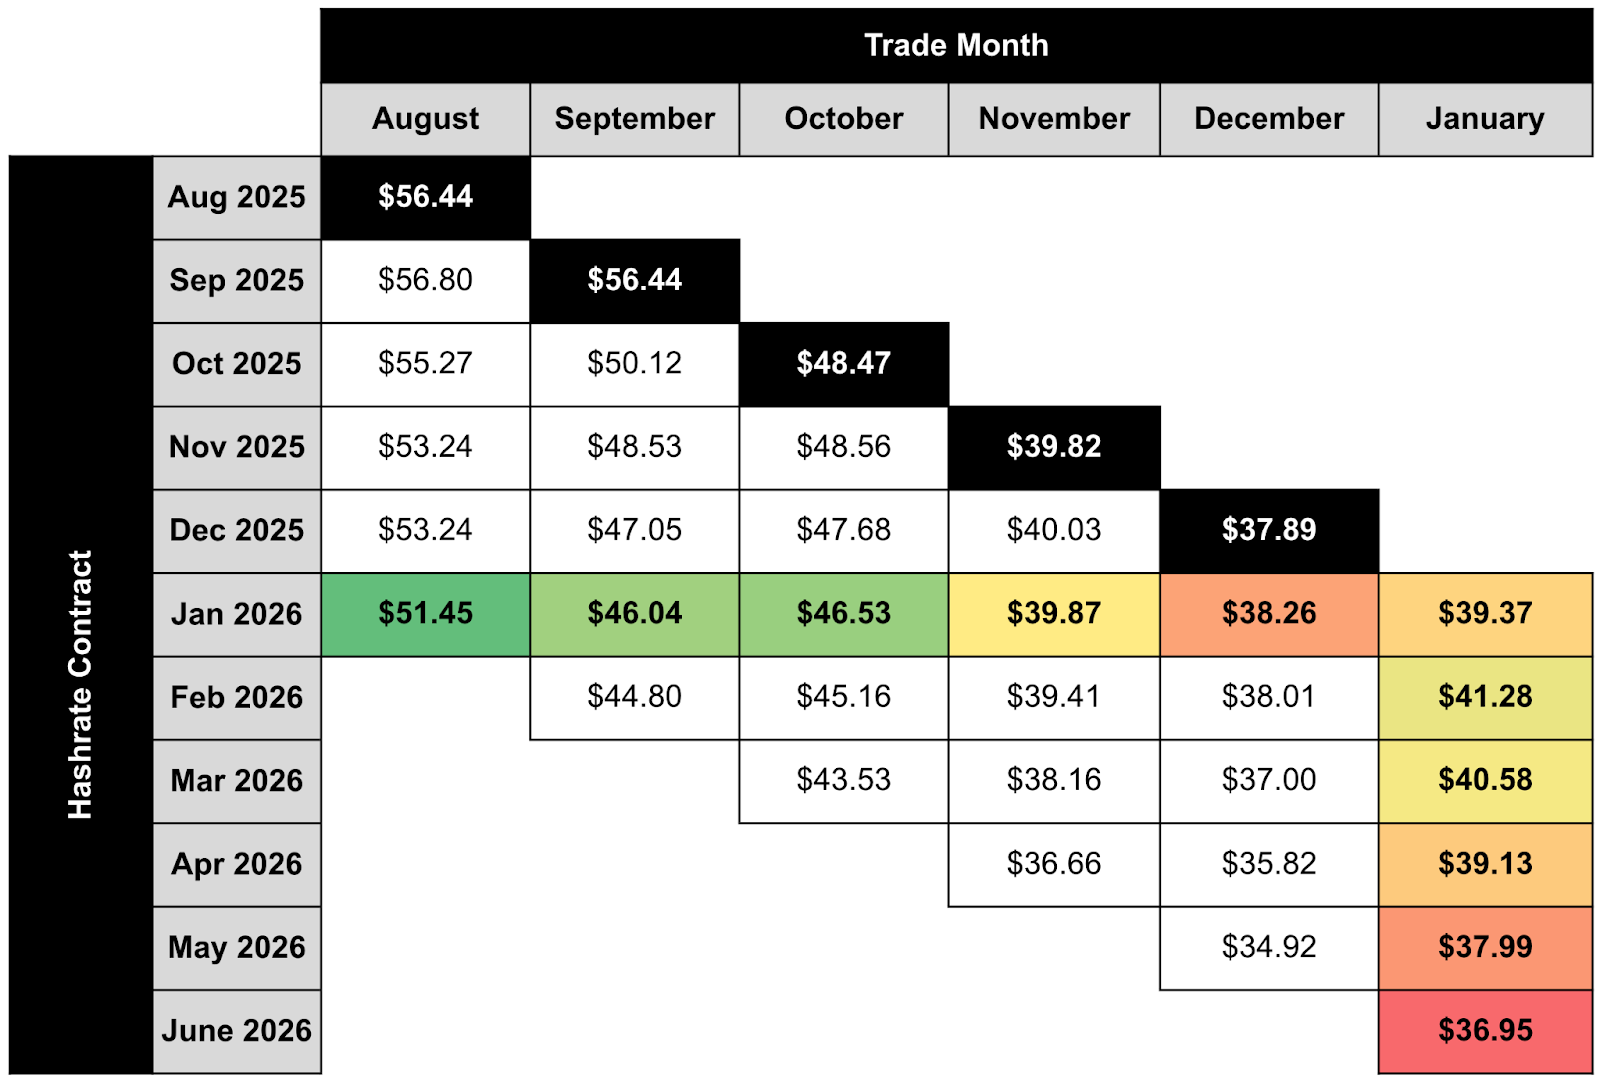
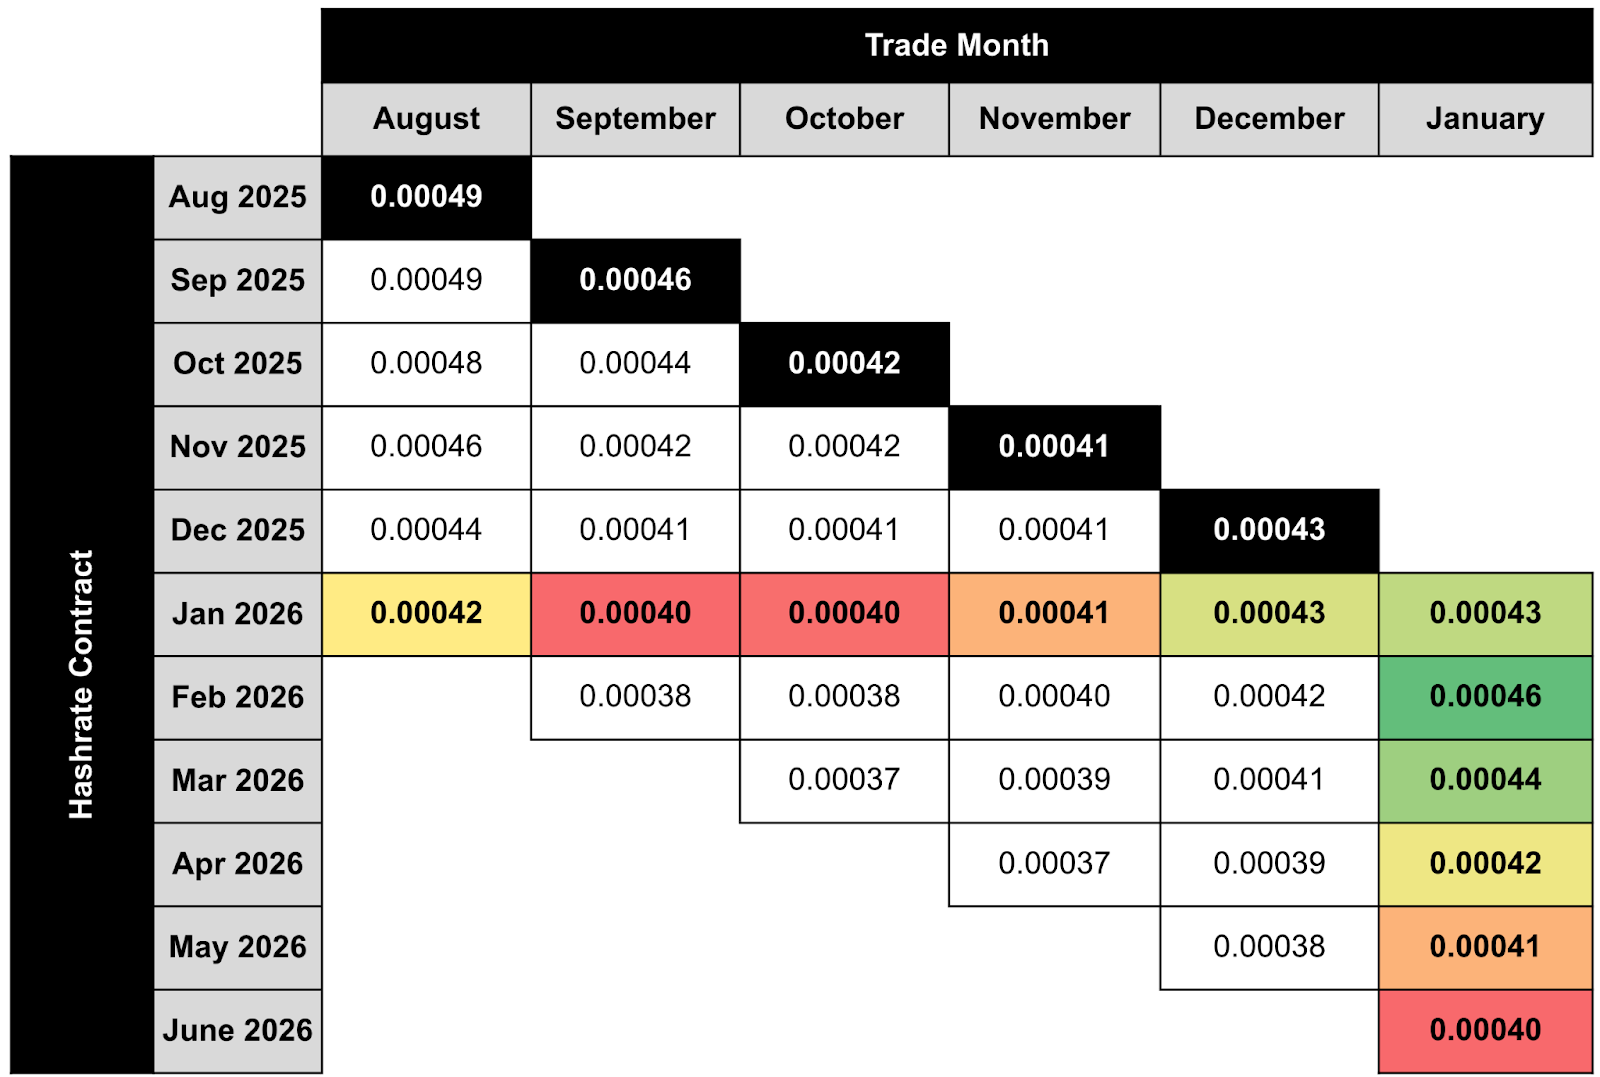
Note: all values (except for the bold highlighted main diagonal) shown in figures represent mid-market rates, the midpoint of the best bid and ask on Luxor's Non-Deliverable Hashrate Forward market. The bold highlighted main diagonal shows actual spot hashprice settlement in each month, measured by Luxor’s Bitcoin Hashprice Index.
The table below summarizes the typical buyers and sellers in Luxor’s deliverable (DF) and non-deliverable (NDF) hashrate forward markets. In January, DF buyers — often hosting companies and other entities with physical delivery obligations — used DFs to meet commitments through operational disruptions, from weather-related curtailment to unexpected machine downtime. On the sell side, miners remained the primary counterparties, using forwards to lock in fixed payouts that can support planning, fleet growth, and reduce downside hashprice exposure.
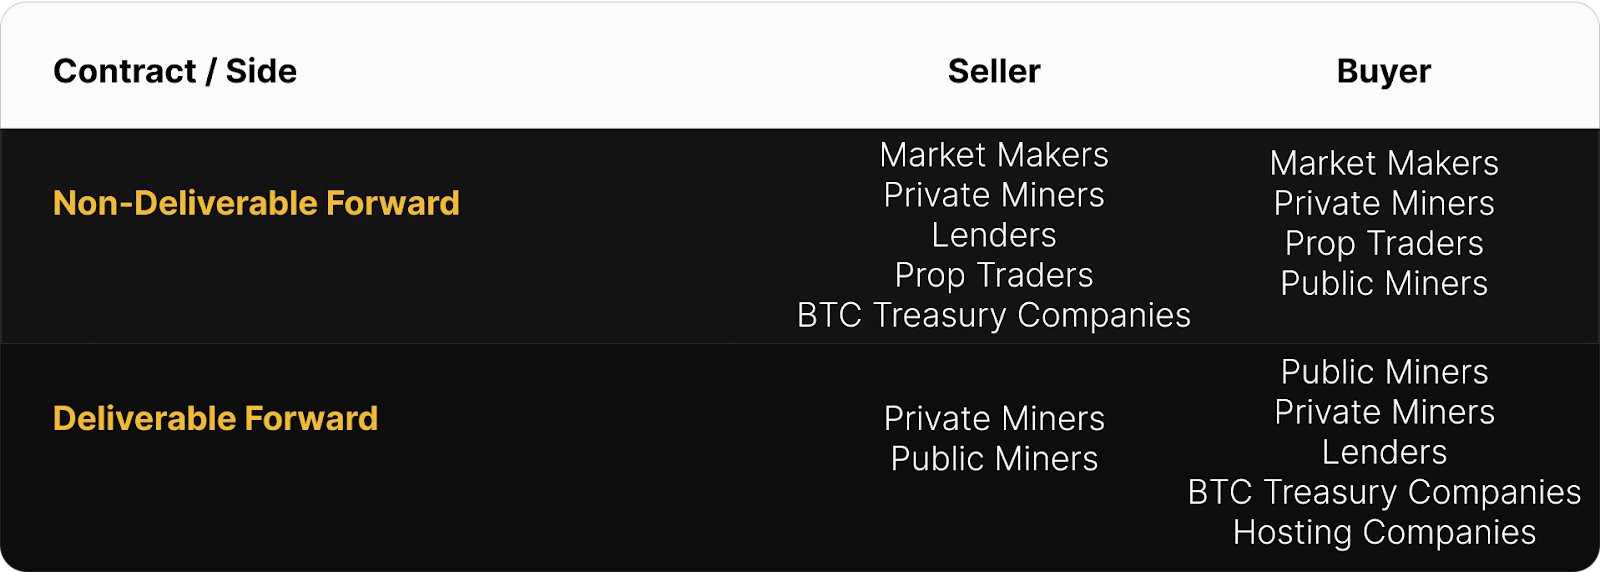
Because DFs are paid/received in advance, they typically trade at a discount to NDFs to compensate the buyer for credit risk; we view this DF-NDF spread as an implied interest rate in hashrate-based lending. Market participants can pair the two contracts to lock in a fixed return and neutralize hashprice exposure — lenders and BTC treasury companies often simultaneously buy DF and sell NDF to earn a BTC-denominated return, while miners may sell DF / buy NDF to access non-dilutive financing. In January 2026, this implied spread was roughly 6-13% annualized.
How January 2026 Hashrate Traded
In USD forward markets, early sellers of the January contract won. Miners who locked in prices during Q3–Q4 2025 materially outperformed spot FPPS returns in January. The only exceptions were December sellers, who slightly underperformed as contracts priced near $38.26 settled into a modest January bounce.
In BTC-denominated forward markets, buyers won across all 5 previous months, for the first time since the inception of Luxor’s forward hashrate market in January 2024. The unexpected cumulative difficulty drop in January led to average BTC hashprice settling at 0.000435 BTC — above the 0.00041-0.00043 BTC range implied by the forward curve over the prior five months.
The tables below compare forward hedging outcomes to spot FPPS mining for January 2026.
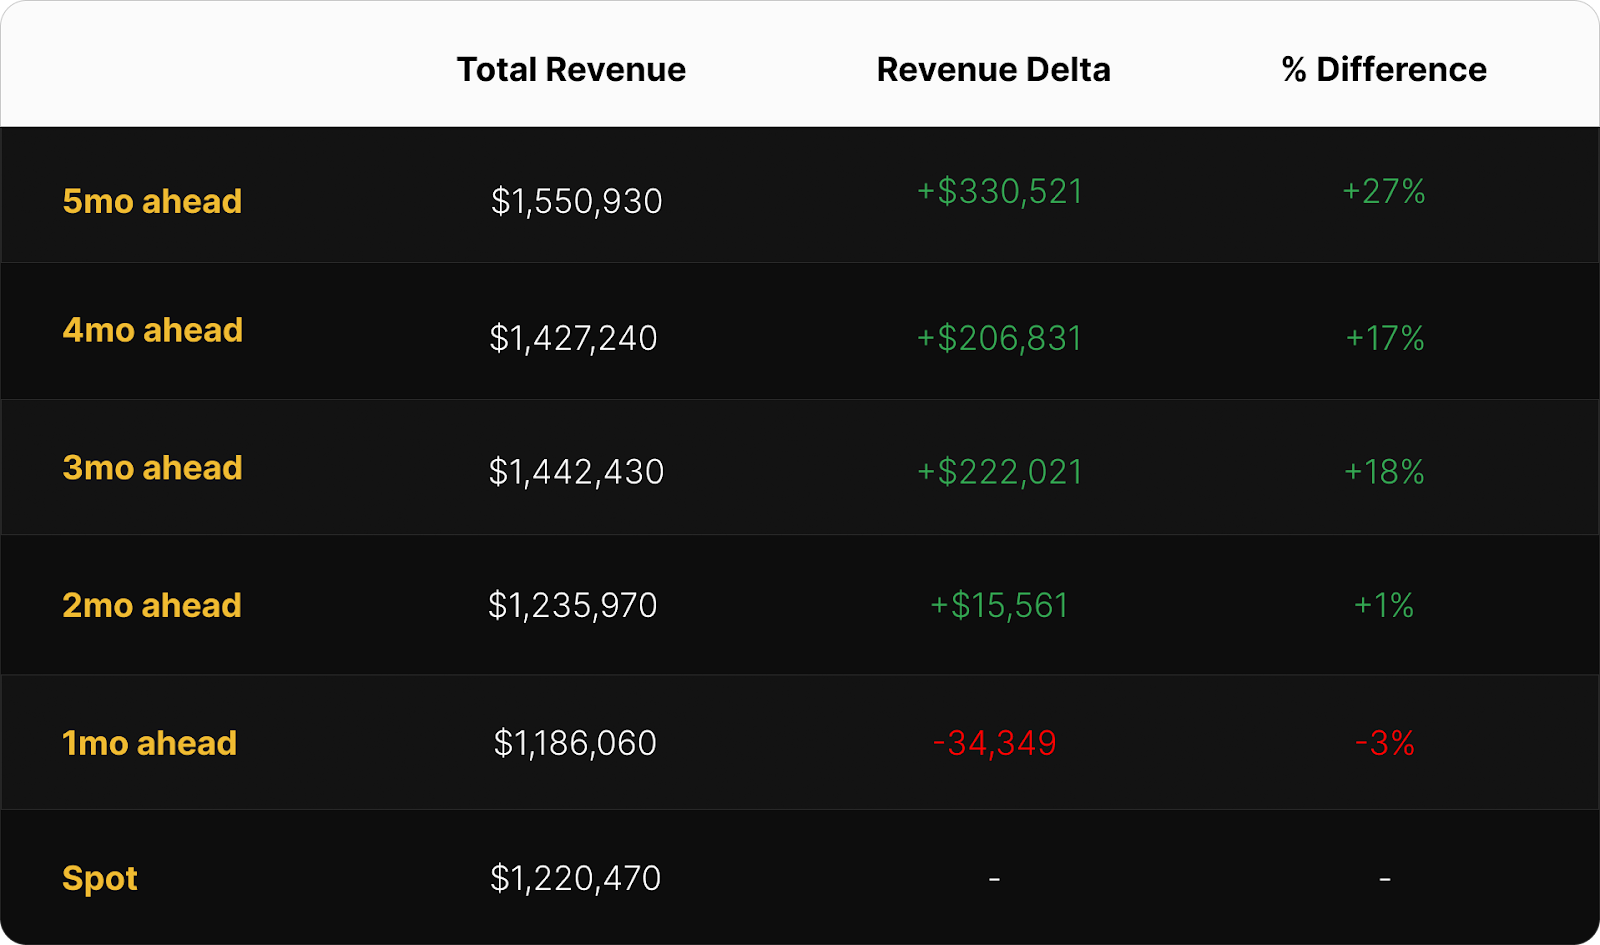
Selling 3–5 months forward significantly outperformed spot FPPS, delivering 17%–27% higher revenue for a 1 EH/s miner. The optimal trade would have been to sell forward 5 months ahead, which would have delivered a total revenue of $1.55M, bringing in an additional $330K (+27%) versus mining at spot FPPS rates. Hedging 2 months ahead was roughly flat (+1%), while 1-month hedges underperformed (-3%) due to the unexpected January rally.
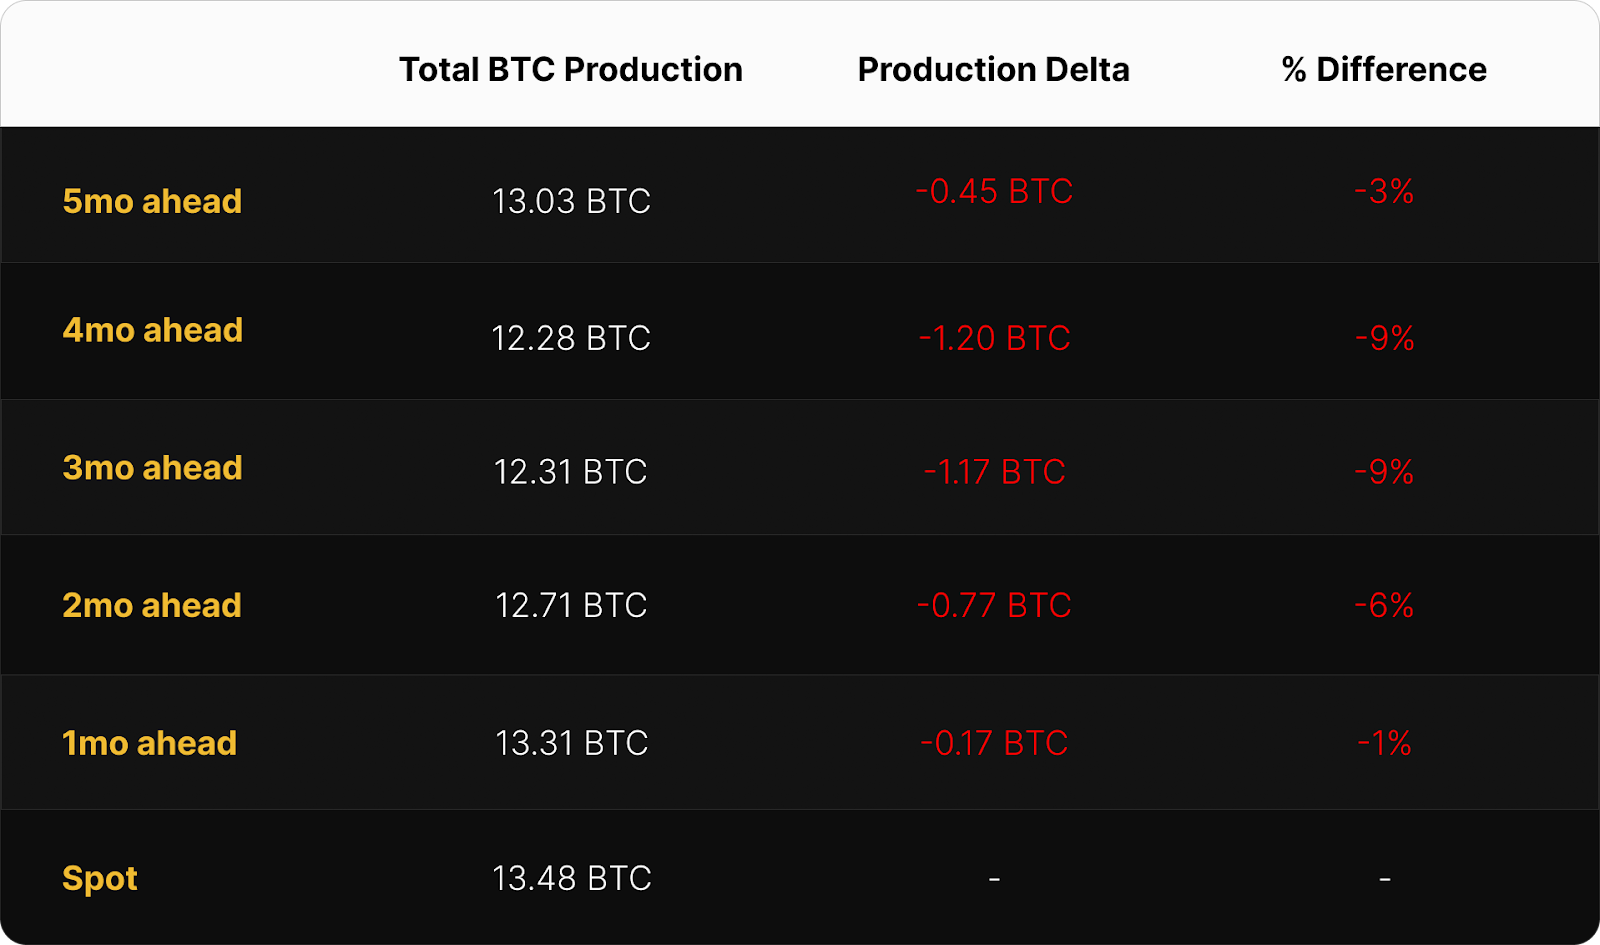
In BTC production terms, all forward sales underperformed spot FPPS mining. Compared to mining at spot FPPS rates, a 1-month hedge underperformed by 0.17 BTC (-1%), while 3–4 month hedges fared worst, underperforming by roughly -1.17 to -1.20 BTC (-9%) vs. spot.Zooming out, the following chart shows the performance for a range of rolling hedge strategies relative to spot FPPS mining, segmented by contract denomination and hedge horizon over the past 12 months.
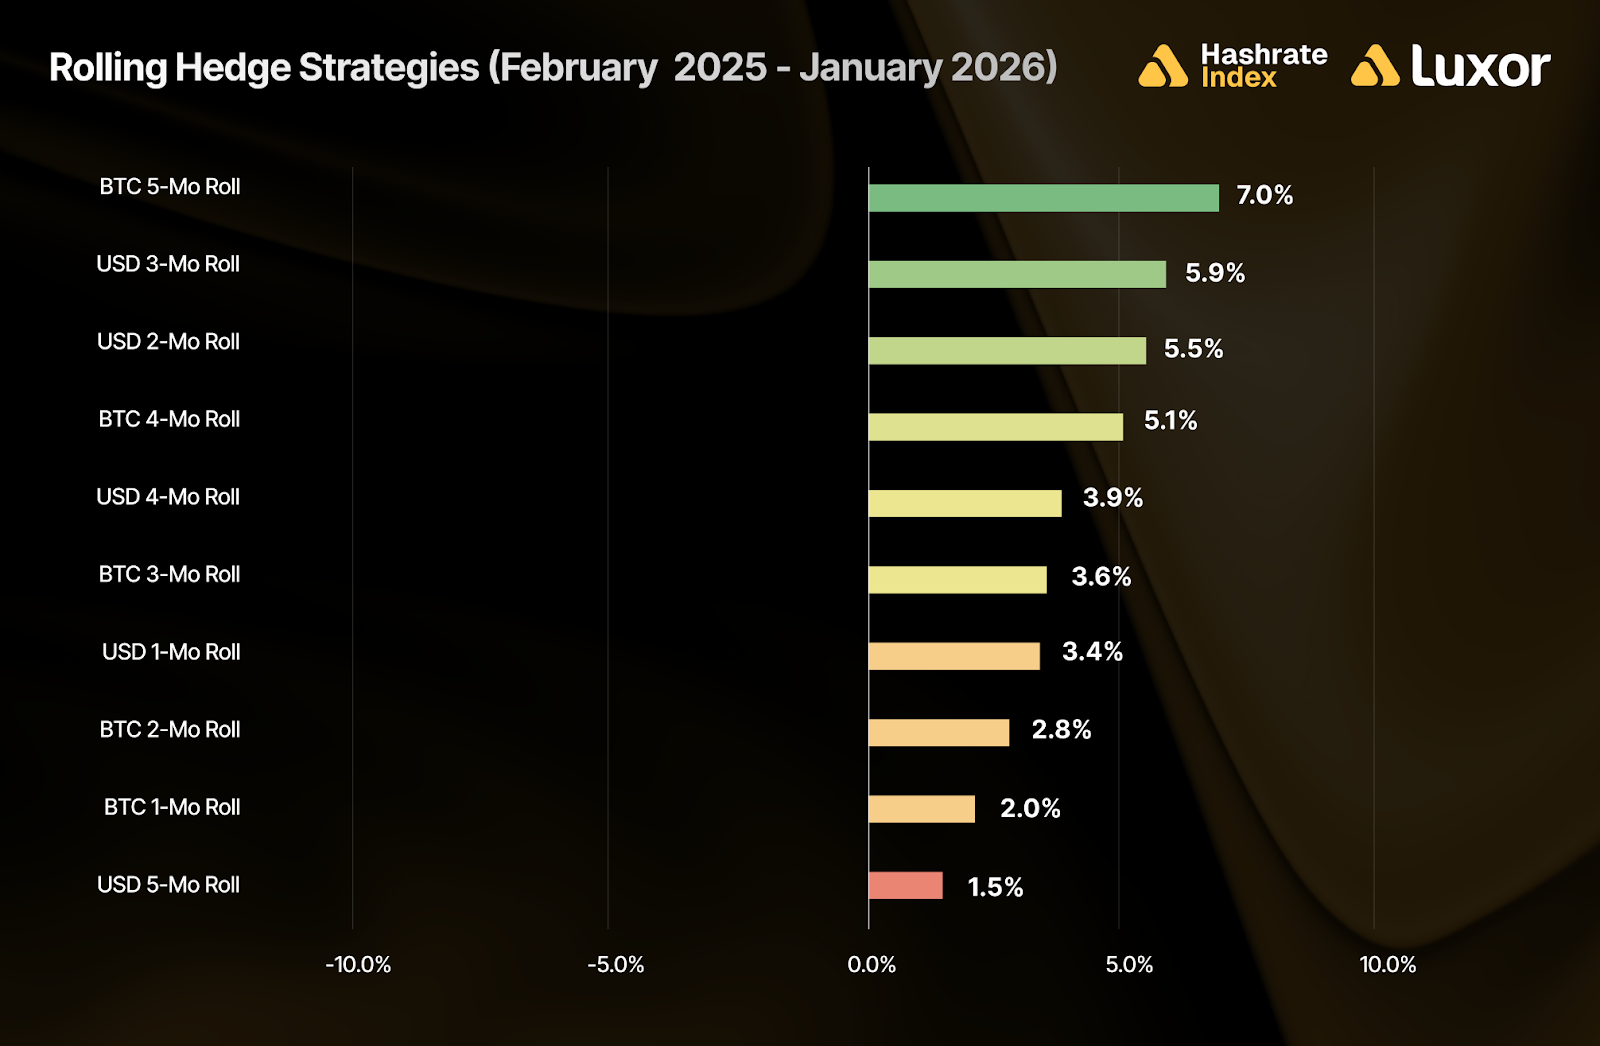
This comparison reveals that rolling hedging strategies outperformed mining at spot FPPS over the past year, with the strongest results coming from BTC-denominated 5-month (+7.0%) and USD-denominated 3-month forward sales (+5.9%). These longer-duration contracts generally benefited from locking in a higher hashprice ahead of rising network difficulty, low fee environments, and lower BTC prices.
Adopting a rolling hedge strategy denominated in either BTC or USD, with a horizon between 1-5 months, would have outperformed spot FPPS mining over the last 12 months, demonstrating the use case for a disciplined hashrate hedging program. Even the lowest result (selling USD 5-months at +1.5%) remained additive versus spot FPPS, while the mid-duration USD rolls and longer-dated BTC rolls delivered the largest uplift — suggesting that there were multiple effective ways to structure the hedge depending on whether a miner prioritized BTC or USD revenue certainty. In other words, historical data over the past 12 months supports the idea that rolling forward sales can both stabilize revenue and improve returns across a range of time horizons.
Note: these figures are strictly for demonstration purposes and exclude fees and bid/ask spreads associated with entering into hashrate forward contracts.
A second caveat: although selling forward proved to be favorable during timeframes shown above, it is critical to recognize that hedging is typically a cost of business rather than a revenue generation method. Hedgers willingly pay a price to buy certainty and obtain more predictable cash flows, which increases valuation, reduces cost of capital, and ultimately attracts investments.
How Future Hashrate Traded in January

The two tables below summarize the evolution of hashrate forward markets during January 2026, for the subsequent five months from February 2026–June 2026. Rows represent specific monthly hashrate contracts, while columns represent specific trading days. Cell values indicate the average daily mid-market price, except for spot prices.
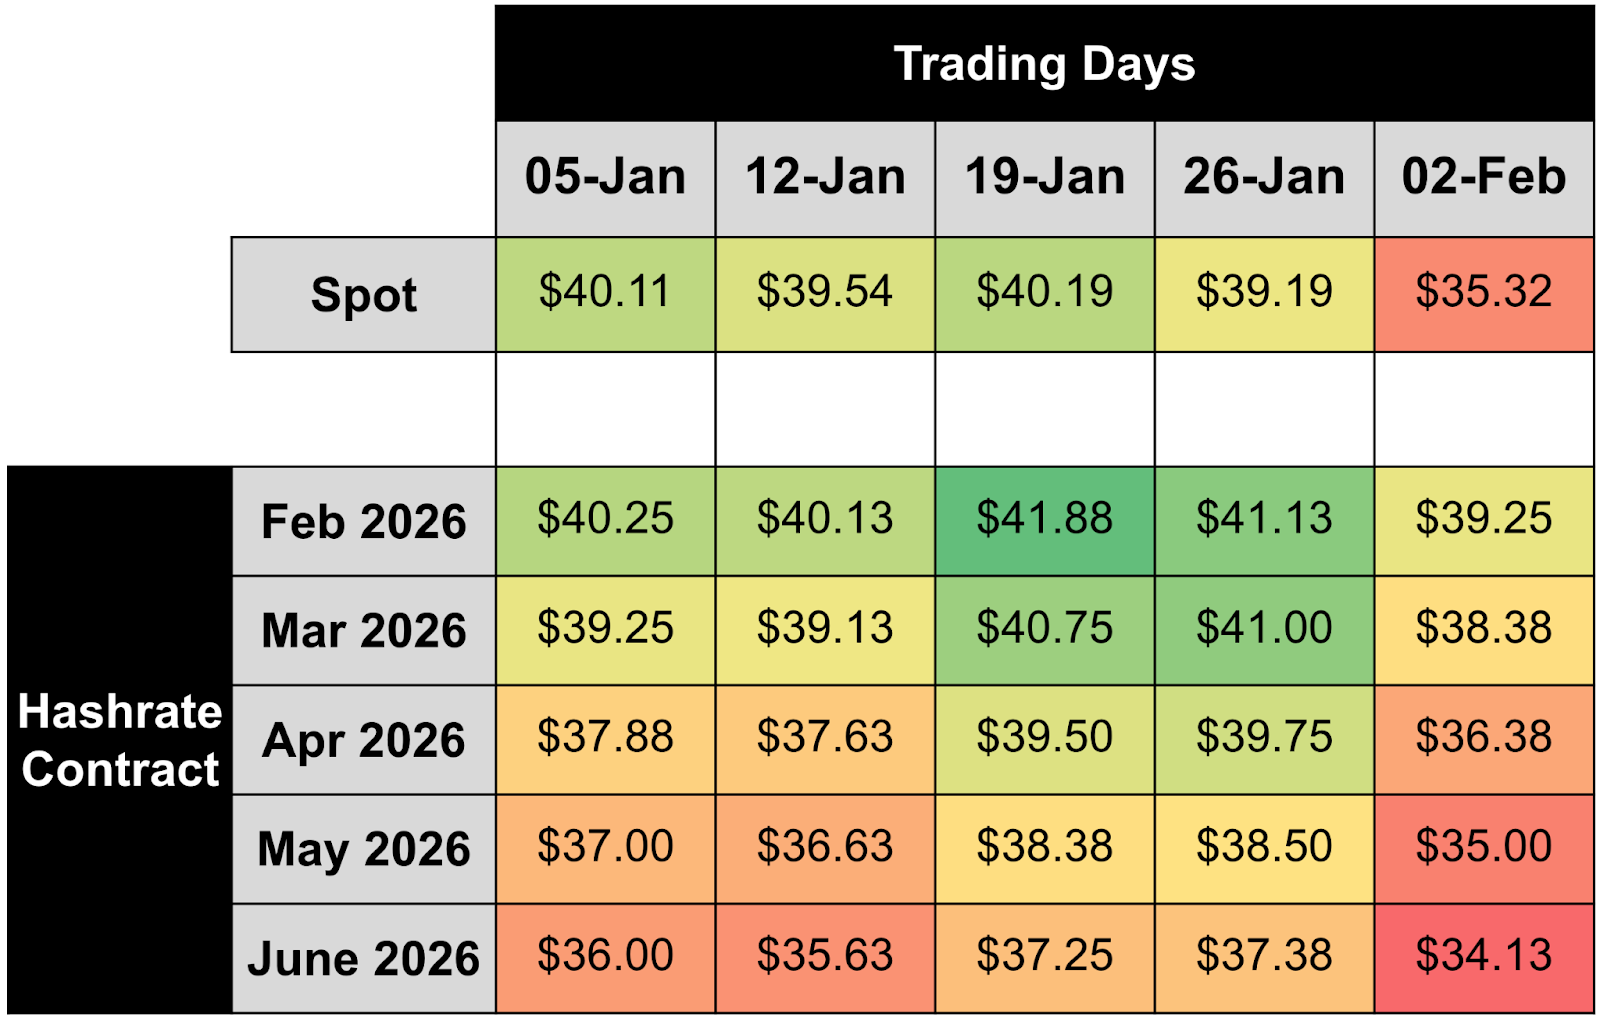
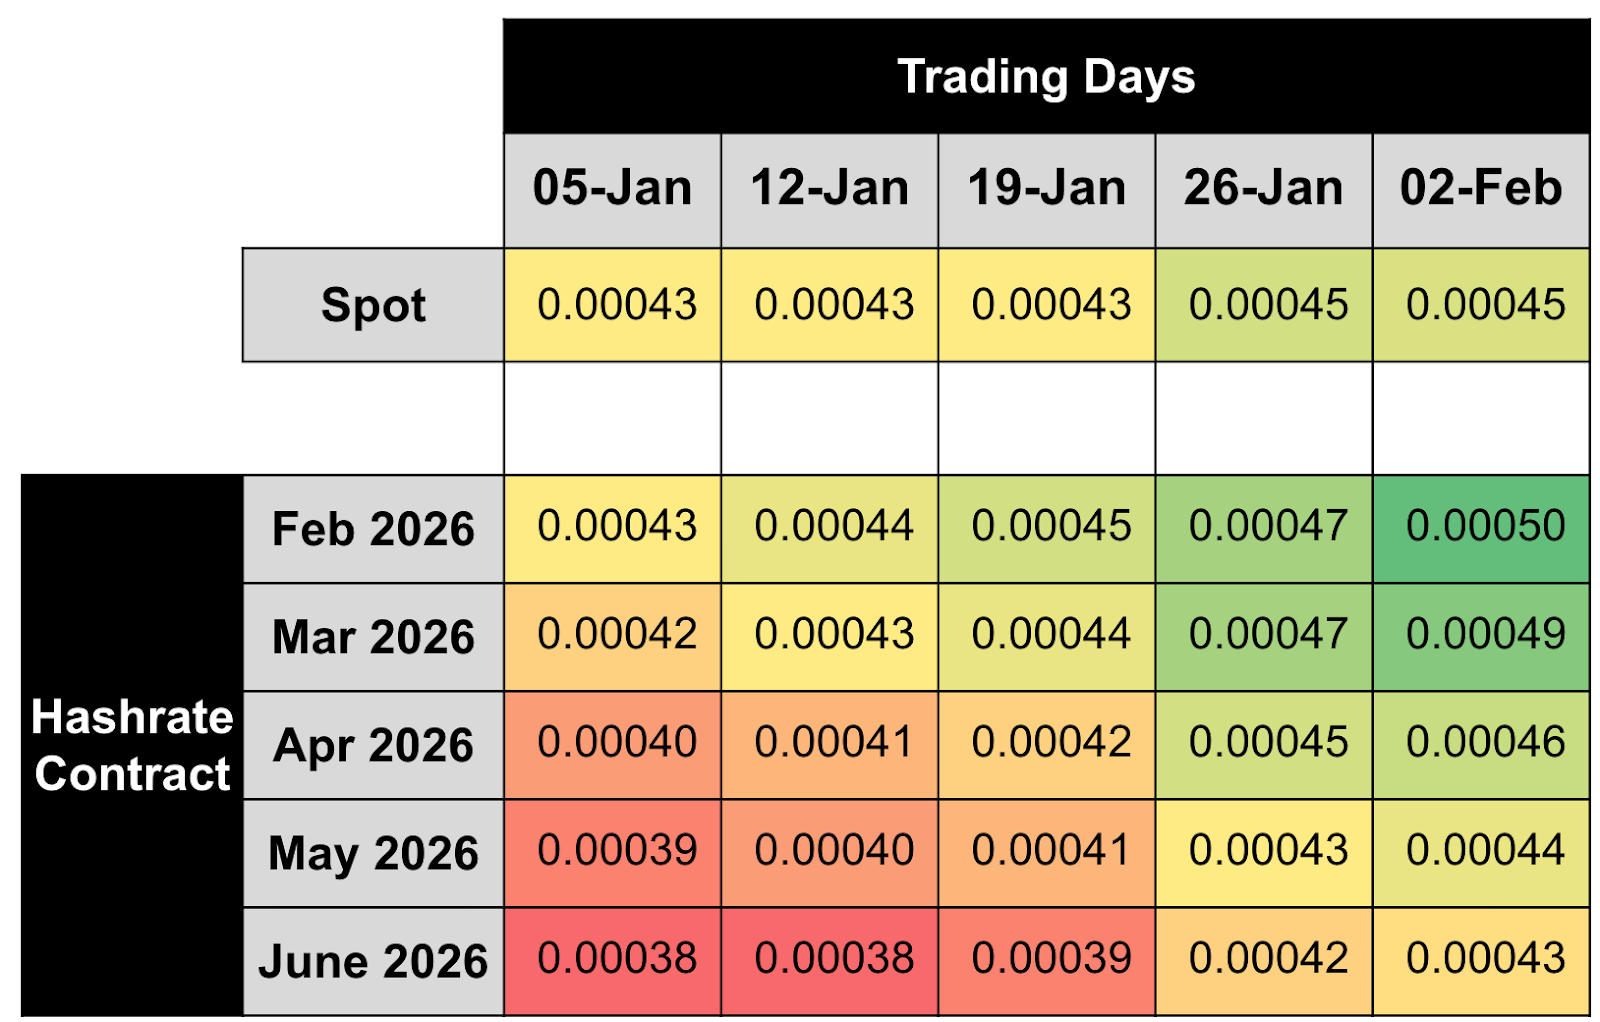
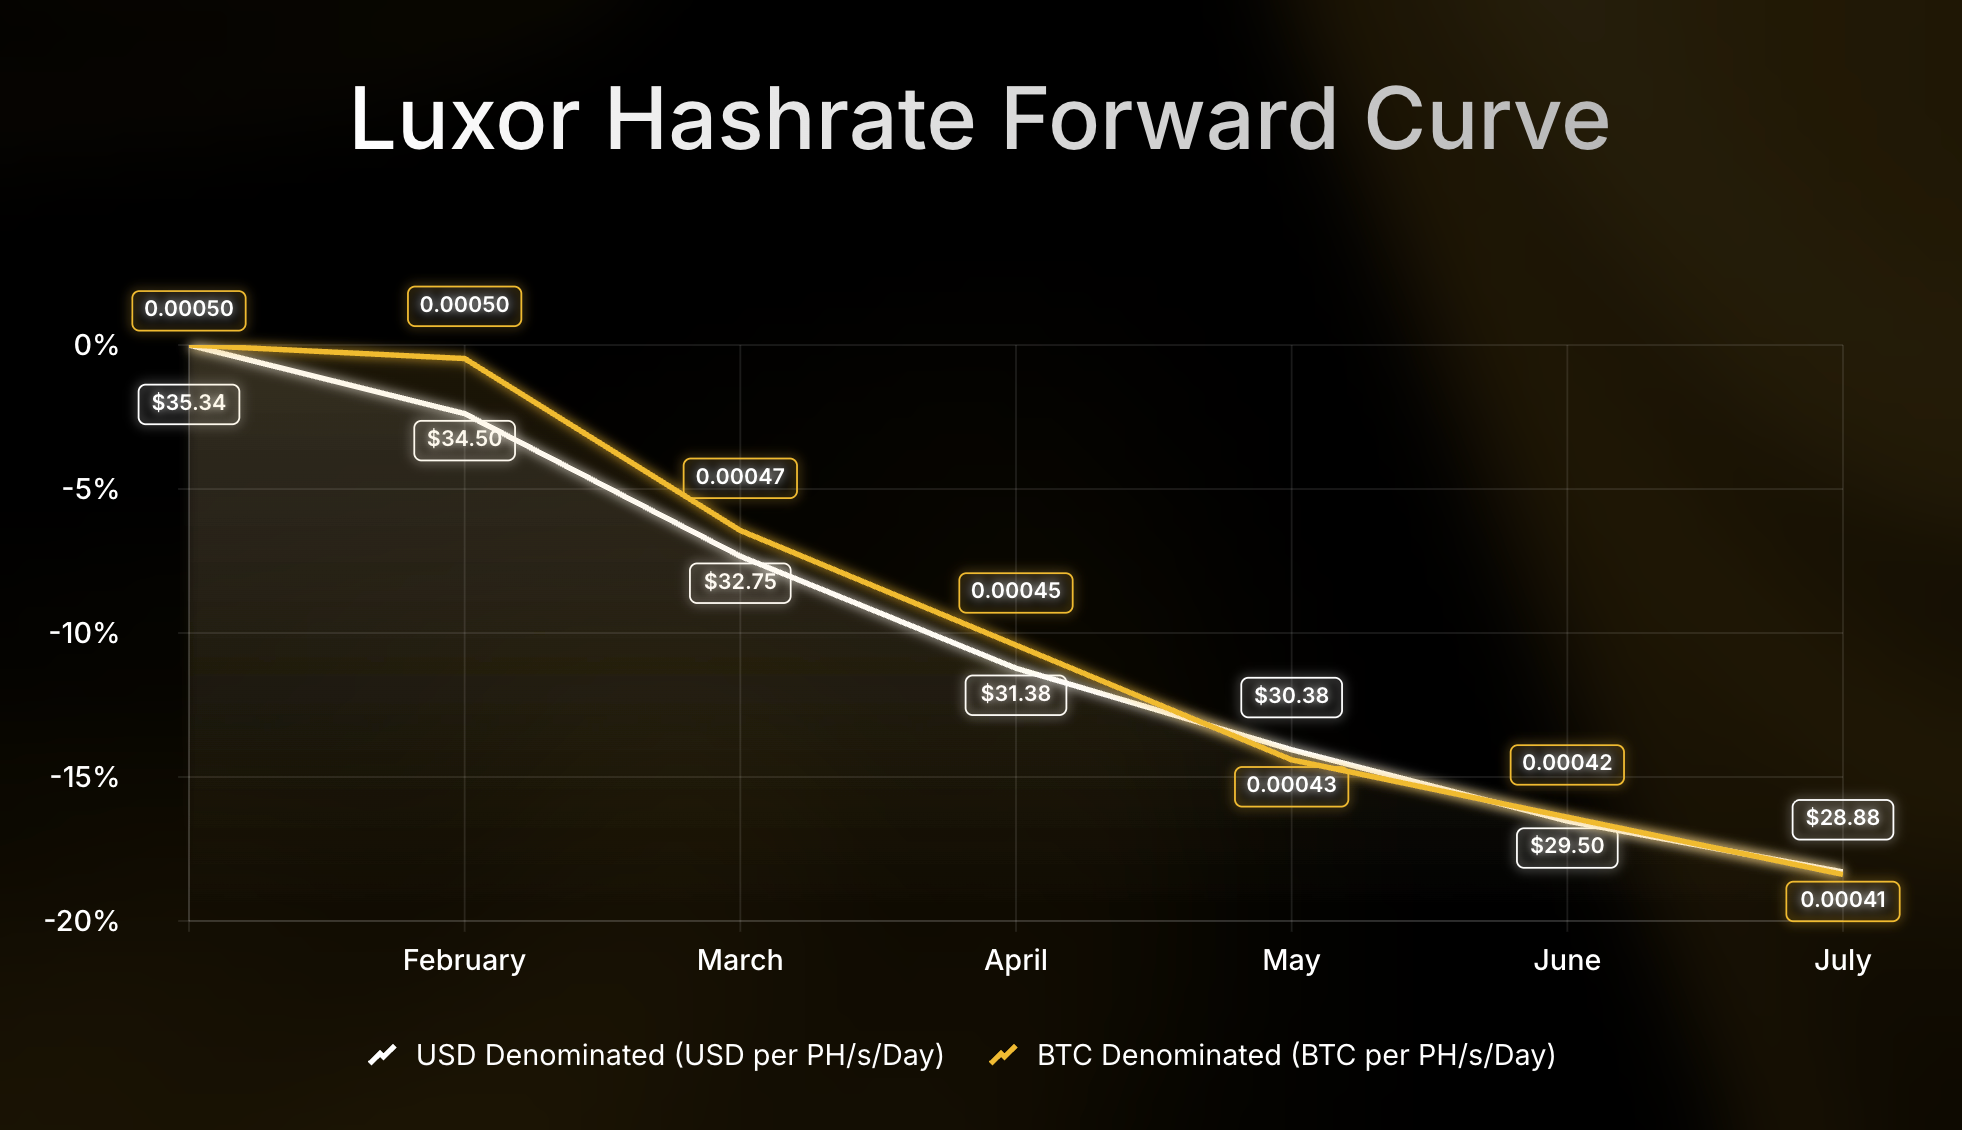
In early January, USD and BTC curves were aligned — spot to February modestly higher, then flat-to-lower further out. As news of a major winter storm built mid-month — raising expectations for curtailment across U.S. mining regions — the market increasingly priced in another downward difficulty adjustment in early February, lifting the front months and pulling expectations higher across much of the forward curve for BTC hashprice.
While expected difficulty relief supported the next few months versus spot, USD hashprice is heavily influenced by the BTC/USD exchange rate; once BTC peaked mid-month and slid into month-end, the crashing BTC price capped upside in further-out USD hashrate forwards. As a result, near-term USD expectations remained higher than spot, but the back end of the curve steepened, with May and June around $35.00 and $34.13.
By dividing USD contract hashprice values with BTC contract values, we can back out implied BTC price expectations expressed by the forward hashrate market.
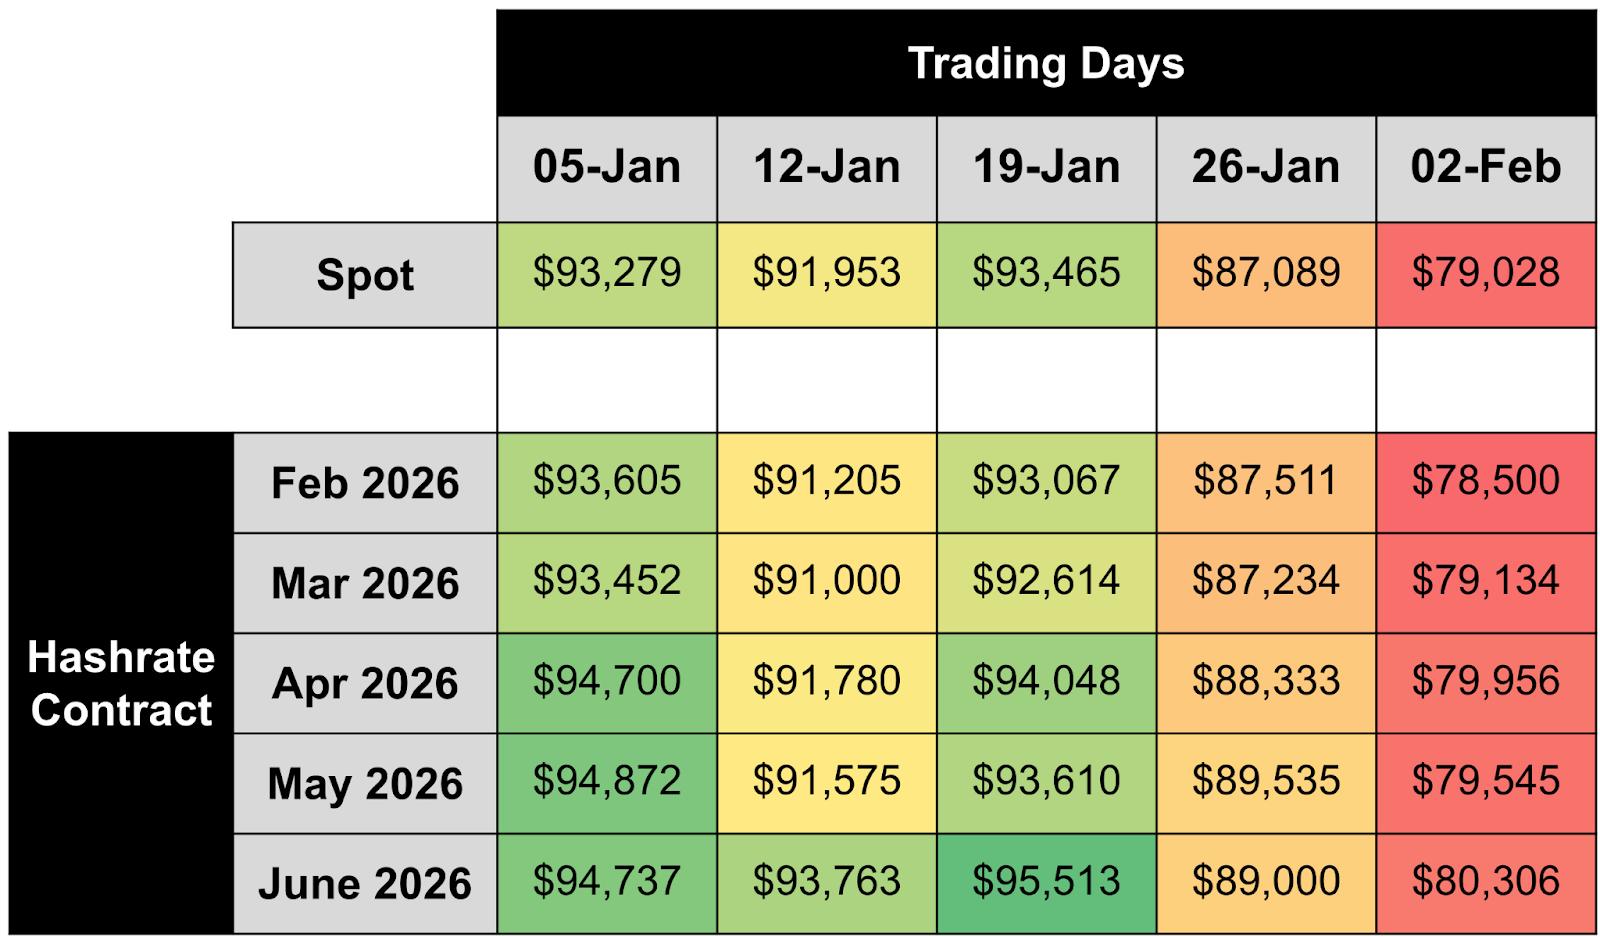
Implied BTC price expectations fell sharply starting mid-month and into early February. Despite the drop, the implied curve generally traded in contango, with occasional front-month discount versus spot.
By making an assumption for transaction fees, we can also calculate changes in implied network difficulty and hashrate expectations expressed by the forward hashrate market.
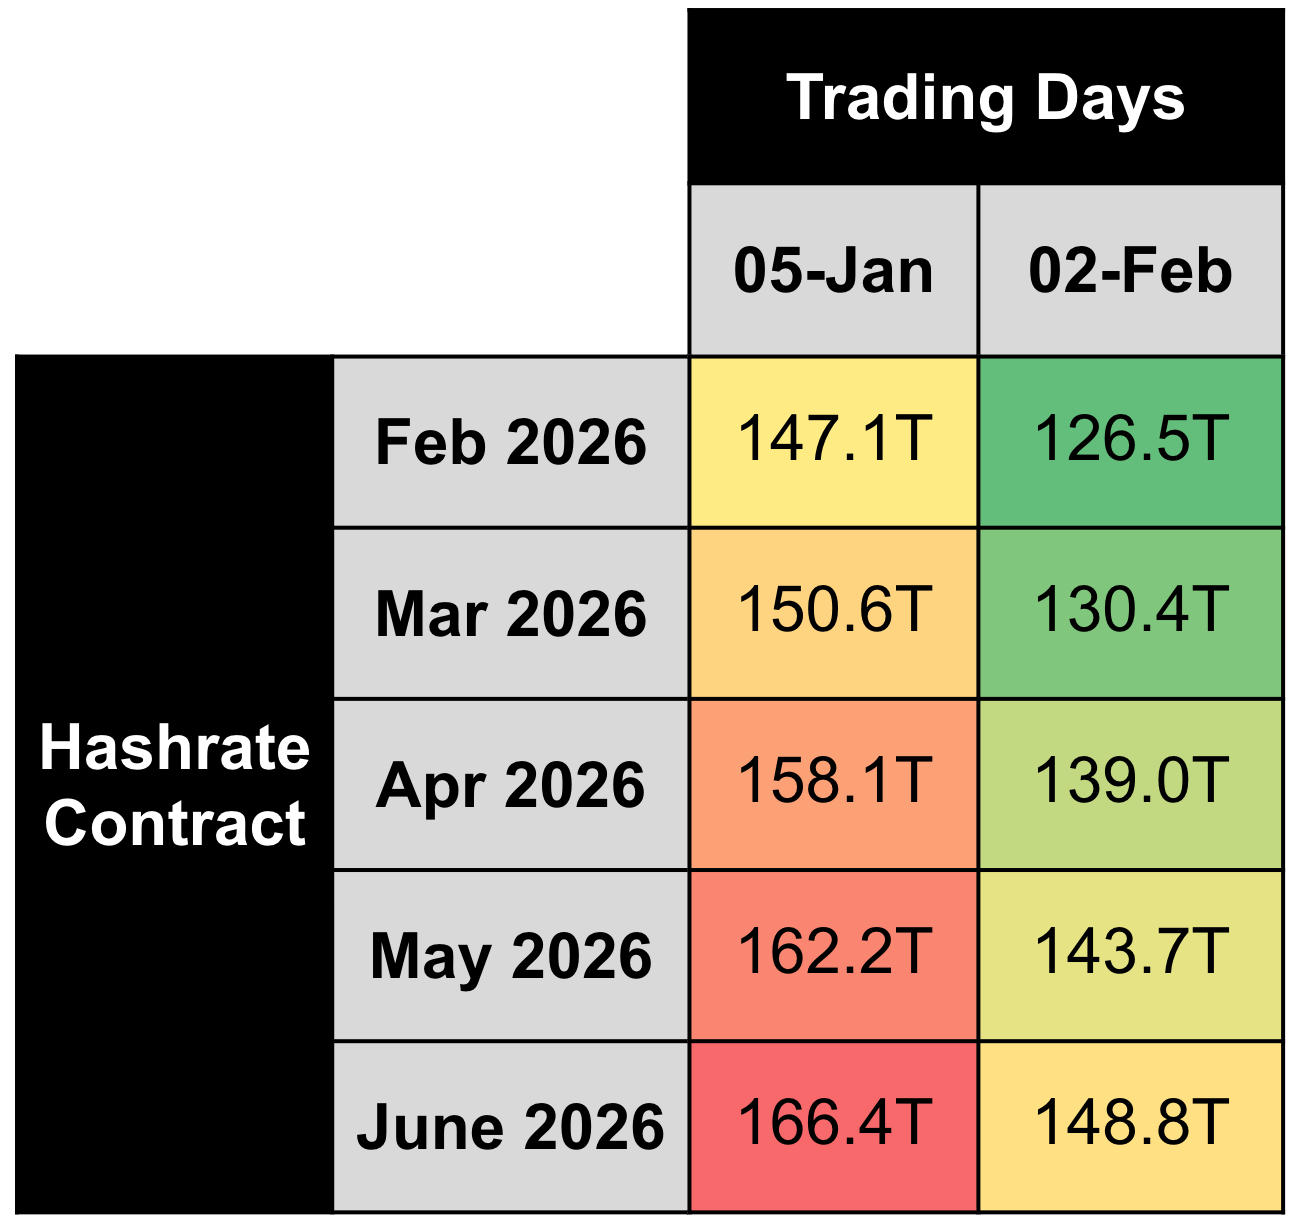
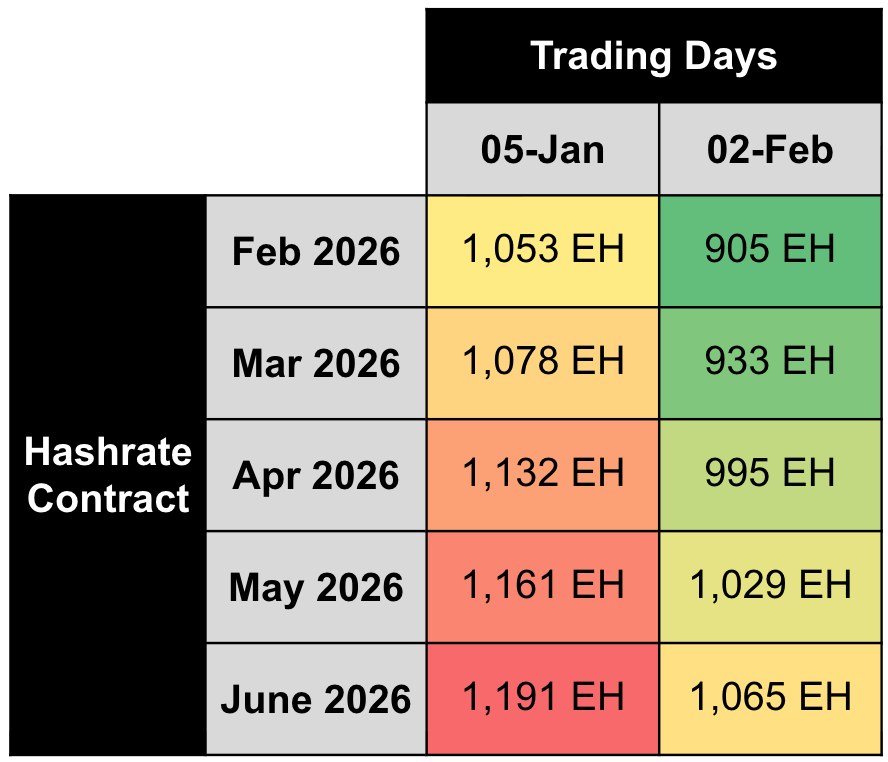
Note: figures assume 0.019 BTC per block transaction fees
The forward hashrate market now anticipates slower hashrate and network difficulty growth over the next five months. This repricing, which followed the recent BTC price correction, reflects slower near-term network expansion. Implied difficulty for the February–June 2026 contracts dropped by roughly 11% to 14% between January 5th and February 2nd.
Concluding Thoughts and Looking Ahead
As of early February, USD hashprice set a new all-time intraday low of $27.89 on February 5, and while the late-month storm-driven curtailment induced another downward difficulty adjustment of -11.16% to 125.86T on February 7, the relief may be short-lived as curtailed hashrate returns and BTC price remains around $70,000 as of this writing.
In this environment, the hashrate forward market provides four effective use cases:
- Sell forward to hedge hashprice. Keep mid-gen fleets online by locking in cashflow, and maintain healthy margins on new-gen fleets.
- Sell forward to finance fleet upgrades.
- Buy forward to express a bullish hashprice view (BTC up / difficulty down / fees up) without deploying physical infrastructure.
- Buy forward to secure a lower all-in hashcost for unprofitable old-gen fleets operating above the forward hashprice.
Looking forward, Luxor’s Hashrate Forward Market is pricing in an average hashprice of $31.23 or 0.00045 BTC per PH/s/Day over the next six months. Sellers can currently secure this hashprice while buyers have the opportunity to lock in the same hashcost through July 2026.
If you’d like to learn more about Luxor’s Bitcoin mining derivatives, please reach out to [email protected] or visit https://www.luxor.tech/derivatives.
Disclaimer
This content is for informational purposes only, you should not construe any such information or other material as legal, investment, financial, or other advice. Nothing contained in our content constitutes a solicitation, recommendation, endorsement, or offer by Luxor or any of Luxor’s employees to buy or sell any derivatives or other financial instruments in this or in any other jurisdiction in which such solicitation or offer would be unlawful under the derivatives laws of such jurisdiction.
There are risks associated with trading derivatives. Trading in derivatives involves risk of loss, loss of principal is possible.


Hashrate Index Newsletter
Join the newsletter to receive the latest updates in your inbox.


