Global Hashrate Heatmap Update: Q2 2026
The latest update to Hashrate Index’s Global Hashrate Heatmap.
This Q2 2026 update to Hashrate Index’s Global Hashrate Heatmap highlights how Bitcoin mining power shifts across the globe, with geographic distribution revealing both stability among leaders and dramatic movement in emerging markets. This dataset tracks country-level market share and hashrate (EH/s), offering miners, investors, and industry observers critical insight into the evolving mining landscape.
Bitcoin's mining landscape continues to evolve as economic cycles reshape which regions can support operations sustainably. While concentration remains high, emerging markets are testing viability under current market conditions, and policy frameworks increasingly influence operator capital deployment decisions.
TLDR
- Global hashrate declined to 1,004 EH/s (Q2 2026) from 1,066 EH/s (Q1 2026): -5.8% QoQ decline reflects ongoing down-cycle. Bitcoin price decline (~50% from October peak) pushed hashprice to all-time lows, forcing older equipment offline. Mining profitability, not energy or policy, is the primary driver of current geographic shifts.
- Mining concentration stable at 65.2% (top 3); composition shifting as marginal equipment (25+ J/TH) goes offline, modern hardware (14–17 J/TH) deploys selectively
- Pakistan moderated from +1,233% YoY to ~3 EH/s; Kyrgyzstan sustained +167% QoQ; Ethiopia holds #8 despite permit freeze
- Policy clarity increasingly matters in down-cycles, but only as a secondary factor to machine profitability
Global Hashrate Decline: The Economic Cycle Takes Center Stage
Bitcoin mining's most important story in Q2 2026 is not geographic—it's economic. The 30-day simple moving average (SMA) network hashrate declined to 1,004 EH/s in Q2 2026, down from 1,066 EH/s in Q1 2026, representing a -5.8% quarter-over-quarter decline.
This contraction reflects the current Bitcoin market cycle. Bitcoin price dropped ~50% from October 2025's ~$124K peak to February 2026's ~$65K lows, compressing hashprice to all-time lows (~$27.89/PH/s/day). At these levels, older-generation equipment (25+ J/TH efficiency) operates at negative gross margins, forcing shutdown. We estimate 252 EH/s of marginal capacity sits offline—most legacy hardware already retired.
This pattern is cyclical. Mining profitability drives machine deployment and retirement more than energy costs or regulatory frameworks. Geographic shifts observed in Q1 and Q2 reflect operators testing which regions can sustain operations once the down-cycle ends and hashprice normalizes. For deeper context on mining economics during this period, see "Why is Bitcoin Mining Hashrate Falling?" and the February 2026 Lookback Series.
Geopolitical events affecting energy markets (regional conflicts, policy shifts) may influence mining economics over time, though effects typically lag initial events. See "Oil Shocks and the Bitcoin Network" for analysis of energy market dynamics and their eventual impact on mining.
Top 10 Countries by Market Share (Q2 2026)
Bitcoin mining remains geographically concentrated, with the top three countries commanding approximately 65% of global hashrate:
- United States — 37.4% (~375 EH/s)
- Russia — 16.9% (~170 EH/s)
- China — 12.0% (~120 EH/s)
- Paraguay — 4.3% (~43 EH/s)
- United Arab Emirates — 3.0% (~30 EH/s)
- Oman — 3.0% (~30 EH/s)
- Canada — 2.6% (~26 EH/s)
- Ethiopia — 2.5% (~25 EH/s)
- Kazakhstan — 1.8% (~18 EH/s)
- Indonesia — 1.8% (~18 EH/s)
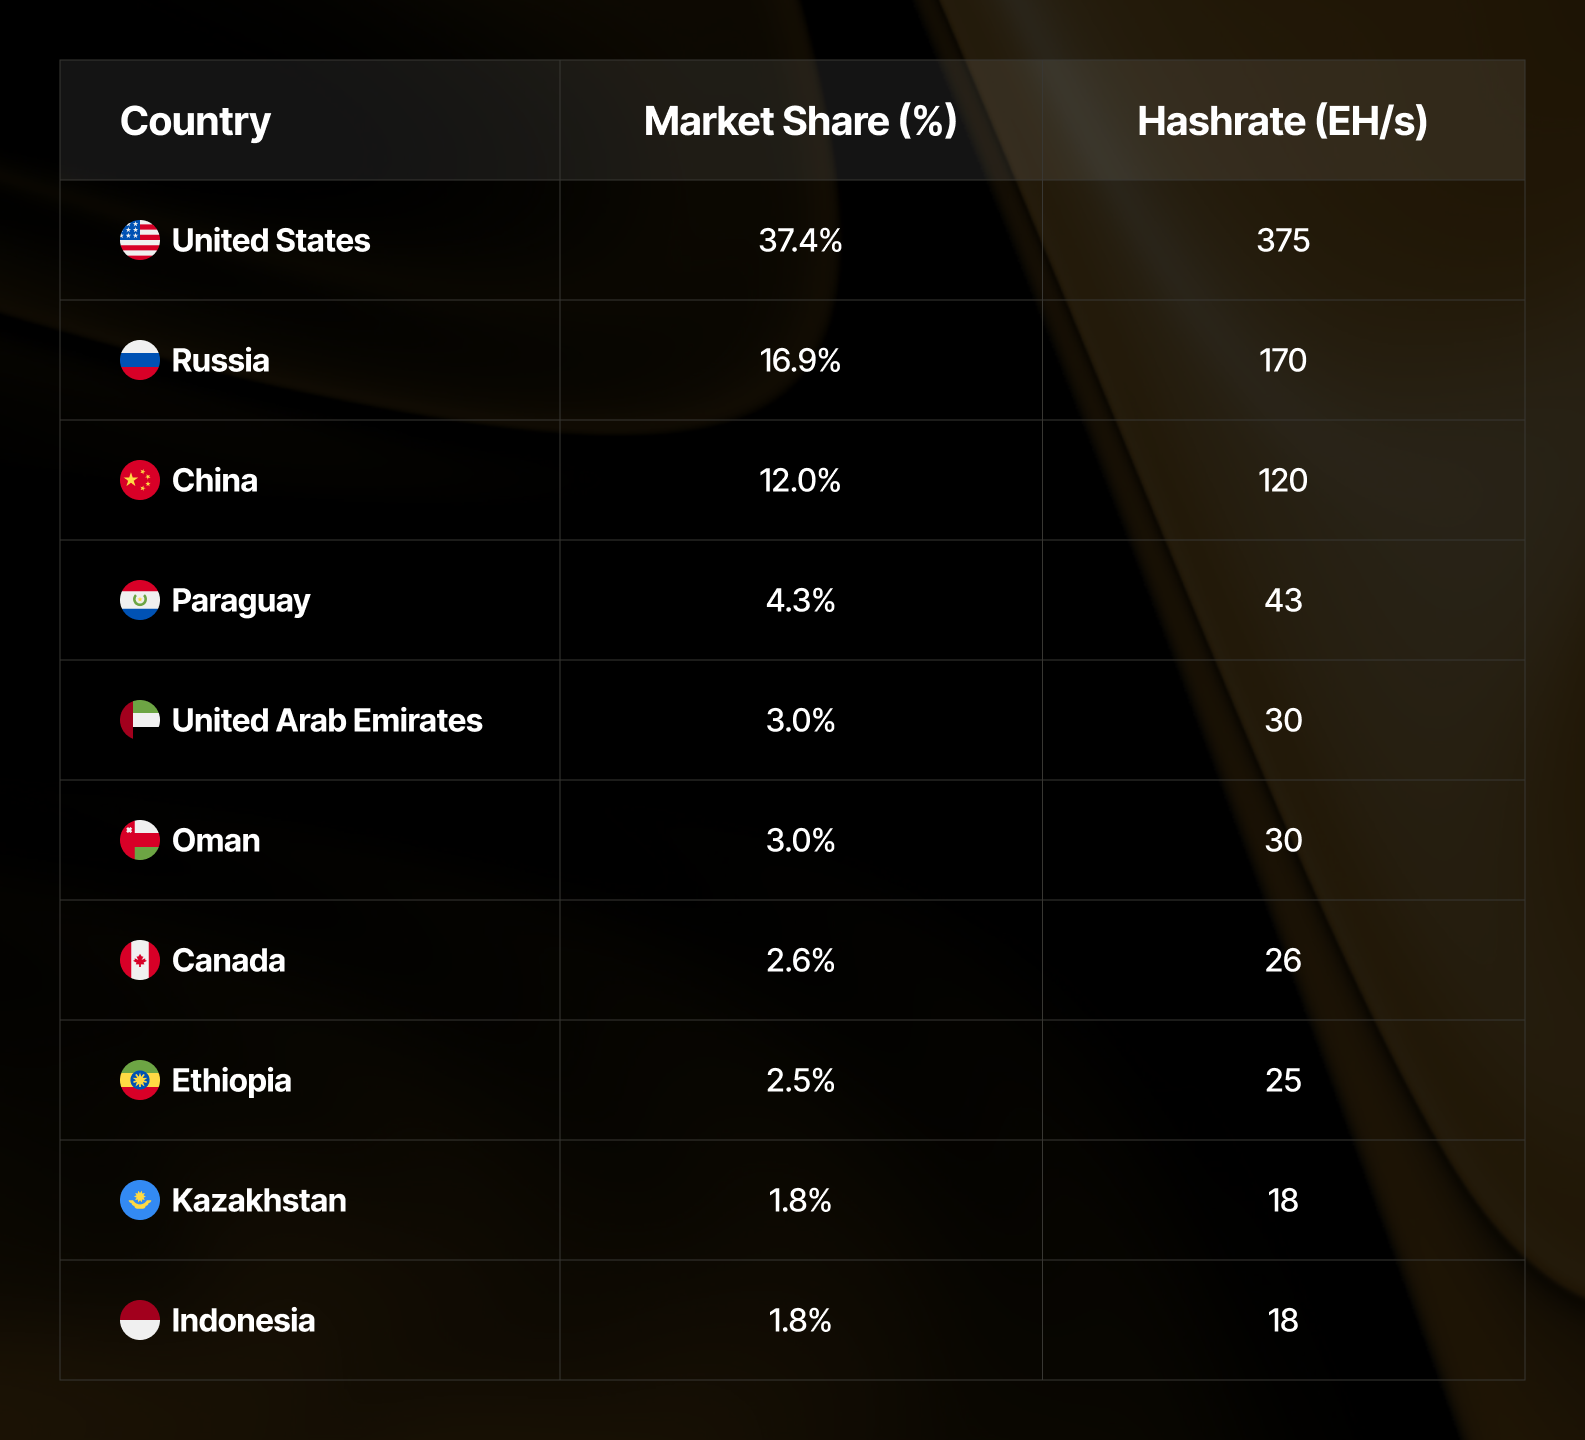
Together, the top three countries control approximately 65.6% of global hashrate. While this shows continued concentration, Ethiopia's continued rise within the top 10 (now at #8, up from #10 a year ago) and the strengthening positions of Middle Eastern and Southeast Asian countries signal gradual diversification.
Quarter-over-Quarter Movers
Comparing global market share Q2 2026 (April 2026) vs. Q1 2026 (January 2026):
Top Gainers:
- Kyrgyzstan: Maintained hashrate but gained ~0.4% of global hashrate
- Paraguay: Maintained hashrate with ~4.3 EH/s, increased 0.3% QoQ to 4.3%
Notable Decliners:
- China: -1.35% QoQ following December 2025 Xinjiang enforcement actions (~13% capacity offline)
- Iran: -0.6% QoQ from geopolitical conflict in the region
- United States: Slight decline (-0.13% QoQ) despite +3% YoY, reflecting equipment retirement and margin-driven curtailment and miners pivoting to AI/HPC
- Canada: Modest pullback (-0.13% QoQ), but +0.83% YoY suggests operational adjustments with some miners pivoting to AI/HPC, and tightening regulation in Quebec
Multi-Quarter Trends (Q1 2025 → Q2 2026)
Looking across the past 18 months reveals distinct regional patterns:
Consistent risers: Kyrgyzstan and Ethiopia have established sustainable growth trajectories, gaining ~1 percentage point YoY despite down-cycle conditions. This suggests operator confidence in these regions' long-term viability.
Emerging growth: Pakistan posted strong +1,233% YoY growth (0.3 → 4 EH/s) in Q1 but moderated to ~3 EH/s in Q2. Bolivia similarly showed explosive growth (+2,400% YoY) followed by potential Q2 pullback.
Stable anchors: The U.S. continues adding hashrate (+39% YoY to 375 EH/s), though growth is composition-shifting—new modern equipment offsetting forced-offline legacy machines.
Persistent pressure: Russia has lost market share in recent quarters despite positive YoY growth, while Argentina continues declining (-42% YoY).
Standout Countries: Growing Despite Down-Cycle
While most regions contracted or plateaued during Q2's down-cycle, several countries bucked the trend through modern equipment deployment and energy advantages:
Kyrgyzstan (+300% YoY, +167% QoQ): Sustained growth despite down-cycle hashprice pressure indicates new mining operations with efficient, modern hardware coming online.
Paraguay (+54% YoY): Maintains stable 4.3% market share with consistent growth, suggesting professional operators with newer equipment weathering low hashprice conditions.
Laos (+100% YoY): Hydroelectric-powered operations scaling steadily, unaffected by hashprice volatility due to abundant, low-cost energy.
Finland (+100% YoY): Cold climate advantages enabling profitable mining even as legacy hardware goes offline globally.
These countries' growth during a period when global hashrate contracted -5.8% QoQ indicates their operations run on newer, more efficient hardware and benefit from genuine energy advantages—not policy accommodation. Machines in these regions can stay online profitably even as older equipment shuts down elsewhere.
Regional Dynamics
North America: The U.S. maintains dominance at 37.4% despite margin pressure from the recent down-cycle. Growth is characterized by deployment of modern hardware alongside retirement of legacy equipment. Canada shows similar dynamics: slight QoQ pullback but positive YoY growth, reflecting optimization rather than exodus.
Europe & Central Asia: Kyrgyzstan's sustained growth (+300% YoY, +167% QoQ) stands in sharp contrast to similar-latitude countries. The differentiation appears to be policy—Kyrgyzstan's parliament approved transparent mining regulations in mid-2025, attracting capital where other regions offer ambiguity. Russia remains steady at 16.9% but shows flat YoY growth, constrained by sanctions and regulatory uncertainty.
Asia-Pacific: China at 11.95% demonstrates enforcement-adaptation equilibrium. December 2025's Xinjiang shutdowns (~13% QoQ decline) reflected regulatory action; YoY growth of +0.91% indicates operators adapted via relocation rather than exit. Indonesia's steady rise to 1.8% (+5% YoY) shows Southeast Asia capturing some diversification away from China, leveraging lower regulatory friction and hydroelectric resources.
Middle East: Geopolitical conflict in the region has had a clear impact on Iran (loss of 7 EH/s QoQ), and it could have a ripple effect for neighboring countries. UAE and Oman each hold 3% of global hashrate with flat to modest growth patterns. Both reflect government-backed, long-term infrastructure positioning rather than competitive expansion urgency.
Latin America: Paraguay remains stable at 4.3%, anchoring the region with professional operators. Brazil shows signs of serious infrastructure investment (+133% YoY to 3.5 EH/s). Argentina's continued decline (-42% YoY) reflects macroeconomic instability's impact on mining economics.
Africa: Ethiopia's climb to #8 globally (2.5% hashrate) is remarkable given the mid-2025 permit freeze on new mining. Clear policy design—freeze new permits, honor existing approvals—creates operator confidence. Growth validates Grand Ethiopian Renaissance Dam's hydroelectric capacity, though the permit freeze slows future expansion.
Emerging Players (<1% Global Share)
Several smaller markets showed meaningful growth trajectories:
- Laos: ~0.9% of global hashrate, powered entirely by hydroelectric capacity
- Finland: 8 EH/s (+100% YoY), benefiting from cold climate advantages
- Malaysia: 6.5 EH/s, emerging as potential Southeast Asian hub
- Brazil: 3.5 EH/s (+133% YoY), signal of serious infrastructure investment if sustained
- Nigeria: 1 EH/s, Africa's most populous nation beginning to participate
Key Takeaways
- Global hashrate decline is the headline: Q2's 1,004 EH/s represents -5.8% QoQ contraction, driven by mining profitability, not policy or geopolitical conflict. Bitcoin's market cycle, not geography, determines whether machines stay online. This is the context for nearly all geographic shifts.
- Concentration stability masks equipment churn: 65.2% held by top 3 remains flat, but composition is changing—marginal legacy equipment forced offline, modern hardware deployed selectively to regions where it can remain profitable long-term.
- Modern equipment and energy advantages transcend down-cycles: Kyrgyzstan, Paraguay, Laos, and Finland grew YoY despite Q2's hashrate contraction, proving that regions with newer hardware and genuine energy cost advantages remain profitable even at all-time-low hashprice. These standouts didn't lose capacity because their operations can sustain profitability through market cycles.
- Policy matters as a secondary factor: Kyrgyzstan's sustained growth and Ethiopia's confidence despite permit freeze show regulatory clarity helps operators make long-term capital decisions. But only in regions where machines can actually be profitable. Policy doesn't overcome negative margins.
- Emerging market moderation signals sustainability realism: Pakistan's boom-to-pullback, Bolivia's volatility, and Brazil's test phase all reflect operators evaluating true long-term viability, not just near-term arbitrage. Q3 and Q4 will clarify which are real buildouts.
- Network scaling continues despite contraction: The Bitcoin network persists at ~1,000 EH/s through multiple down-cycles because block rewards drive new machine deployment. The question is always which regions host them, which this heatmap helps answer.
- Geopolitical shocks create localized disruption, not systemic risk: Iran's loss of ~7 EH/s QoQ from regional conflict demonstrates mining's vulnerability to geopolitical events. However, the impact was contained to Iran; neighboring UAE and Oman remained stable. Global hashrate at ~1,000 EH/s persists because no single region controls enough capacity to threaten network continuity. Regional disruptions redistribute hashrate rather than destroy it.
The Global Hashrate Heatmap is updated quarterly. Access the full interactive dataset and historical comparisons under Data > Network Data > Global Hashrate Heatmap.
Review previous quarterly analysis:
— Happy Hashing!
About Luxor Technology Corporation
Luxor delivers hardware, software, and financial services that power the global compute and energy industry. Its product suite spans Bitcoin Mining Pools, ASIC Firmware, Hardware trading, Hashrate Derivatives, Energy services, a Miner Management software, Commander, and a bitcoin mining data platform, Hashrate Index.
Disclaimer
This content is for informational purposes only, you should not construe any such information or other material as legal, investment, financial, or other advice.


Hashrate Index Newsletter
Join the newsletter to receive the latest updates in your inbox.


