Global Hashrate Heatmap Update: Q1 2026
The latest update to Hashrate Index’s Global Hashrate Heatmap.
This Q1 2026 update to Hashrate Index’s Global Hashrate Heatmap highlights how Bitcoin mining power shifts across the globe, with geographic distribution revealing both stability among leaders and dramatic movement in emerging markets. This dataset tracks country-level market share and hashrate (EH/s), offering miners, investors, and industry observers critical insight into the evolving mining landscape.
Top 10 Countries by Market Share (Q1 2026)
Bitcoin mining remains highly concentrated, with the top handful of countries commanding the majority of global hashrate:
- United States — 37.5% (~400 EH/s)
- Russia — 16.4% (~175 EH/s)
- China — 11.7% (~125 EH/s)
- Paraguay — 4.0% (~43 EH/s)
- United Arab Emirates — 3.1% (~33 EH/s)
- Oman — 3.0% (~32 EH/s)
- Canada — 2.6% (~28 EH/s)
- Ethiopia — 2.6% (~27.5 EH/s)
- Kazakhstan — 2.1% (~22 EH/s)
- Indonesia — 1.9% (~20 EH/s)
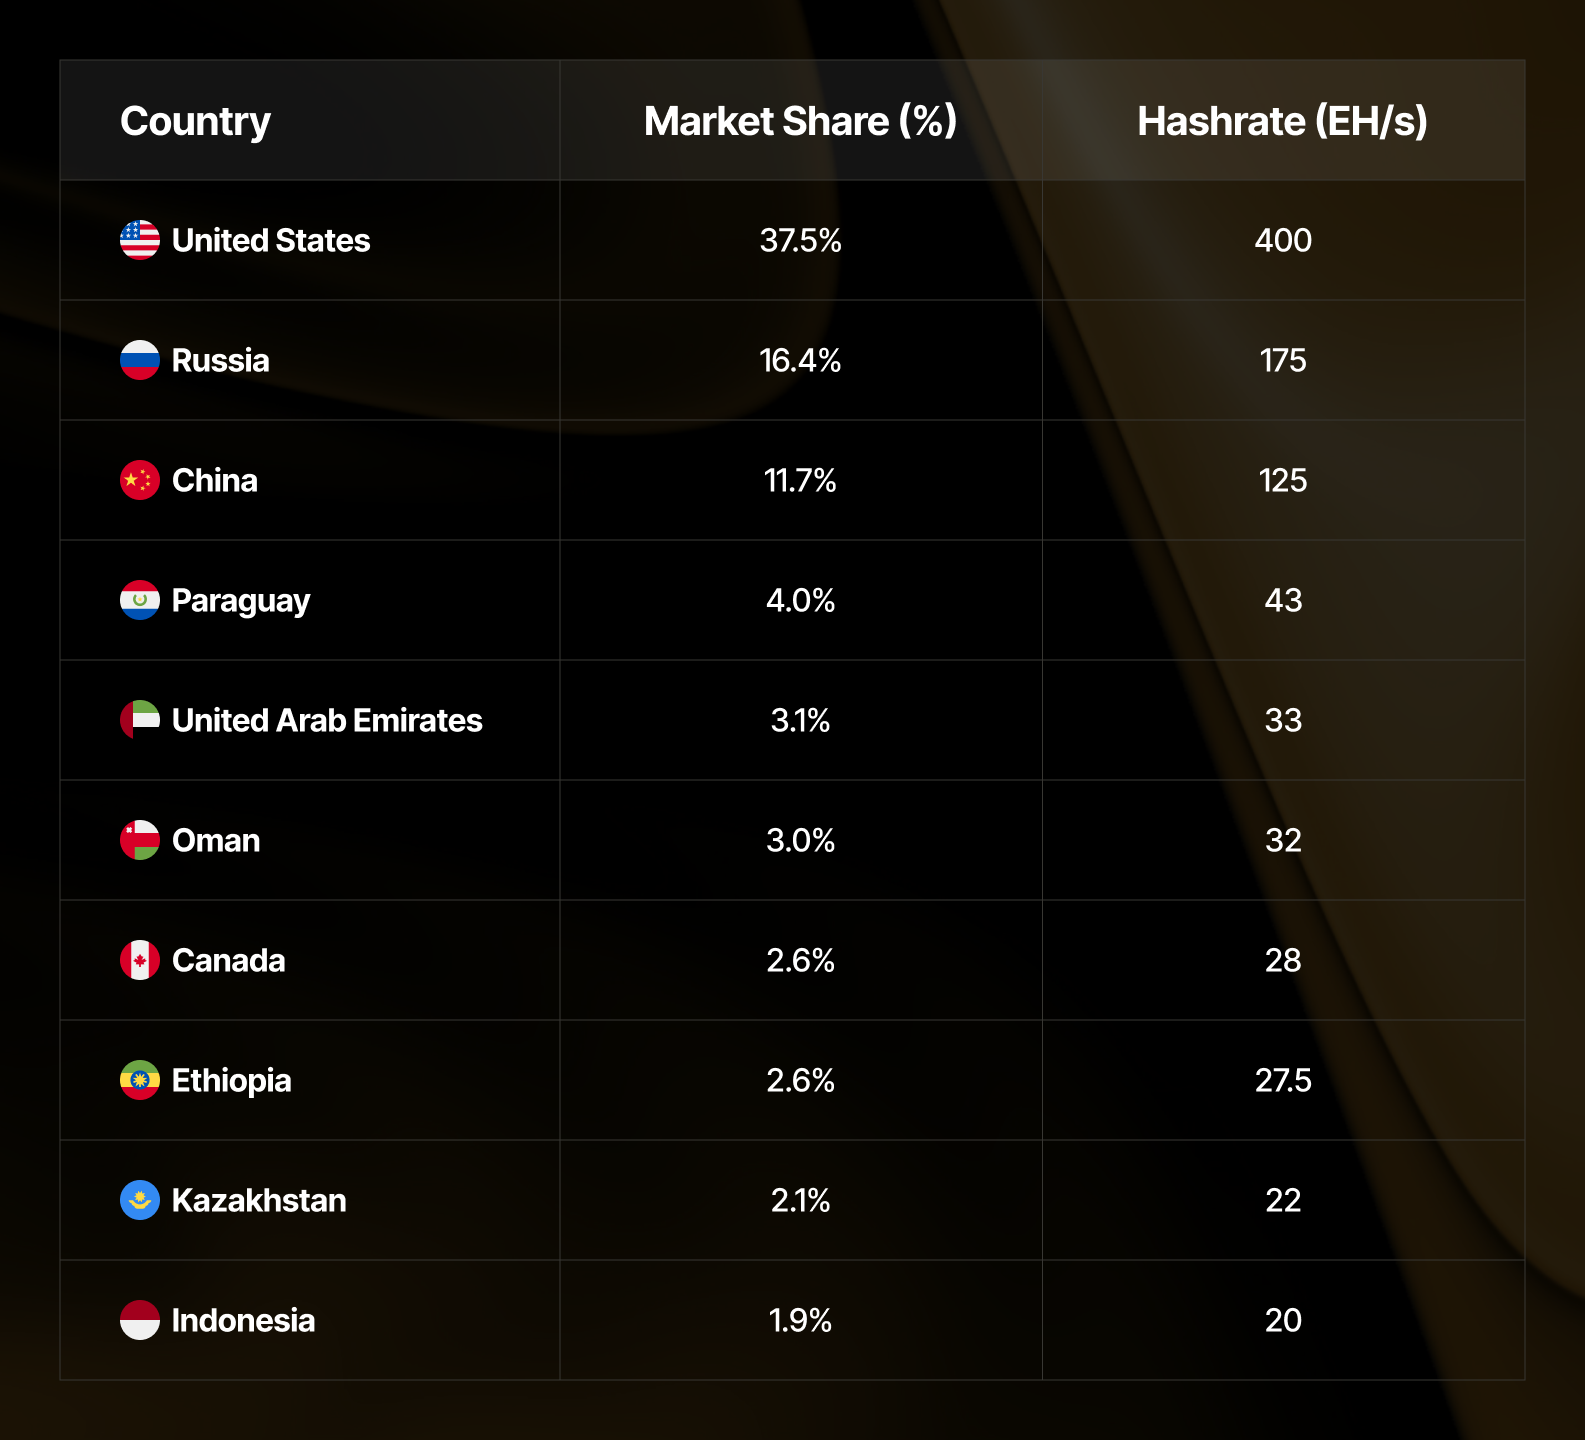
Together, the top three countries control approximately 65.6% of global hashrate. While this shows continued concentration, Ethiopia's continued rise within the top 10 (now at #8, up from #10 a year ago) and the strengthening positions of Middle Eastern and Southeast Asian countries signal gradual diversification.
Quarter-over-Quarter Movers
Comparing Q1 2026 to Q4 2025, mining activity shows both incremental adjustments and dramatic shifts in specific markets.
Top QoQ Gainers (by hashrate growth)
- Pakistan: +1,233% — 0.3 EH/s → 4 EH/s
- Kyrgyzstan: +167% — 1.5 EH/s → 4 EH/s
- Latvia: +50% — 0.5 EH/s → 0.75 EH/s
- Ethiopia: +38% — 20 EH/s → 27.5 EH/s
- Nigeria: +25% — 0.8 EH/s → 1 EH/s
Notable QoQ Declines
- Bolivia: -17% — 3 EH/s → 2.5 EH/s (after prior growth)
- China: -14% — 145 EH/s → 125 EH/s (amid mining crackdowns)
- Argentina: -13% — 4 EH/s → 3.5 EH/s
- Canada: -7% — 30 EH/s → 28 EH/s
The quarter-over-quarter data reveals measured growth in established markets while emerging regions test their competitive advantages.
Year-over-Year Perspective: The Long View
Looking at annual changes provides insight into sustained trends versus quarterly volatility:
Biggest YoY Gainers
- Bolivia: +2,400% — 0.1 EH/s → 2.5 EH/s
- Pakistan: +1,233% — 0.3 EH/s → 4 EH/s
- Ecuador: +400% — 0.2 EH/s → 1 EH/s
- Kyrgyzstan: +300% — 1 EH/s → 4 EH/s
- Brazil: +167% — 1.5 EH/s → 4 EH/s
- Ethiopia: +129% — 12 EH/s → 27.5 EH/s
Year-over-Year Declines
- Argentina: -42% — 6 EH/s → 3.5 EH/s (economic instability)
- Uruguay: -95% — 1.0 EH/s → 0.05 EH/s (increasing electricity costs)
- DR Congo: -40% — 0.5 EH/s → 0.3 EH/s (costs, regulatory scrutiny push)
The year-over-year perspective reveals that while quarter-to-quarter movements can be volatile, countries like Ethiopia, Pakistan, and several Latin American nations are building sustained mining operations rather than experiencing temporary spikes.
Regional Dynamics
North America
The United States maintains its dominant position at 37.5%, showing measured growth with a 3% increase quarter-over-quarter (from 389 EH/s to 400 EH/s) and a remarkable 39% year-over-year surge (from 288 EH/s). This consistency reflects the maturation of the American mining industry, with established operators expanding incrementally. Canada experienced a 7% decline to 28 EH/s (down from 30 EH/s), though still shows 17% year-over-year growth, suggesting some short-term operational adjustments while maintaining long-term expansion.
Asia
China has stabilized at 11.7% of global hashrate, though this figure masks significant volatility. After a notable rebound in Q4 2025 that garnered international attention, the country experienced major shutdowns in Xinjiang in December 2025, with approximately 400,000 rigs going dark. The quarter-over-quarter decline of 14% (from 145 EH/s to 125 EH/s) reflects these enforcement actions, though year-over-year growth of 14% suggests underground operations continue adapting to regulatory pressure.
Indonesia's 18% quarterly gain (+66% YoY) positions it as Southeast Asia's rising star. The country replaced Norway in the top 10 back in Q3 2025 and has continued expanding its position. Meanwhile, Laos continues leveraging its hydroelectric resources with steady growth (+13% QoQ, +100% YoY).
Middle East
The United Arab Emirates and Oman remain strong regional anchors at 3.1% and 3.0% respectively. The UAE showed flat quarterly performance but maintains steady 10% year-over-year growth, while Oman posted 7% quarterly growth and 28% annual increase. Their stable expansion reflects strategic government support and abundant energy resources. These nations are positioning themselves as long-term mining hubs rather than seeking rapid expansion.
Latin America
Paraguay holds steady at 4.0% of global hashrate with moderate growth (+8% QoQ, +54% YoY), maintaining its position as Latin America's mining leader. The region shows the most volatility: Bolivia posted a staggering +2,400% year-over-year gain (from 0.1 EH/s to 2.5 EH/s) despite a 17% quarterly pullback, while Ecuador (+400% YoY) and Brazil (+167% YoY) demonstrate sustained regional expansion. Argentina's struggles continue with a 13% quarterly decline and 42% year-over-year drop (from 6 EH/s to 3.5 EH/s), reflecting ongoing economic challenges.
Africa
Ethiopia's continued climb within the top 10—from #10 in Q1 2025 to #8 in Q1 2026—represents a significant milestone for African mining. At 2.6% of global hashrate with a +38% quarterly gain (from 20 EH/s to 27.5 EH/s) and +129% annual increase (from 12 EH/s), Ethiopia has surpassed both Kazakhstan and Norway to establish itself as a major player.
This growth is particularly remarkable given Ethiopia's decision to freeze new power permits for crypto miners in mid-2025 due to grid constraints. The continued hashrate increase reflects mining facilities already under construction before the permit freeze coming online, powered primarily by the Grand Ethiopian Renaissance Dam's abundant hydroelectric capacity. Ethiopia's success demonstrates that African nations with substantial renewable energy resources can compete at the highest levels of global mining, even while managing infrastructure constraints.
Biggest Callouts
Pakistan's Extraordinary Surge
Pakistan's +1,233% growth both quarter-over-quarter and year-over-year represents the most dramatic mining expansion globally. Jumping from just 0.3 EH/s to 4 EH/s, Pakistan has catapulted into meaningful global relevance at 0.38% market share. This thirteen-fold increase suggests either significant new infrastructure coming online or previously unmeasured operations now being captured in the data. The country's persistent energy challenges make this growth particularly noteworthy and raises questions about sustainability.
Ethiopia's Steady Climb
Ethiopia's ascent from #10 to #8 in the global rankings over the past year validates Africa's potential as a mining destination despite regulatory headwinds. After freezing new mining permits in mid-2025 due to grid capacity concerns, Ethiopia's hashrate continued growing as previously approved facilities completed construction.
The combination of renewable hydroelectric power from the Grand Ethiopian Renaissance Dam, completed infrastructure investments, and relatively stable operations created enough momentum to surpass both Kazakhstan and Norway. Ethiopia's success demonstrates that African nations can compete globally in mining, though the permit freeze raises questions about the pace of future expansion. Ethiopia's trajectory may inspire similar initiatives across the continent while also serving as a cautionary tale about balancing mining growth with grid capacity.
Kyrgyzstan's Regulatory Evolution
Kyrgyzstan's impressive growth trajectory (+300% YoY, from 1 EH/s to 4 EH/s) gains further momentum in Q1 2026 with a +167% quarterly surge (adding 2.5 EH/s from Q4 2025). This expansion coincides with parliament's approval of new mining regulations emphasizing renewable energy sources and operational transparency.
The regulatory clarity appears to be attracting legitimate operations seeking stable jurisdictions with abundant hydroelectric power. Kyrgyzstan's approach—combining renewable energy requirements with transparent licensing—may provide a blueprint for other Central Asian nations looking to attract mining investment while managing energy resources responsibly.
Bolivia's Boom-and-Pullback Pattern
Bolivia's +2,400% year-over-year growth (from 0.1 EH/s to 2.5 EH/s) followed by a 17% quarterly decline illustrates extreme volatility in emerging markets. This twenty-four-fold annual increase then immediate pullback suggests seasonal energy availability, regulatory shifts, or operator challenges. Bolivia remains a market to watch closely as it stabilizes from explosive growth.
US Consistency Amid Global Volatility
While less dramatic than emerging market surges, the United States' +3% quarterly growth and +39% year-over-year expansion (from 288 EH/s to 400 EH/s) demonstrates both scale and sustainability. Adding 112 EH/s over twelve months—more hashrate than most countries possess entirely—the US continues consolidating its position at 37-38% of global capacity. This growth has provided predictability for investors over the last 12 months. But, with the recent reversal in difficulty & hashrate, and mining operations shifting expansion into AI/HPC, there's cause for speculation around whether the U.S. growth will continue in 2026 or plateau.
Emerging Markets to Watch
Several countries with less than 1% market share showed meaningful growth trajectories worth monitoring:
- Laos: +100% YoY (4.5 EH/s → 9 EH/s) — Hydroelectric advantages driving steady expansion
- Finland: +100% YoY (4 EH/s → 8 EH/s) — Nordic efficiency and cold climate benefits
- Indonesia: +67% YoY (12 EH/s → 20 EH/s) — Southeast Asian diversification accelerating
- Latvia: +50% YoY/QoQ (0.5 EH/s → 0.75 EH/s) — Baltic states emerging as European mining centers
- Nigeria: +43% YoY (0.7 EH/s → 1 EH/s) — Africa's most populous nation entering the landscape
These smaller markets collectively represent the next wave of geographic diversification, testing regulatory frameworks and energy economics that could support larger-scale operations.
Key Takeaways
Geographic concentration remains high but is showing cracks.
The top three countries still control roughly two-thirds of global hashrate, but the gap between established leaders and emerging markets is narrowing.
Ethiopia's climb within the top 10 (+129% YoY) and Indonesia's steady expansion (+67% YoY) demonstrate that new regions can compete effectively.
Year-over-year data reveals true migration patterns.
Quarter-to-quarter movements can reflect seasonal energy availability or temporary operations, but annual trends like Ethiopia (+129%), Pakistan (+1,233%), Bolivia (+2,400%), and Kyrgyzstan (+300%) indicate sustained buildouts rather than temporary spikes.
China's 14% quarterly decline followed by 14% year-over-year growth illustrates how enforcement cycles create volatility around persistent underground operations
Emerging markets face explosive growth and sustainability questions.
Pakistan's 13x increase, Bolivia's 24x surge, and Kyrgyzstan's 4x expansion are large steps forward for those regions. Can these operations secure stable energy access, navigate regulatory uncertainty, and compete with established mining regions? The next several quarters will determine whether these represent sustainable expansions or unsustainable bubbles.
Regulatory frameworks increasingly matter.
Clear regulatory pathways—even restrictive ones—help operators plan more effectively than regulatory uncertainty. Examples:
- Kyrgyzstan's +300% growth following its renewable energy legislation
- Ethiopia's continued expansion of pre-approved facilities despite permit freezes
- China's 14% quarterly drop amid crackdowns demonstrate that
Regional strategies are diverging.
- North America emphasizes scale and sustainability (+39% US growth YoY)
- The Middle East pursues steady government-backed expansion (Oman +28% YoY)
- Asia shows renewed underground activity in China (-14% QoQ amid crackdowns, +14% YoY persistence) alongside explosive Southeast Asian growth (Indonesia +67% YoY)
- Latin America exhibits extreme volatility with both dramatic gains (Bolivia +2,400% YoY) and steep declines (Argentina -42% YoY)
- Africa is realizing its potential through Ethiopia's continued ascent (+129% YoY)
The network continues its upward trajectory.
At approximately 1,066 EH/s, the Bitcoin network's total hashrate reflects ongoing mining expansion despite price volatility and competitive pressures. This growth is increasingly distributed across more countries and regions than in previous cycles.
The Global Hashrate Heatmap is updated at the start of each new quarter on Hashrate Index.
Review previous quarterly analysis:
Access the full interactive dataset and historical comparisons under Data > Network Data > Global Hashrate Heatmap.
— Happy Hashing!


Hashrate Index Newsletter
Join the newsletter to receive the latest updates in your inbox.


