
Introducing the Price-to-Mined-Revenue Ratio
The price-to-mined-revenue ratio can be used as an indicator for how to properly value Bitcoin in bull, bear, or sideways markets.
Many long-term investors within the Bitcoin community are accustomed to the volatility, and some descend into manic bearishness when Bitcoin stops mooning. Astute investors will continue to succeed by following the math, and structuring portfolios with appropriate asset allocation. Equity markets are experiencing increasing volatility as the Federal Reserve prepares for imminent interest rate hikes.
A tightening of interest rates will wreak havoc across all asset classes. Bitcoin will not be left unscathed, at least initially.
Bitcoin Price Moves Are (Usually) Unpredictable
Between the December 2017 bull market peak and the May 11th, 2020 halving, Bitcoin never eclipsed its all-time high (though it came closish in the summer of 2019). The Crypto Winter of 2018/2019 was brutal for miners, and the halving made it even worse, forcing many to throw in the towel. By early 2020, the elusive bull market seemed ready to take off, and then the pandemic put a damper on global economic growth.
The pandemic created a broad market panic. Stocks across the entire spectrum of asset classes sold off with the impending fear of lockdowns and uncertainty. Energy stocks dropped dramatically to levels never seen in recent history. The entire crypto complex sold off in kind.
Weighing Bull/Bear Sentiment in Traditional Markets
Investors typically monitor the S&P 500 Index P/E ratio to get a clear picture of sentiment and momentum in the market. In secular bull markets, Price-to-Earnings ratios explode higher as investor hopium drives stocks up. A price-to-earnings ratio is forward looking, as such, investors expect higher profits in the future. Companies must grow their sales and profits to keep pace with higher, and higher stock valuations.
During the historic 2000 Internet Stock bubble, the Nasdaq fell over 65% and the S&P 500 fell 25% by 2002. In March 2000, the P/E ratio for the Nasdaq was a sky-high 1,751x. Today we are moving into strongly over-valued territory based on the historical 10-year S&P 500 P/E ratio. We are hitting 27x P/E ratios today, with long-term 10-year averages reaching 38x.

During the bottoming of the 2008 Great Financial Crisis, the S&P 500 reached historic low valuations. Investors who had the wherewithal to invest into the secular bear market experienced incredible investment returns over the next 10 years. Identifying a bull or bear market is critical to successful long-term capital appreciation. By no means is it easy. Reminiscences of a Stock Operator is a critical read for those coiners wanting insights in markets and manias. This author constantly refers back to this classic book about Jesse Livermore, a stock speculator of the early 1900s.
How Can We Identify Bull/Bear Trends in Bitcoin’s Market?
Using a similar approach to the S&P 500 historical price to earnings ratio trends, we can extend a new metric for valuing the bitcoin network based on expectations of investors. Enter the “price-to-miner-revenue” ratio. By using an equivalent to price-to-earnings ratio, we can trend Bitcoin’s market sentiment over time and draw insights to its current state.
Just like investing in a growth stock, investors are willing to pay higher price-to-mined-revenue value as they expect potential upside for Bitcoin exposure. Core reasons for higher values, miner economics are strong, plus bullish investor sentiment for the bitcoin network. Investors are expecting higher future bitcoin prices, which drive more miner revenues. Higher miner block rewards lower the relative P/MR value.
A low price-to-mined revenue reflects a bearish view of the bitcoin network. The peak of 2017 soon turned into the Crypto Winter of 2018. Bitcoin prices hit rock bottom. Investors were selling off their bitcoin, while smart investors still saw value in the network. During the Crypto Winter, the massive industrial buildouts of thousands of S9 miners were coming online across the world. Miners were battling tooth and nail for every sat of their block rewards.
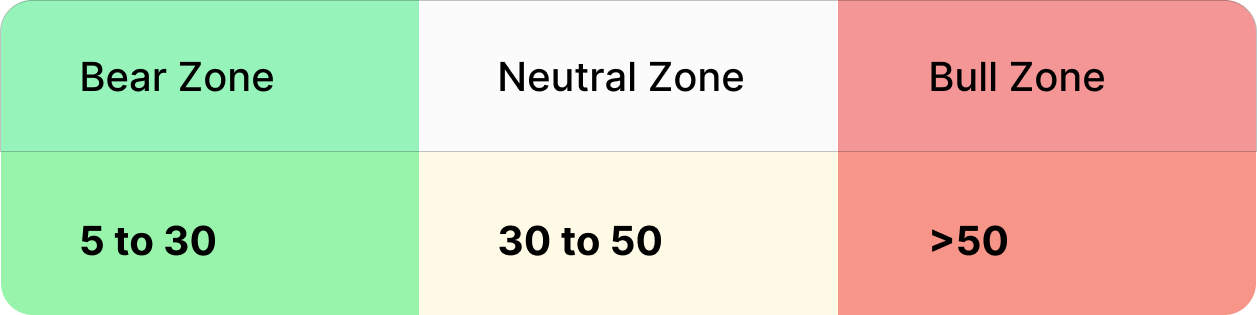
By observing these trends within the bitcoin ecosystem, we start to see how the Price-to-Mined Revenue ratio can make sense for the underlying market conditions. A low-ratio means bear market, and high-ratio means bull market.
How to Build the Price-to-Mined Revenue Ratio
The price-to-mining-revenue ratio consists of the following parts:
• Bitcoin Market Capitalization
• Total Mined Revenue on the bitcoin network
With these data, we can convert earned mined income into an equivalent price-to-earnings ratio and use this ratio to trend relative valuations across yearly, monthly or weekly timelines.
The price-to-mined-revenue formula is as follows:
Price to Miner Revenue (P/MR ratio)= Market Capitalization divided by Mined revenue.
Year-End Price-to-Mined Revenue
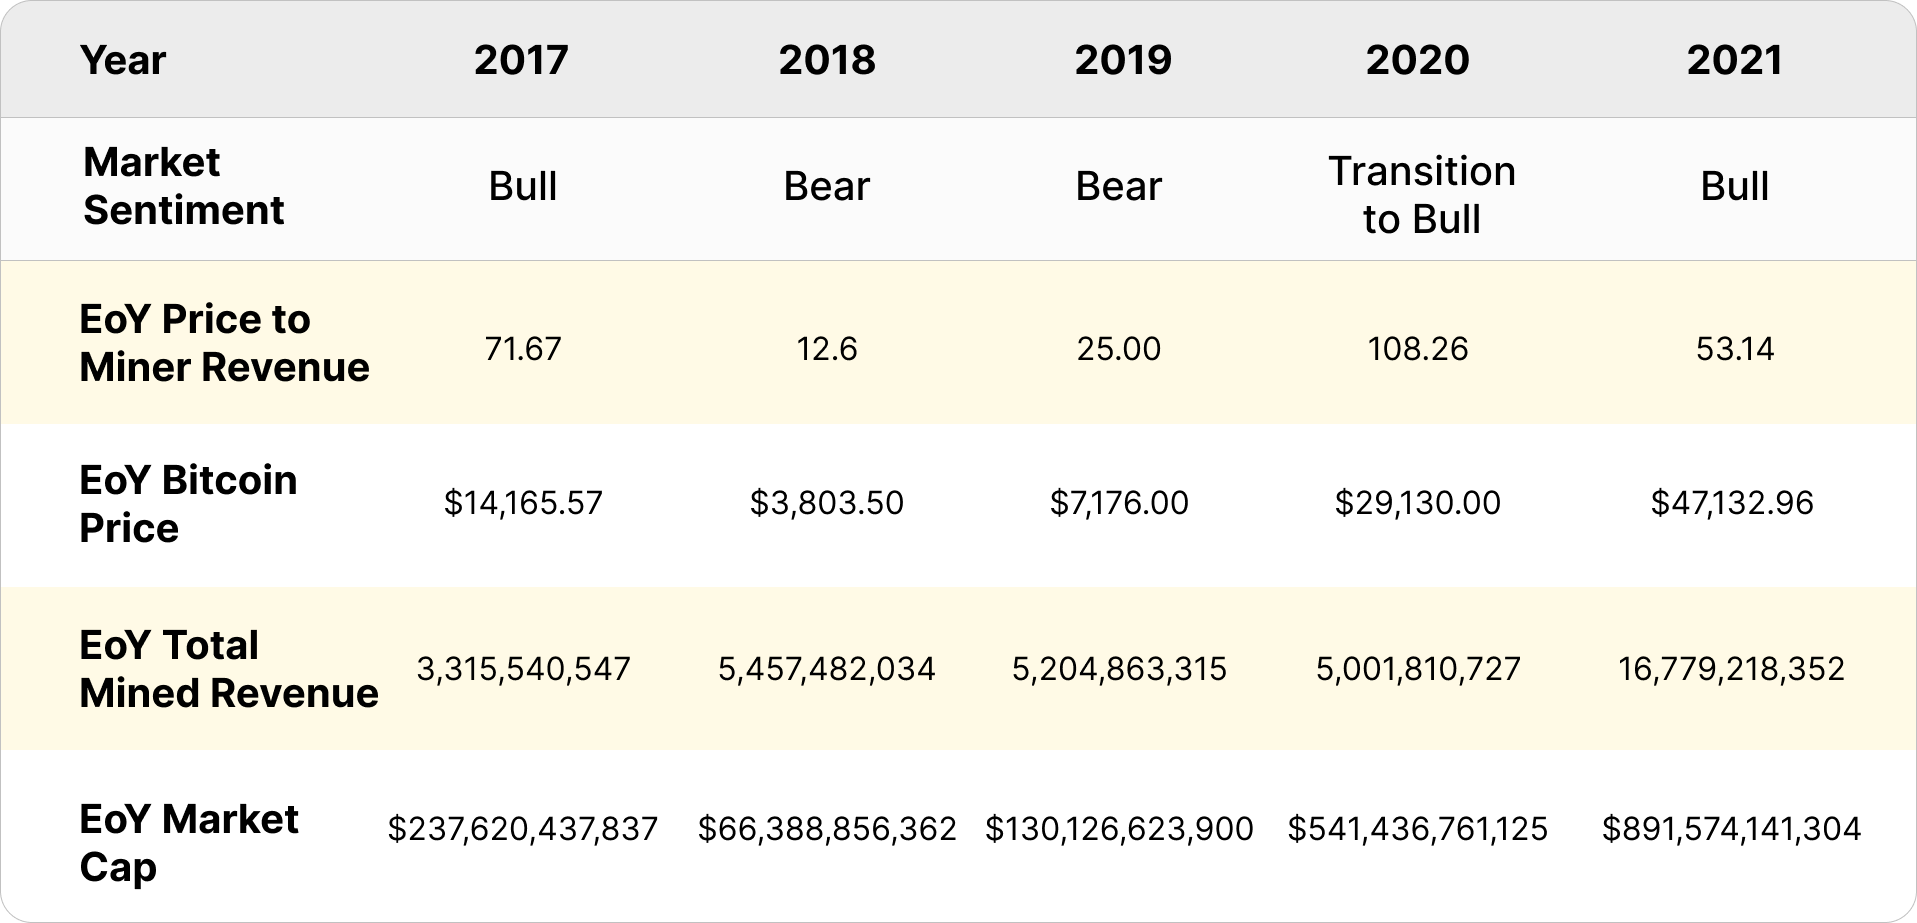
5-Year Bull or Bear Market Indicators using Price-to-Mined Revenue
The table above indicates:
- By year-end 2017, at the tip of the bull market, BTC had a 71 P/MR ratio.
- By year-end 2018, the pit of the bear market, BTC had a 12 P/MR ratio.
- The bull market of 2021 saw a reasonable P/MR ratio of 53 on $16.7 billion of mined revenue.
- In 2020, there was a significant spike in price-to-mined revenue as Bitcoin transitioned into a bull market. Mining income takes time to catch up to large price increases in bitcoin.
Without a doubt, buying Bitcoin in 2018 was a complete steal. Accumulating bitcoin during the Crypto Winter presented an incredible opportunity versus investors paying a 71 price-to-miner revenue ratio for every dollar of mined revenue in 2017.
Using Weekly Price-to-Mined Revenue Ratio
Using a weekly pricing trend, investors are able to observe short-term trends in the value of the bitcoin network. Think of the weekly chart as more of a technical indicator, whereas, the yearly P/MR ratio as a fundamental indicator of value. For example, a large spike in the P/MR ratio usually means a key technical event on the network. The China Ban in 2021 and the 2020 halving all resulted in large temporary spikes in the ratio. Weeks after these events, the miner-ratio adjusts to its new valuation channel.
Investors can use the weekly P/MR ratio to track near term highs or lows for the Bitcoin Network valuation. In 2018/2019, Bitcoin had a clear trading channel as seen in the chart below. A low P/MR ratio is a near-term “buy” signal, whereas a high ratio reflects overbought levels. When a trending channel is formed, investors can use this information to better position themselves.
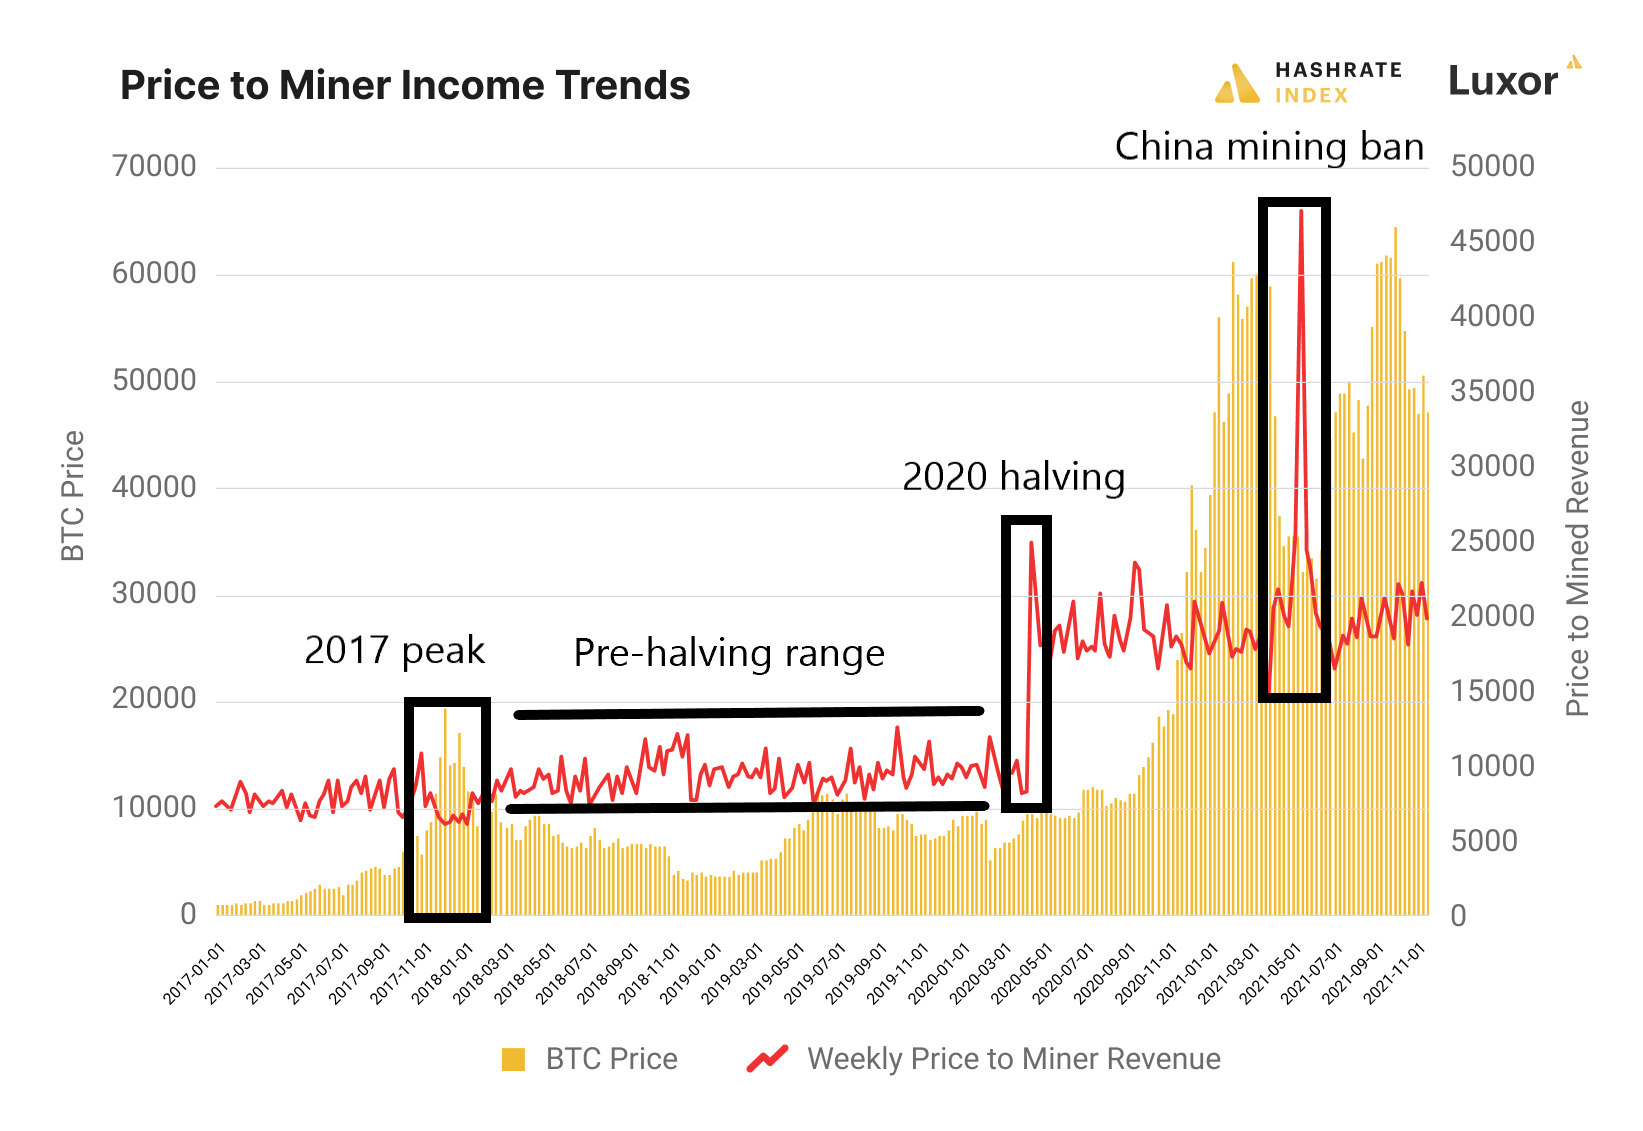
Observations from weekly P/MR Ratio data:
- The China ban created a short-term high-value ratio spike (an outliner event that quickly reverted).
- Price-to-mined-revenue is generally a lagging indicator in the short-term
- In the long-term, it measures and weighs the value of the network.
- Reviewing the 5-year P/MR ratio chart, the trend is higher over time.
- Current 2022 upward trend reflects an ongoing transition into a new valuation channel.
Modeling Bitcoin Pricing using Price-to-Miner Revenue
Assumptions: Mined revenue reaches $28 billion with 19,244,650 bitcoins in circulation by Dec 31st 2022. Assuming this as baseline, we can extrapolate the following targets under differing market conditions.
Bull Market Target:
- Bitcoin reaches $123,000 in value with a 85 P/MR ratio
- Total market capitalization of $2.38 trillion
Neutral Market Target:
- Bitcoin reaches $65,472 in value with a 45 P/MR ratio
- Total market capitalization of $1.60 trillion
Bear Market Target:
- Bitcoin reaches $29,000 in value with a 20 P/MR ratio
- Total market capitalization of $560 billion
What Will Bitcoin’s Price Be In 2022?
Based on supply chain constraints and limited rack space for bitcoin mining rigs, a muted market in 2022 is certainly possible. A key risk for bitcoin investors is the high probability of market contagion caused by hawkish central bankers tightening rates. Rate tightening in the short-term will create downward selling pressure for bitcoin. Having dry powder to take advantage of lower bitcoin prices in 2022 could be key.
A Price-to-Mined Revenue (P/MR) ratio of 60 with a $28 billion mined revenue, means bitcoin lands at $87,296 by the end of the year.
This authors’ outlook is cautious but optimistic as strong fundamentals are still intact.
Photo by Santiago Lacarta on Unsplash

Hashrate Index Newsletter
Join the newsletter to receive the latest updates in your inbox.


