Luxor Hashrate Lookback Series - March 2025
March 2025’s hashrate and hashprice trends, forward market participation, trading activity and contract performance.
Luxor’s Monthly Lookback Series is a deep dive into Bitcoin hashrate market activity. In this post, we cover March 2025’s hashrate and hashprice trends, forward market participation, trading activity and contract performance.
Summary
- March Madness: Bitcoin mining conditions continued to deteriorate in March as U.S. policy uncertainty weighed on markets. Bitcoin price dropped 11%, transaction fees fell for a fifth month, and network difficulty climbed 0.4%. USD-denominated hashprice declined 11.5%, BTC hashprice held flat.
- Hedging Divergence: Forward hashrate market performance diverged sharply by denomination and timing. BTC-denominated hedges consistently outperformed, with 5-month positions mining 9% more bitcoin than spot. USD-denominated contracts only outperformed if executed 1-4 months out, offering 7-20% revenue premiums, while pre-election USD hedges underperformed.
- Forward Curves Fall: Both BTC and USD hashprice forward curves fell throughout March, reflecting revised expectations for April-August 2025. Implied Bitcoin price and fee expectations trended lower, while implied network difficulty and hashrate growth remained elevated, signaling tighter mining margins ahead.
- Tariff Pressure Builds: U.S. trade policy continues to emerge as a significant influence in mining economics. President Trump’s April Executive Order on reciprocal tariffs raises CapEx risk for U.S. miners, particularly those sourcing hardware from Asia. As miners face increasing input costs, hedging strategies and efficiency gains are becoming critical tools for managing volatility.
March 2025 Spot Hashprice & Its Constituents
In March, Bitcoin mining markets continued to trend down. Compared to February, monthly averages for Bitcoin price and transaction fees dropped 11.0% and 9.5% respectively, while network difficulty (i.e., hashrate) increased 0.4% to a new all time high. As a result, USD hashprice fell 11.5%, averaging $48.26 per PH/s/day.
Hashprice entered into March 2025 at $49.09 per PH/s/day. A local high of $52.31 was marked on March 3, followed by a pronounced decline throughout March 6-10 to $45.84, before a recovery back up to $49.74 by March 26. Overall, daily average USD hashprice fell 6.5% throughout the month, closing in at $45.90, whereas the monthly average came in at $48.26.
The monthly average hashprice decline was mirrored by an 11% drop in average Bitcoin price month-over-month, which itself was influenced by ongoing developments in the geopolitical world.
Starting off at a daily average price of $85,082, Bitcoin marked a local high of $90,828 on March 3, following President Trump’s announcement for the creation of a “strategic crypto reserve”. However, this was short-lived, as ongoing uncertainty around President Trump's Tariff proposals turned the trend. Bitcoin declined by 11% throughout March 6-10 from $90,533 down to $80,947, before continuing to oscillate between the $82,000-$88,000 range for the remainder of March. Overall, daily average Bitcoin price fell 3.19%, with the month closing off at $82,368.
After weather-driven fluctuations in network difficulty and a -3.15% downward adjustment towards the end of February, March 2025 turned out to be a fairly standard month in mining.
Network difficulty began at 110.57T (~791 EH) and adjusted upwards twice throughout the month — increasing by 1.43% each on March 9 and March 23 — and closed off at 113.76T (~814 EH). To put this into perspective, both adjustments were in line with two empirical observations: the overall average historical percentage change per difficulty adjustment since January 2024 (estimated at +1.47% per adjustment), and the average historical percentage change during the month of March since 2021 (estimated at 1.4% year-over-year).
Transaction fees continued to disappoint in March, falling for a fifth straight month.
In bitcoin terms, fees collected per block averaged 0.039 BTC, a 9.5% drop from February. This level has not been observed since March 2012. In USD terms, and adjusting for the monthly average Bitcoin price, average transaction fee collection per block in March was $3,313, a fiat level last observed in September 2024.
A single notable fee event occurred throughout the month, namely a Taproot Wizards mint throughout March 25-26, which caused average fee collection per block to spike by 112% from 0.0406 BTC to 0.086 BTC. Although brief, this was a welcome surprise for miners online and hashing at the time.
Following February, the Bitcoin network witnessed another mempool clearance towards the end of March, marking the second instance since April 2023. This trend indicates a lack of blockspace demand and network congestion, implying short transaction confirmation times and low fees in the current environment.
Positive difficulty adjustments and low transaction fee collection had BTC denominated hashprice decline slightly in March. Starting at 0.00058 BTC per PH/s/day, hashprice fell by 0.6% to close off the month at 0.00056 BTC per PH/s/day.
The moving factor for mining markets in March was global macroeconomics and government policy. As global risk sentiment shifted due to uncertainty around tariffs and trade wars, equity and Bitcoin markets came under pressure. Bitcoin’s dip was mirrored by hashprice, and the ripple effects were pronounced downstream in the mining sector.
The left-hand-side of the chart below shows daily performance values (indexed) for Bitcoin, USD hashprice, and the HI Bitcoin Mining Index throughout March, in comparison to the S&P500 (measured by its own index value range on the right-hand-side).
The synchronized drawdown in Bitcoin, hashprice, and the HI Bitcoin Mining Index throughout March paint the picture: macro set the tone, Bitcoin reacted, and both hashprice & mining equities followed.
All four indices began to drift lower over the month, with mining equities and hashprice showing sharper declines. By mid-month, Bitcoin stabilized around the 7-10% down range, whereas hashprice and the HI Bitcoin Mining Index bottomed out closer to 10-15%. Although there was some recovery into the third week, the month closed with all three still below their starting levels, reflecting a risk-off environment.
The HI Bitcoin Mining Index showed the most volatility — a typical response given the high-beta-like behavior of mining equities. Meanwhile, the S&P 500 also trended downward, suggesting a broader repricing of risk beyond Bitcoin markets.
From an energy-adjusted hashprice perspective, the divergence in miner profitability across ASIC efficiency tiers is also becoming more pronounced.
On a revenue-per-watt basis, operations with sub-19 J/TH fleets are currently earning $0.11 per kWh, whereas miners in the 19-25 J/TH and 25-38 J/TH categories are earning $0.08 and $0.06, respectively.
March 2025 Hashrate Market Activity
Our analysis of the March hashrate market focuses on two key points: how the March 2025 hashrate contract traded in previous months and how the forward curve shifted in March based on pricing for forward hashrate during the month.
The two tables below show the evolution of USD and BTC denominated Bitcoin hashrate forward markets throughout October 2024 - March 2025. Rows represent specific monthly contracts, while columns represent each trading month. Cell values indicate the average monthly mid-market price — except for the bold highlighted main diagonal — which shows actual spot hashprice settlement in each month.
This table summarizes both the trading history of the March 2025 contract (colored row) and the forward curve in March (colored column).
Note: all values shown in figures represent the midpoint of the best bid and ask on Luxor's Non-Deliverable Hashprice Forward market.
The table below shows the type of market participants on the buy and sell side of Luxor’s deliverable (DF) and non-deliverable hashrate forward (NDF) market. In March, lenders were active on the buy side of the DF market, while public and private miners used the contract to sell forward, receive financing, and expand their fleet.
Since the DF involves upfront payment, it tends to trade at a discount to the NDF (compensating the buyer for the inherent credit risk). We see the discount of DF’s relative to NDF’s as the interest rate in hashrate-based lending markets. Buyers and sellers of the DF with upfront payment can use the NDF to lock-in a fixed yield or cost of capital instead of having exposure to hashprice uncertainty.
This strategy was used by lenders (i.e., buy the DF & sell the NDF) to earn a return and by miners (i.e., sell the DF & buy the NDF) to obtain non-dilutive financing. In March 2025, that yield or cost of capital was in the 8-13% (annualized) range.
How March 2025 Hashrate Traded
March's forward hashrate market resembled February’s trends due to a continued Bitcoin dip in the spot market. USD and BTC denominated hashrate markets therefore saw distinct outcomes.
In USD markets, March hashprice settled higher than traded in October 2024 but lower than traded in November 2024 through February 2025. For October 2024 trades, long positions (buyers) won while hedgers (sellers) incurred losses. This trend turned in favour of hedgers from November onwards as Bitcoin price declined; sellers won and buyers lost.
In BTC markets, March hashprice settled below October 2024 levels, and remained relatively flat from November 2024 through February 2025. The earliest hedgers (5 months out) profited 9% by locking in a higher hashprice and total Bitcoin production, whereas other strategies incurred either minor losses (1-2%) or remained on par with spot mining.
The October 2024 trade stands out because it was executed at a pivotal moment — just before the November U.S. presidential election, which dramatically reshaped expectations for Bitcoin price, mining economics, and policy outlook. Following the election, mining markets experienced conditions defined by higher-than-expected Bitcoin price, elevated network difficulty, and lower-than-expected transaction fees.
The table below summarizes how a 1 EH mining operation’s USD revenues would have performed, had it sold March 2025 hashrate forward versus mining spot during the month:
For sellers, performance for locking in forward revenue by selling March 2025 hashrate in advance varied significantly based on timing. Those who hedged 5 months ahead (October 2024) underperformed, earning 11% less than if they had mined spot. This cohort priced contracts during the pre-election period amidst lower Bitcoin price expectations and overestimated fee projections, which turned out to be the opposite post-election. Miners who hedged closer to March, from November 2024 through February 2025, captured between 7-20% more revenue than spot. These sellers were protected from a post-election environment that saw a persistent rise in network difficulty, a non-existent fee growth environment, and a declining Bitcoin price.
For buyers, October 2024 buyers locked in the most favorable hashprice and realized the highest returns, benefiting from a rise in Bitcoin price through January. Buyers entering from November onward saw diminished returns, as the forward market began re-pricing based on elevated Bitcoin price expectations.
The table below summarizes how a 1 EH mining operation’s total bitcoin production would have performed, had it sold March 2025 hashrate forward versus mining spot during the month:
For sellers, since BTC hashprice remained relatively stable from November - February, hedgers saw either small losses (~1-2%) or breakeven performance. In effect, there was no major penalty for locking in BTC-denominated contracts, however there was also limited upside.
For buyers, early buyers (5 months out) lost the most, but from November onward, the forward curve flattened and mirrored actual spot outcomes more closely, showcasing how the BTC-denominated hashrate market efficiently priced in future mining conditions. Returns for this cohort either mirrored spot or trailed slightly, depending on entry point.
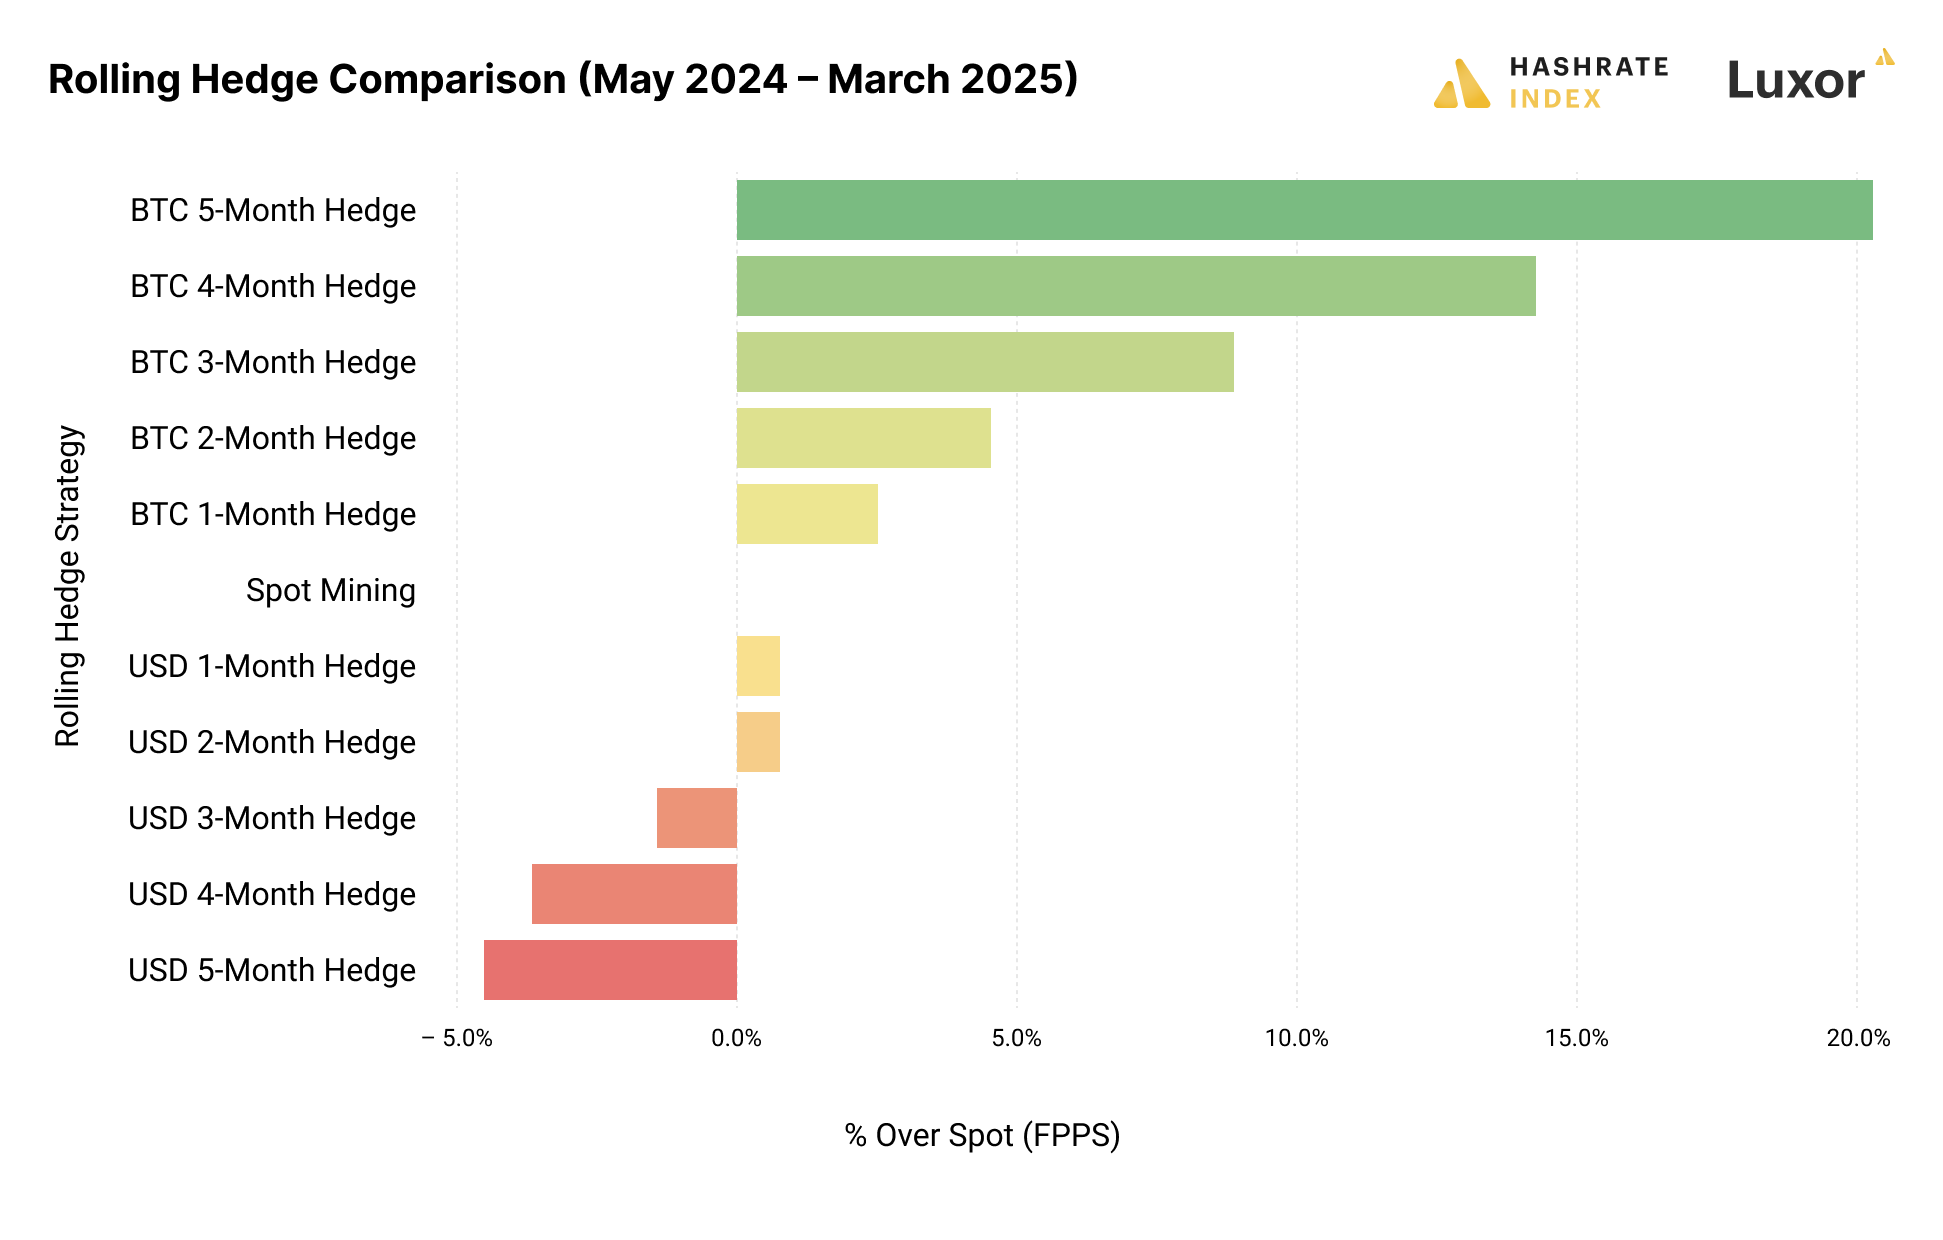
Zooming out, the following chart reveals how different hashrate hedging strategies from May 2024 – March 2025 performed relative to spot mining (FPPS), segmented by contract denomination and hedge horizon:

This comparison highlights a clear outperformance of BTC-denominated hedges over their USD counterparts from May 2024 to March 2025. Longer-dated BTC hedges, particularly the 5 and 4-month strategies, delivered the strongest results — benefiting from contracts priced ahead of rising network difficulty and underwhelming transaction fees post-election. In contrast, USD-denominated hedges generally underperformed, with losses increasing the further out the hedge was placed. These outcomes reflect a key dynamic: BTC forward markets more accurately anticipated post-election mining conditions.
How Future Hashrate Traded in March 2025
The two tables below summarize the evolution of Bitcoin hashrate forward markets during March 2025, for the subsequent five months from April 2025 through August 2025. Rows represent specific monthly hashrate contracts, while columns represent specific trading days. Cell values indicate the average daily mid-market price, except for spot prices.
During March trading, the USD curve exhibited a consistent contango trading pattern for the front end of the curve. In contrast, the BTC curve started off trading in backwardation, with the front end of the curve moving into contango throughout the second and third weeks. Expectations for both USD and BTC denominated contracts fell over the month.
We can use the two contracts to back out implied Bitcoin price expectations expressed by the market, by dividing USD contract values with BTC contract values. Similar to USD hashprice, implied future Bitcoin price expectations fell throughout the month:
If we make an assumption around transaction fees, we can also calculate the changes in implied difficulty and network hashrate expectations expressed by the forward market. In the tables below, we assume a 0.04 BTC per block transaction fee collection on March 3rd and March 31st:
Note: figures assume 0.04 BTC per block transaction fee collection on March 3rd and March 31st, 2025.
Based on this simplified analysis, we estimate that future hashrate expectations increased during the month of March, rising in the 4-6% range for the April - August contracts.
Looking Ahead and Concluding Thoughts
In February, we noted that government policy was becoming a critical factor in Bitcoin and the mining industry’s trajectory.
Throughout March, we observed geopolitical decisions stress hashrate markets. On April 2, U.S. President Donald Trump declared a national economic emergency and launched "reciprocal" trade measures. This Executive Order imposes a universal 10% tariff on all imports starting April 5, 2025, with higher tariffs on specific countries effective April 9, 2025.
Bitcoin mining equipment from affected countries will incur these tariffs upon entry into the U.S. Orders arriving before April 5 are exempt; those arriving between April 5 and April 9 face the 10% tariff, and from April 9 onward, higher country-specific tariffs apply. In the coming months, we expect policy action to continue shaping Bitcoin price, mining economics, network growth, and overall market confidence.
In energy and power, mining markets will reflect seasonal shifts, as the transition to milder temperatures brings in the next 4CP Program cycle for operators located in Texas’ ERCOT, a mining hotspot. We look forward to observing how miners mitigate economic curtailment risk in the months to come.
Since the April 2024 halving, Bitcoin has outperformed expectations, whereas mining markets faced a myriad of challenges: halving-induced revenue cuts, relentless growth in network difficulty, and disappointing transaction fees. These dynamics squeezed margins, however, not all miners were impacted equally. Those who hedged exposure to network difficulty and transaction fees outperformed their peers. By locking in fixed pool payouts via Luxor’s hashrate forward market, some operators earned over 20% more Bitcoin.
For miners facing rising equipment costs and tighter margins, locking in predictable cash flow becomes increasingly valuable. Selling hashrate forward enables miners to hedge against uncertainty, offering protection from both policy-driven shocks and mining market fundamentals.
Looking forward, Luxor’s Hashrate Forward Market is pricing in an average hashprice of $44.61 (0.00054) BTC per PH/s/Day over the next six months. Sellers can currently secure this hashprice while buyers have the opportunity to lock in the same hashcost through to September 2025.
If you’d like to learn more about Luxor’s Bitcoin mining derivatives, please reach out to [email protected] or visit https://www.luxor.tech/derivatives.
Disclaimer
This content is for informational purposes only, you should not construe any such information or other material as legal, investment, financial, or other advice. Nothing contained in our content constitutes a solicitation, recommendation, endorsement, or offer by Luxor or any of Luxor’s employees to buy or sell any derivatives or other financial instruments in this or in any other jurisdiction in which such solicitation or offer would be unlawful under the derivatives laws of such jurisdiction.
There are risks associated with trading derivatives. Trading in derivatives involves risk of loss, loss of principal is possible.
Hashrate Index Newsletter
Join the newsletter to receive the latest updates in your inbox.


