Hashrate Derivatives Monthly Lookback - October 2024
October 2024’s hashrate and hashprice trends, forward market participation, trading activity and contract performance.
Luxor’s Derivatives Monthly Lookback Series is a deep dive into Bitcoin hashrate forward market activity. In this post, we cover October 2024’s hashrate and hashprice trends, forward market participation, trading activity and contract performance.
Summary
- Bitcoin miners continue to face a challenging hashprice environment, but in the past month there was some reason for optimism.
- In appropriately named “Uptober”, every constituent of hashprice was up on the month. For miners, that’s good news when it comes to Bitcoin price and transaction fees but bad news when it comes to higher hashrate and increasing network difficulty.
- Miners who hedged early (in May, June, and July) earned more than spot Bitcoin miners in October, while those who hedged in August and September earned less.
- Although Bitcoin price expectations increased in October, they didn't fully counterbalance the rise in hashrate projections, with end-of-year hashrate expectations up ~100 EH and Q1-2025 projections up ~140 EH.
- The key question going forward is: will Bitcoin price growth outpace difficulty increases, boosting hashprice, or will rising hashrate continue to squeeze mining profitability?
October 2024 Hashprice & Its Constituents
Bitcoin miners continue to face a challenging hashprice environment, but in the past month there was some reason for optimism. August and September hashprice, $43.54 and $42.37 respectively, were the two lowest prints since 2017. In October, hashprice rebounded 11% to $46.87 – the third lowest on record.
In appropriately named “Uptober”, every constituent of hashprice was up on the month. For miners, that’s good news when it comes to Bitcoin price and transaction fees but bad news when it comes to higher hashrate and increasing network difficulty.
Bitcoin price action was the primary driver of higher hashprice in October. Bitcoin’s daily average price started the month at $62,800 and rose over 13% to $71,500 by the end. On October 30, one day prior to closing out the month, daily average Bitcoin price hit $72,216 – the second highest print up to that point, compared to $72,742 on March 13, 2024.
Network difficulty also set record highs in October. After a much welcomed -4.6% downward adjustment on September 25 from the previous all time high of 92.67T, network difficulty began October at 88.40T and rebounded 8.2% to set a new record of 95.67T before the end of the month. Trends which contributed to late-September’s downward adjustment – more favorable Fractal Bitcoin mining economics and Texas’ 4CP program – all reversed in October.
Based on data from UniSat, we estimate that 17 EH of permissionless Fractal Bitcoin mining moved back to the Bitcoin network in October, which made up about a third of the month’s rise in network difficulty (+2.7% contribution out of the total +8.2% increase). Conveniently, an approximate one-to-one rule of thumb for permissionless mining hashrate (in EH) to Fractal Bitcoin price (in USD) has roughly held since early-September.
After a summer marked by minimal Bitcoin transaction fees, the blockspace market is beginning to show signs of revival. In October, occasional bursts of Runes activity led to intermittent spikes in transaction fees, nearly tripling the average BTC fees per block compared to the previous month. Despite this uptick, October’s average fee per block of 0.151 BTC remained significantly below Bitcoin’s lifetime average of 0.34 BTC, coming in at less than half.
The net impact of transaction fees and network difficulty was lower BTC-denominated hashprice. With the exception of four temporary Runes driven spikes pushing hashprice above 0.00074 BTC per PH/s/Day, it fell ~8% during the month from roughly 0.00073 BTC per PH/s/Day to 0.00067 BTC per PH/s/Day.
All this activity has led to a resurgence in hashprice volatility, which rose steadily from 41 to 88 in during the month. This observation has historically been correlated with good buying opportunities.
October 2024 Forward Market Activity
Our analysis of the October forward hashrate market focuses on two key points: how the October 2024 hashrate contract traded in previous months and how the forward curve shifted in October based on trades for forward hashrate during the month.
The two tables below show the evolution of USD and BTC-denominated Bitcoin hashrate forward markets throughout May - October 2024. Rows represent specific monthly contracts, while columns represent each trading month. Cell values indicate the average monthly mid-market price, except for the bold highlighted main diagonal, which shows actual hashprice settlement in each month.
This table summarizes both the trading history of the October 2024 contract (colored row) and the forward curve in October (colored column).
Note: all values shown in figures represent the midpoint of the best bid and ask on Luxor's Non-Deliverable Hashprice Forward market.
The set of participants trading the October contract and trading forward contracts in October, happened to be less diverse than the set of market participants during lower uptime summer months. Private miners were on all sides of the deliverable (DF) and non-deliverable forward (NDF) market, while prop traders opted for the buy-side of the non-deliverable forward market.
Lenders, which were more active than the late summer months, continued to buy the DF and sell the NDF. We see the discount of DF’s relative to NDF’s as the interest rate in hashrate-based lending markets. Buyers and sellers of the DF with upfront payment can use the NDF to lock-in a fixed yield (i.e., cost of capital) instead of having exposure to the uncertain and variable returns of hashprice. In October 2024, that yield or cost of capital was in the 10-13% annualized range.
How October 2024 Hashrate Traded
In USD revenue terms, October 2024 was the first time since June where hedging wasn’t the best option for miners in all five prior months. Those who fully hedged early, in May, June and July, earned 13%, 10% and 5% more respectively versus spot Bitcoin miners during the month. However, with the recent rebound in hashprice, those who fully hedged in August and September earned 6% and 11% less respectively in USD mining revenue versus spot Bitcoin miners.
The table below summarizes how a 1 EH mining operation’s USD revenues would have performed, had it sold October 2024 hashrate forward versus mining spot during the month.
In BTC production terms, outcomes based on hedge timing were less varied. The one exception was those who hedged in May immediately following the halving. If a miner had fully hedged at the average mid-market price in May, they could have mined 14.4% more Bitcoin than those miners which mined at spot prices.
The table below summarizes how a 1 EH mining operation’s total Bitcoin production would have performed, had it sold October 2024 hashrate forward versus mining spot during the month.
By comparing the performance of USD-denominated contracts with the BTC-denominated contracts, we can infer how much Bitcoin price versus network difficulty and transaction fees contributed to overall USD performance. In the table below, it shows Bitcoin price was primarily responsible for lower than expected Oct-24 hashprice in June and higher than expected in August and September.
Most interestingly, in May and July, higher than expected difficulty and/or lower than expected transaction fees were the primary determinants of USD-denominated contract performance. That means, Bitcoin price aside, miners who hedged, especially in May but also in July, mined more total Bitcoin.
Unfortunately for the public mining companies – they were unhedged in October 2024. The figure below illustrates a hypothetical scenario of how public miners' October production would have differed if they had fully hedged in May 2024, right after the halving.
Note: this figure is strictly for demonstration purposes and based on the simplifying assumption of multiplying actual production figures by the percentage difference between hashrate forward contracts’ locked-in hashprice versus spot hashprice; it excludes fees and bid/ask spreads associated with entering into hashrate forward contracts.
A second caveat: although selling forward proved to be favorable in this instance, it is critical to recognize that hedging is typically a cost of business rather than a revenue generation method. Hedgers willingly pay a price to buy certainty and obtain more predictable cash flows, which increases valuation, reduces cost of capital, and ultimately attracts investments.
How Hashrate Forwards Traded in October 2024
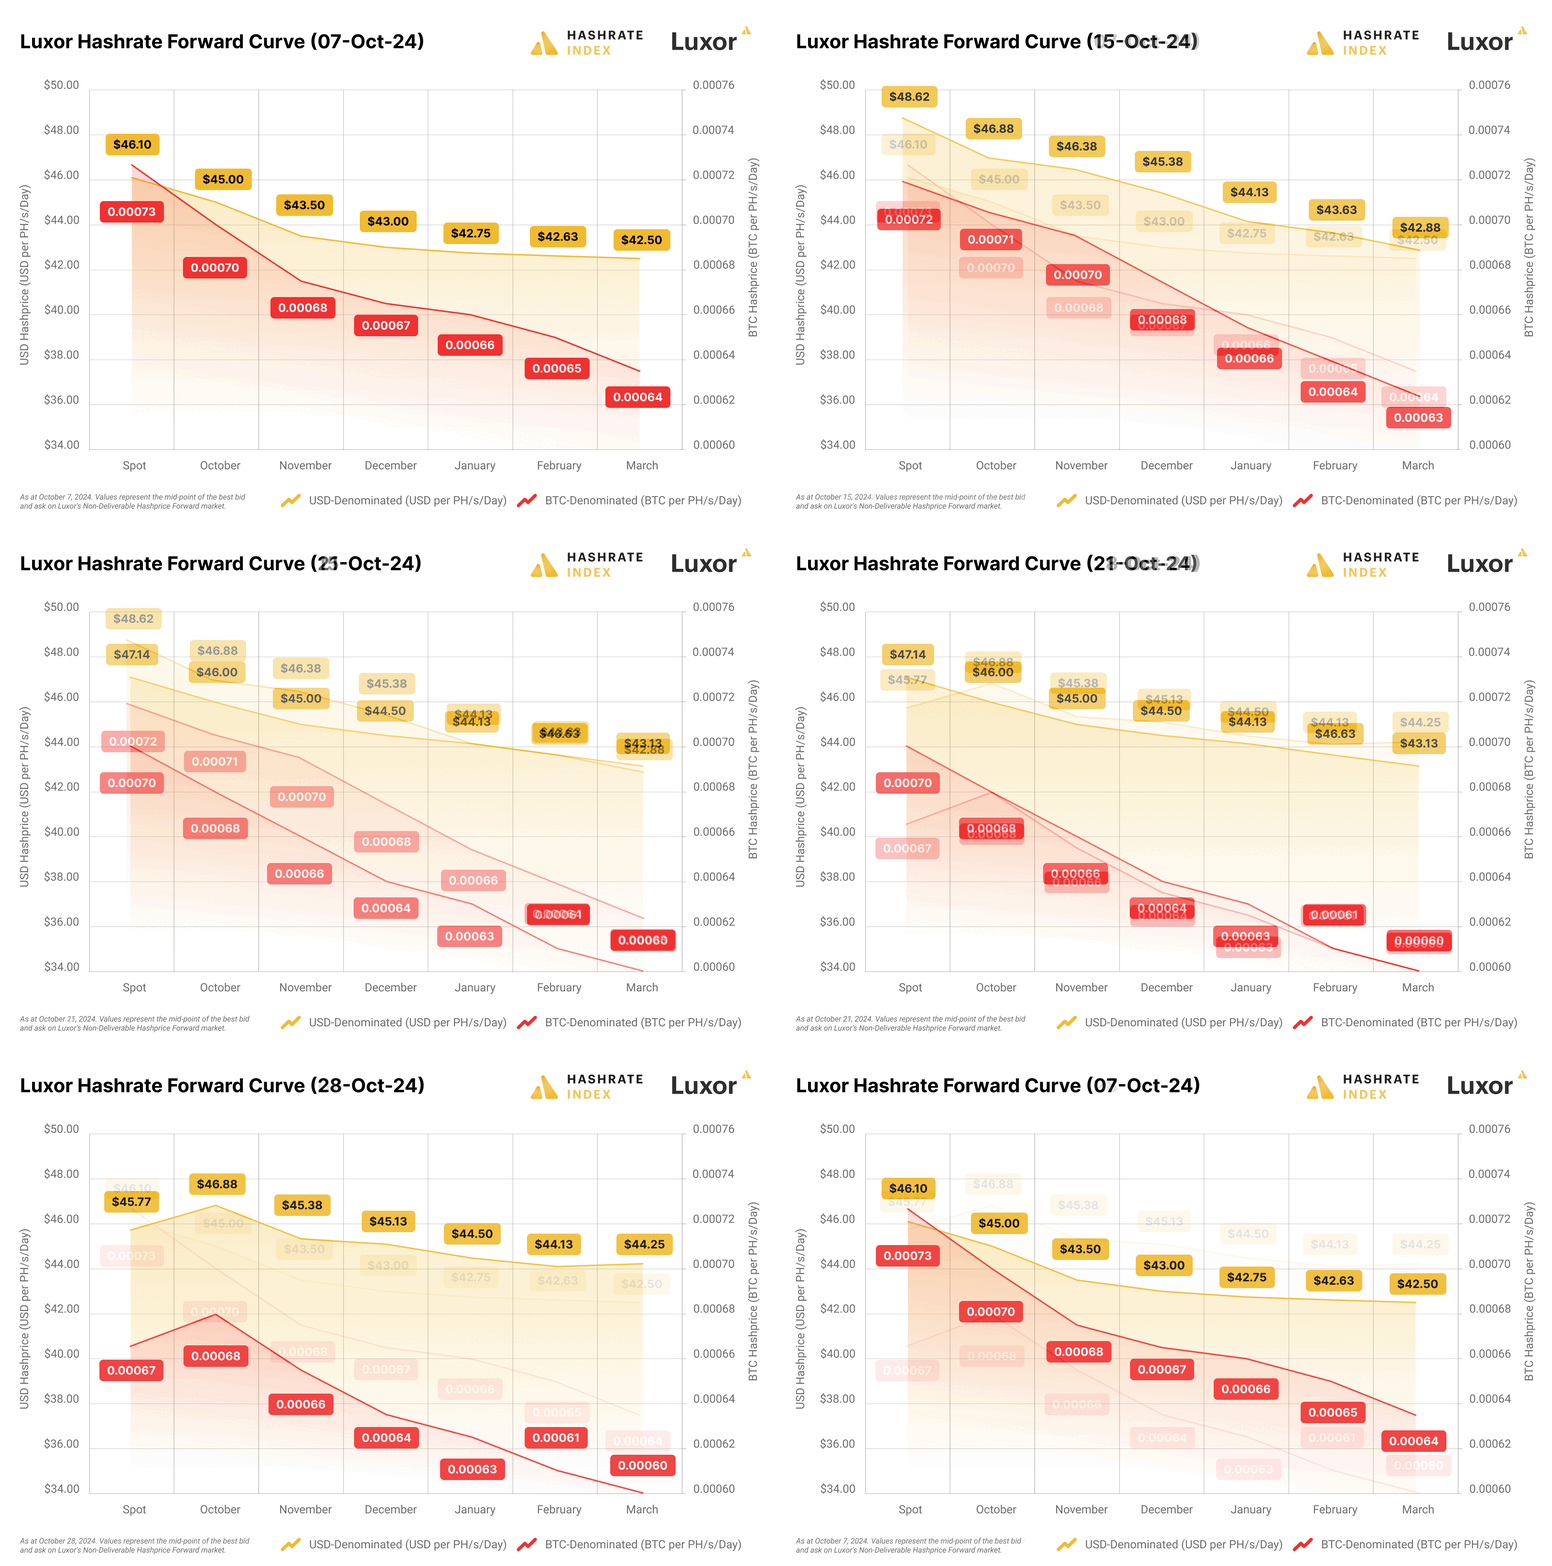
The three tables below summarize the evolution of Bitcoin hashrate forward markets during October 2024, for the subsequent five months from November 2024 through March 2025. Rows represent specific monthly hashrate contracts, while columns represent specific trading days. Cell values indicate the average daily mid-market price, except for the spot prices.
During October trading, Bitcoin price expectations rose – but not enough to offset growing hashrate expectations. On November 4, Mar-25 implied Bitcoin price was 13% higher than September 30th, which mirrored the rise in spot Bitcoin prices. However, on the same day Mar-25 USD hashprice was 2% lower than September 30th. Over the same period, Mar-25 BTC hashprice was 15% lower.
If we assume transaction fee expectations, we can calculate the changes in implied difficulty and network hashrate expectations in the forwards market. In the tables below, we assume a 0.04 BTC per block transaction fee assumption on September 30th and 0.15 BTC per block on November 4th. As an approximation this is a reasonable assumption. We have evidence to suggest transaction fee expectations were rising from the previous months all time low. The potential downside impact of lower fee expectations is also limited when mempool activity is at a minimum – so lower transaction fees were unlikely the culprit for falling hashprice expectations.
Note: figures assume 0.04 BTC per block transaction fee assumption on September 30th and 0.15 BTC per block on November 4th, 2024.
Based on this simplified analysis, we estimate year-end hashrate expectations rose ~100 EH during the October trading, and end of Q1-25 expectations rose ~140 EH. This is a massive increase in hashrate expectations and bad news for unhedged operators of older ASIC hardware.
Looking Ahead and Concluding Thoughts
In the first week of November, October’s major trends have continued. A gnarly 6.4% positive adjustment late on November 4th put difficulty 101.6T and the election of Donald Trump propelled Bitcoin’s price above $75,000 - new all time highs for both.
The chart below shows Bitcoin price versus Trump’s election odds on Polymarket throughout the last week of the campaign.
The key question for mining economics going forward is: will Bitcoin price growth outpace difficulty growth and improve hashprice, or will hashrate growth outpace Bitcoin price and continue to grind down on mining economics?
Looking forward, both USD and BTC contracts are currently priced in backwardation for November 2024 - April 2025. Miners can lock in a ~$46.50 hashprice for up to six months into the future. Our derivatives desk is currently seeing upfront payments and financing deals through the DF at a 10-13% (annualized) discount to the NDF curve.
As hashprice has rebounded from all-time lows, miners should consider a couple of cases for selling forward. First, hashprice can always go even lower. A significant decline in Bitcoin price could drive hashprice down into the $20's, and in such a situation, hedging may save a miner’s business.
Second, although miners are earning an all-time low per hash, newer generation ASICs are not earning an all-time low per unit of electricity (i.e., on a kWh basis). Even at all time lows, there is meaningful margin for newer generation ASIC operators to lock in. Perhaps the most compelling reason for selling hashrate forward near all time low hashprice is financing an ASIC fleet refresh or expansion to improve efficiency, decrease hashcost, and increase margins.
On the other hand, buy side participants may find the current hashprice environment to be an attractive entry point. Bitcoin price sentiment is bullish, transaction fees are low again, and hashprice volatility is elevated. Alternatively, miners with a hashcost above the forward curve (e.g., due to outdated ASICs or high electricity costs) should consider buying hashrate forwards to immediately reduce their cost to acquire Bitcoin.
As we come to a close, we would reiterate that although outcomes from locking in hashprice may vary in or out of favor over time, hedging is meant to be a risk management tool. As the industry continues to mature, miners who choose to embrace the hedging and financing instruments made available to them may benefit from smoother cash flows, lower capital costs, and a sentiment of higher confidence from investors.
If you’d like to learn more about Luxor’s Bitcoin mining derivatives, please reach out to [email protected] or visit https://www.luxor.tech/derivatives.
Disclaimer
This content is for informational purposes only, you should not construe any such information or other material as legal, investment, financial, or other advice. Nothing contained in our content constitutes a solicitation, recommendation, endorsement, or offer by Luxor or any of Luxor’s employees to buy or sell any derivatives or other financial instruments in this or in any other jurisdiction in which such solicitation or offer would be unlawful under the derivatives laws of such jurisdiction.
There are risks associated with trading derivatives. Trading in derivatives involves risk of loss, loss of principal is possible.
Hashrate Index Newsletter
Join the newsletter to receive the latest updates in your inbox.


