2022 Was a Record Year for Energy Price Inflation. 2023 Could Be Better
After record inflation in 2022, forecasts indicate that US power prices could fall in 2023.
2022 was a brutal year for Bitcoin miners for two, mutually-interested reasons: energy prices rose at a record pace and hashprice plummeted.
The vice-grip economics of 2022's inflated power costs and shrinking mining revenue put plenty of miners on the brink of breakeven last year. Q1-2023 though, has blessed miners with a complete reversal of fortune. Bitcoin is up 83% year-to-date, and hashprice up 38% with it. The bitcoin mining profitability boost means much more comfortable margins – and it's bought time for miners who were previously on life support.
What's more, natural gas prices are falling and energy price forecasts are favorable for 2023, so there's even more light ahead of what was (at the end of December, 2022) looking like a bleak year.
This article is an excerpt from our upcoming Q1-2023 report. Be on the lookout for the report next week!
Natural gas prices fall precipitously from 2022 peak
The global fiscal and monetary stimulus that flushed financial markets in 2020 bubbled into decades-high energy price inflation in the US and abroad, but prices are finally falling in the oil and gas sector and look poised to fall in electricity markets, too.
As inflation gripped electricity and oil + gas markets in 2021/2022, the cost of manufacturing, transportation, heating, commercial services, residential power, etc went up all around the world. These price increases were particularly bad in Europe, exacerbated as they were by the war in Ukraine and the sabotaging of the Nordstream pipeline.
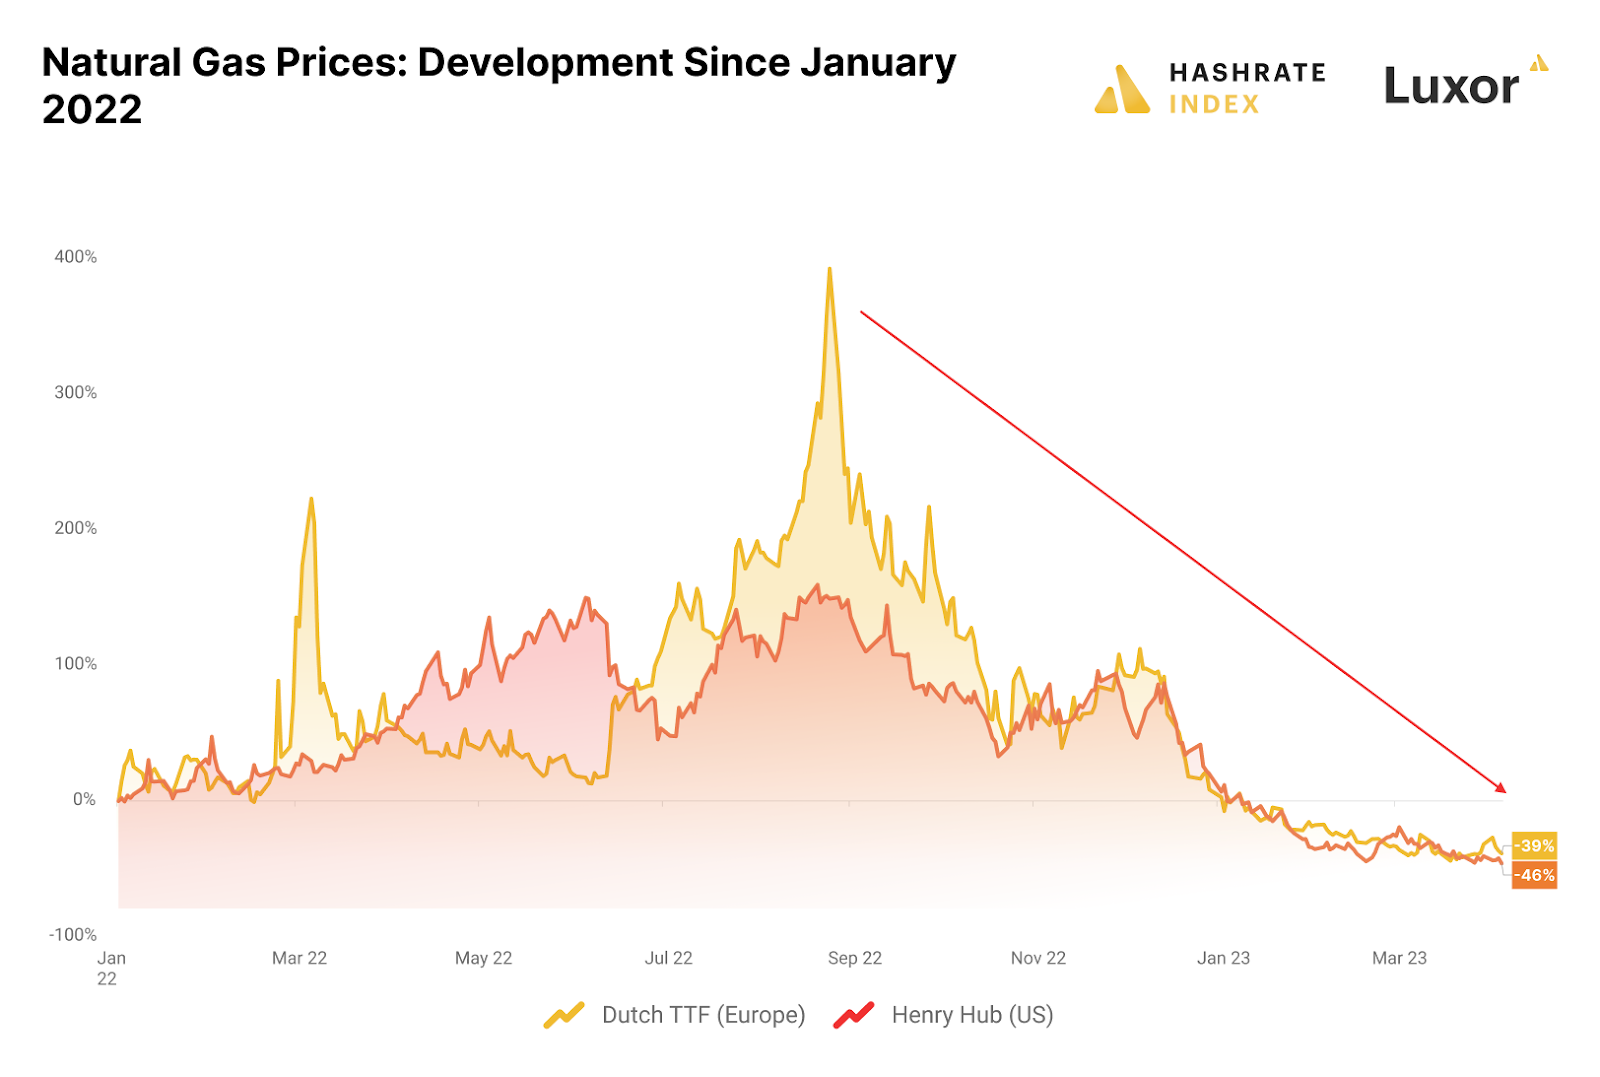
The Dutch TTF, the gold standard index for natural gas prices in Europe, rose nearly 400% from January to September in 2022; concurrently, the Henry Hub index, a US equivalent, rose a more modest-but-still-unfortunate ~120%.
Thankfully, these prices peaked in the summer and trended back to their January levels by the end of 2022. Nat-gas prices have continued trending down so far in 2023, so much so that the Dutch TTF and Henry Hub have fallen 39% and 46% since January 1, 2022.
Electricity prices end 2022 at record highs
Electricity prices in the US exited 2022 at their highest levels ever after a record year for price increases. The US Consumer Price Index pegged electricity price inflation at 14.3% last year, and if we zoom out a decade or even a few years back, this inflation looks even graver.
Residential rates were $151.20/MWh on average in 2022, a 25% increase from 2013 and 15% from 2020; commercial rates were $125.50/MWh on average, a 22% and 18.5% increase; and industrial rates were $84.50/MWh on average, a 22.6% and 27% increase.
Winter storms exacerbate power price inflation in January 2023
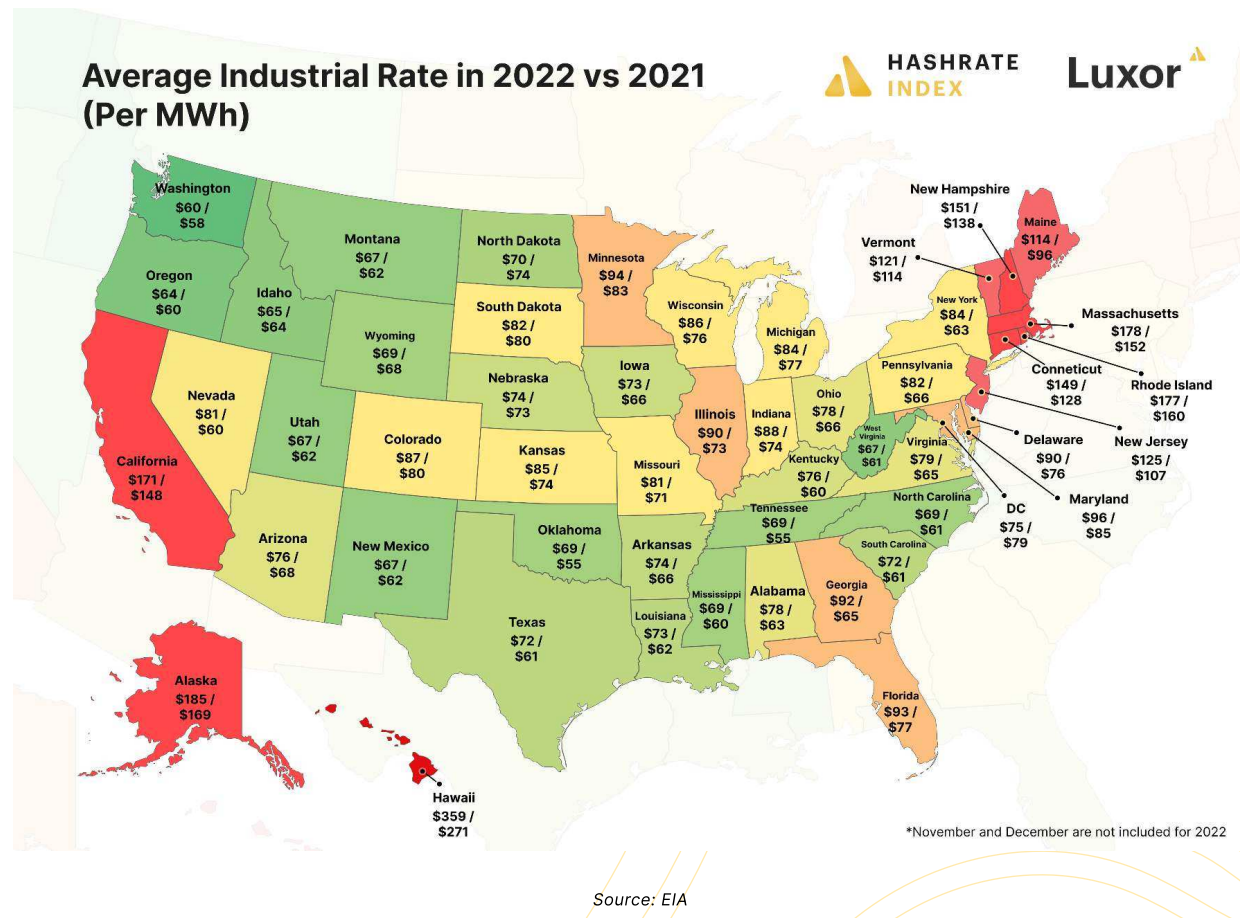
Looking state-by-state in the US, many states saw a significant increase in electricity prices from January 2022 to 2023. This winter has been an especially cold and stormy one in the US, particularly in the West where freezing temperatures, heavy snows, ice storms, and strong winds have interfered with power transmission and generation.
This has driven up prices significantly. States that have been battered the hardest by this season's winter storms (e.g., California, Oregon, Nevada, Kansas, Utah, Montana and Arizona) had some of the highest year-over-year changes to power rates.

The EIA will update numbers for February and March this quarter, so we’ll circle back to those numbers once published to see how 2023’s once-in-a-blue-decade’s winter affected power prices in the West and elsewhere in the US.
We anticipate that power prices for the remainder of Q1 in these storm-affected regions will be higher or at the least stay elevated given that the most severe winter storms (and their concomitant power outages) occurred in February and March of 2023.
Natural gas, electricity prices could be much lower in 2023 if forecasts hold
Some good news for Bitcoin miners: the US Energy Information Association (EIA) expects electricity prices to drop this year.
The agency forecasts a 1% reduction in electricity demand in Q2-2023 driven by milder weather, according to the IEA Short-Term Energy Outlook. This reduction in demand, in chorus with additional generation from renewable sources and cheaper nat gas prices, could reduce power prices in Q2 and Q3 this year relative to 2022 levels.
For natural gas specifically, the EIA forecasts that "the Henry Hub natural gas spot price will average about $2.65 per million British thermal units (MMBtu) in [Q2-2023] as natural gas inventories begin to rise." (For reference, the Henry Hub is currently trading for $2.19).
With inventories above their five-year-average, the EIA further anticipates that natural gas prices will stay below $3.00 for all of 2022, a huge haircut from 2022's $6.45 average.
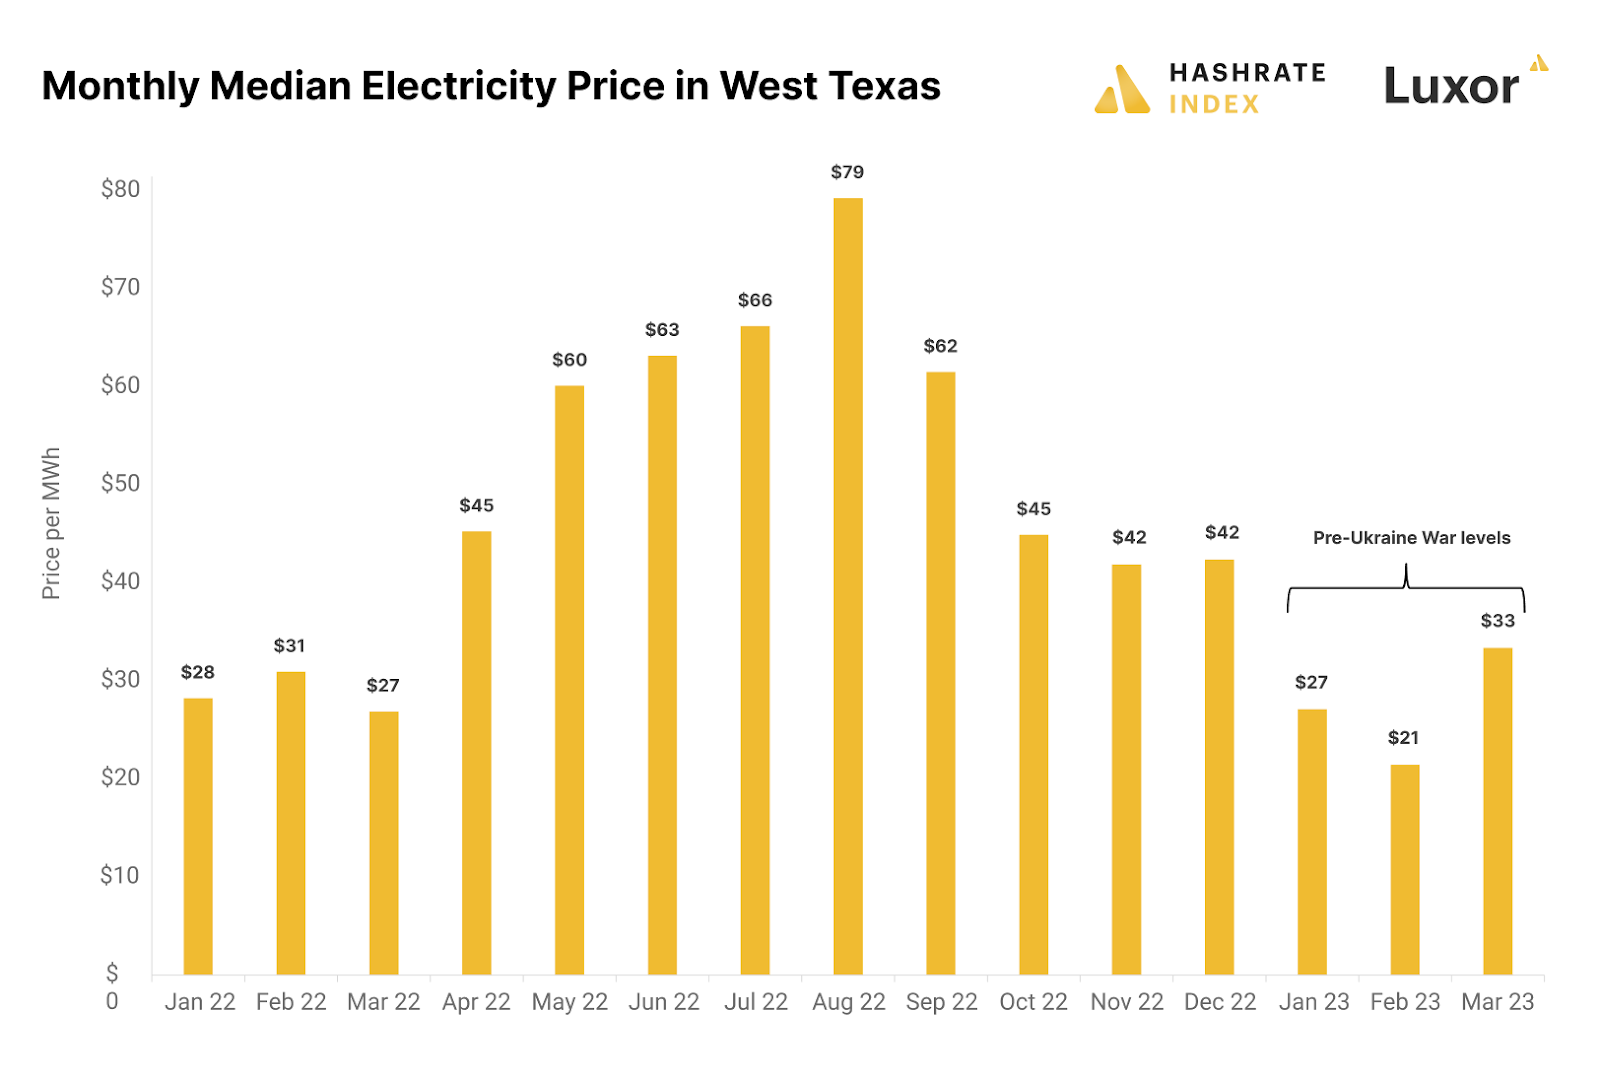
Lower natural gas prices should drive down wholesale power prices too, the EIA says – a lot. They think that wholesale power rates in Texas, for instance, could drop from 2022's $80/MWh average to $35/MWh.
Indeed, we've already seen these prices – and lower – in West Texas this Q1.
Below, you can see that 2023 wholesale power forecasts are favorable for each power region in the US, though the Southwest, California, and Northwest are forecasted to see less reduction than other regions. (This is likely because forecasts are based on the most recent power pricing data, and as we covered earlier, the Pacific Northwest and parts of the Southwest were wracked by storms in Q1).

Time will tell whether or not the EIA's forecast is too optimistic. But if it holds up, the reduction in power rates would further fatten bitcoin mining margins, which have already greatly improved under the influence of 2023's Bitcoin price rally.
Bitcoin's 80%+ rise year-to-date has pushed hashprice up 38%. By proxy, breakeven power costs are rising back to more comfortable levels: 0n January 1st, the breakevens for an S19j Pro was $80/MWh, versus $115/MWh at the end of March. (For context, the average industrial power price in the US in January 2023 was $83/MWh, versus $73/MWh in Janaury 2022.)

They're not quite bull-market margins, but it's a welcomed reprieve from the chopping-block financials miners suffered through in Q4 of last year.
2023: Year of the limbo or lambo?
Bitcoin has performed spectacularly in Q1-2023, all in the face of bank failures and under the ever-growing shadow of a global recession. The rally has been a godsend for an industry that was financially tarred, feathered, hog-tied, and dragged at the end of 2022.
Naturally, the bullish price action has some Bitcoiners chittering about a new bull market, or the potential for explosive price action in the face of economic/financial turmoil. "Banks are blowing up and it's Bitcoin's time to shine" – that kind of thing.
I don't know about all of that. But I do know – as some of y'all no doubt remember – that Bitcoin rallied from $4k to $14k between January and July, 2019, a stunning turnaround after tumbling some 85% in 2018.
Bitcoin's current rally feels similar: a flabbergasting recovery after being absolutely eviscerated the year prior. In 2019, of course, Bitcoin eventually came down from that July peak and stayed range bound between ~$5-10k from Q3-2019 until Q3-2020, the infancy of the last bull market.
Maybe we're in for a similar trajectory here – a mini bull market that precedes the real one, but which fizzles out over a 1 year+ timeframe where Bitcoin stays rangebound before climbing to new highs.
That's the limbo case: where Bitcoin's price grows, drops, then stagnates, and hashrate growth slowly nibbles away mining margins until the halving comes next April and completely nukes margins.
In the lambo case: Bitcoin moons and miners enjoy a hashprice supercycle until (and potentially during and after) the halving.
Either way, miners would be wise to curb their expectations and to prepare for the worst case if they want to weather 2023, 2024, and beyond. After all, pigs may get fat while hogs get slaughtered – but make no mistake, the pigs still get eaten. But you know what doesn't get eaten? Cockroaches. No one's going to eat a cockroach.
So be like the cockroach, y'all – stay lean, brace for the worst, and you'll be ready for whatever tomorrow brings.


Hashrate Index Newsletter
Join the newsletter to receive the latest updates in your inbox.


