In Search of a Hashprice Floor: Modeling Hashprice Resistance Levels
In the following report, we introduce a new model for evaluating hashprice resistance levels.
The Luxor team is excited to share our latest research report: The Search for a Hashprice Floor – or Downside Resistance.
This report proposes a new model to forecast hashprice resistance levels, which we explain in detail in the report summary included in this blog post. You can download the full report directly below:
The Search for a Hashprice Floor: Executive Summary
As Bitcoin Hashprice reaches all-time lows, driven by increases in network difficulty and decreases in Bitcoin’s price, miners are feeling the pain, investors are searching for bargains, and everyone is looking for the bottom.
This has led the Luxor team to hypothesize about a hashprice floor – a minimum hashprice where declines in Bitcoin’s price are offset by reductions in the network difficulty from unprofitable miners turning off their operations.
To evaluate this hypothesis, we constructed a supply and demand model of bitcoin mining hashrate and hashprice. Our hope is that the model will give Bitcoin miners and financial market participants insight into hashrate and hashprice mechanics: to help with capital investment and allocation, downside risk analysis and hedging decisions.
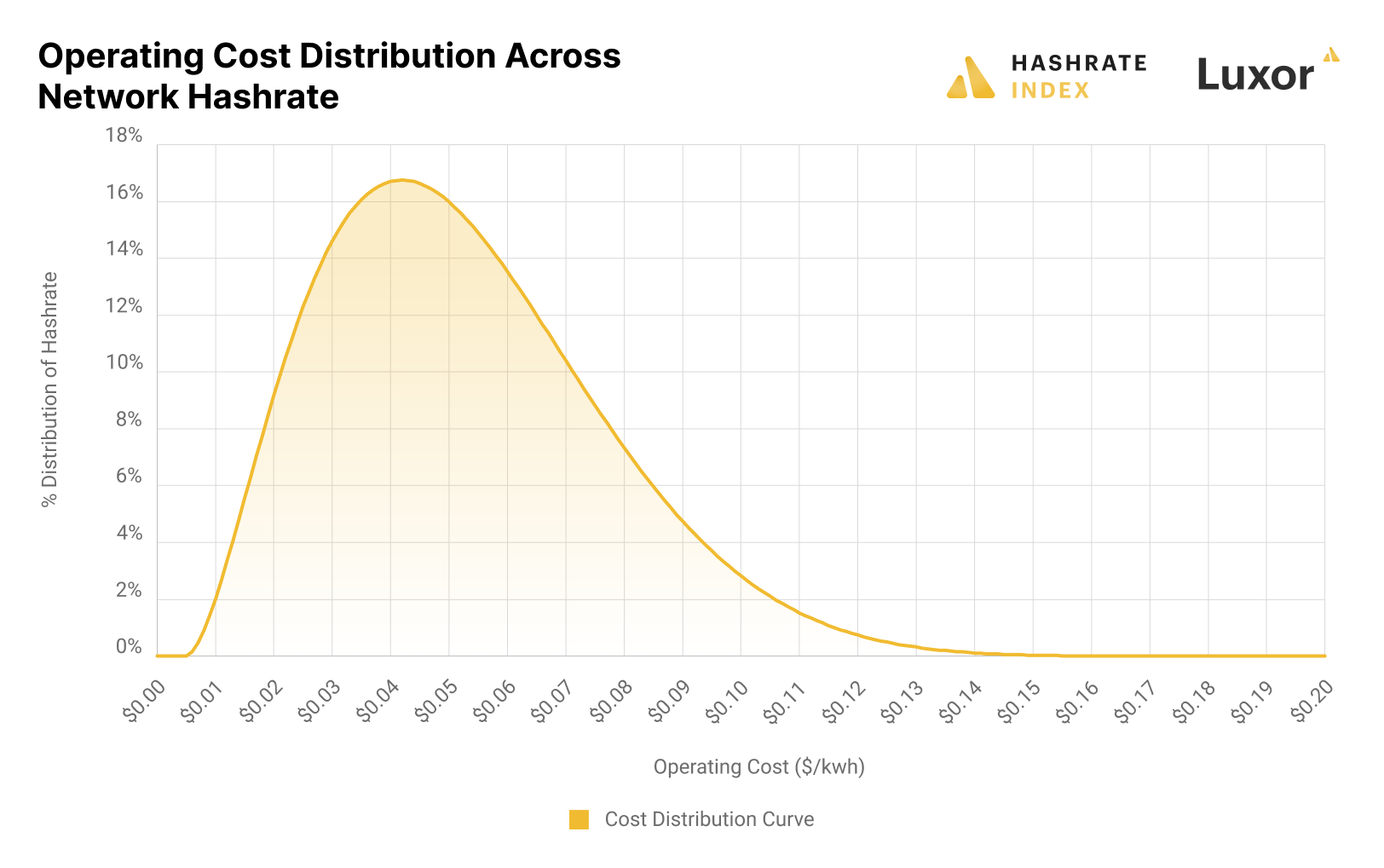
Given the proportional relationship between block times, network hashrate and difficulty, we used the full-pay-per-share (FPPS) mining pool payout formula to construct a downward sloping hashrate demand curve. It represents the hashprice miners can expect to earn for different levels of network hashrate, holding block subsidy, transaction fees, and bitcoin’s price fixed. To estimate an upward sloping hashrate supply curve, we used public filings, news releases, Luxor’s internal database and other available research to determine ASIC manufacturers’ historical and future production volumes and the profitability distribution of miners across the network. The supply curve represents the overall amount of hashrate that miners are willing to supply to the network at various hashprices.
Our model suggests:
- There is no hashprice floor as hypothesized. No matter how many miners come offline and how much network difficulty decreases, the corresponding increase in hashprice could be overcome by a potentially larger fall in the price of Bitcoin. That is to say – the hashprice floor is zero.
- However, our model indicates there are areas of what we call hashprice resistance. As Bitcoin price falls, and our demand curve moves to the left, there are regions where hashprice falls less per unit drop in the price of Bitcoin.
- In 2022, our model indicates more hashprice resistance between a Bitcoin price of $6,000 - $24,000, with resistance strongest in the $12,000 - $18,000 range. While in 2023, our model indicates more hashprice resistance between $8,000 - $30,000, with resistance strongest between $14,000 - $24,000.
- It should be noted that hashprice resistance is marginal compared to the concept of a hashprice floor. Our model does not predict any situation where meaningful declines in Bitcoin’s price can be totally offset by reductions in network difficulty. There are only minor variations in how much declines in network difficulty can offset declines in Bitcoin’s price.
Further, our model can also be used for other purposes, namely:
- It can be used to better understand how bitcoin mining economics work and compare outcomes under various assumptions. In this paper, we apply three Bitcoin price scenarios to evaluate how corresponding shifts in demand could impact equilibrium hashrate and hashprice at the end of 2022 and 2023.
- It can be used to gauge a miner’s competitiveness. As with any competitive market, producers of hashrate with lower marginal costs will be better positioned to withstand bear markets. Where a miner is positioned on the supply curve will determine their competitiveness in Bitcoin mining.
- It could be used as a starting framework for more refined analysis and accurate forecasting, and serve as an input for capital investment decisions. For example, miners could model future cash flows under various bitcoin price scenarios. This analysis could inform capital allocation decisions, such as determining whether new expansion projects or miner purchases provide acceptable returns.
- Perhaps most importantly, the model could be used to assess financial risks and make hedging decisions. It is worth keeping in mind, there is no hashprice floor. Every miner is vulnerable to price declines at some point. Miners could use this model to explore the use of hedging instruments, like Luxor’s Hashprice NDF, to build a more defensible business in a highly cyclical industry.
Now, our model’s results must be interpreted with tremendous caution.
It is a mathematical representation of a system designed to further our understanding of how Bitcoin mining economics work and compare directional outcomes under various assumptions – not a completely accurate detailed mapping of the entire Bitcoin mining economy, or a forecast / prediction for the future. Different assumptions will produce different results. Further, in reality, external forces are always changing: Bitcoin prices, monetary policy, market conditions, and transaction fees to name a few, but the list goes on. The real world has more complexity than any model could ever hope to capture. Equilibrium is an abstract concept – in real life things are always changing.

Hashrate Index Newsletter
Join the newsletter to receive the latest updates in your inbox.


