
Luxor Hashrate Lookback Series – October 2025
October 2025’s hashrate and hashprice trends, forward market participation, trading activity and contract performance.
Luxor’s Monthly Lookback Series is a deep dive into Bitcoin hashrate market activity. In this post, we cover October 2025’s hashrate market and hashprice trends, forward market participation, trading activity and contract performance.
Summary
- Uptober 2025 Cancelled: Bitcoin briefly hit a new all-time high of $124,485 on October 6 before reversing to close the month down at $109,610. Meanwhile, network difficulty surged (+8.4%) to a record 155.97T as block times averaged 9m30s.
- Hashprice Declines for Third Straight Month: Average USD hashprice fell (-6.9%) to $48.47 per PH/s/Day, while BTC hashprice declined (-7.9%) to 0.00042 BTC.
- Hashrate Hedgers Continue to Win: Early forward sales (May–July) in BTC-denominated contracts outperformed spot FPPS by 12–15%. Even a 1-month forward sale in September would have resulted in an additional +4% BTC revenue.
- Market Expects Continued Compression: Forward curves for November 2025 – March 2026 fell 14–20% in USD terms, while BTC-denominated contracts were mixed (front-end down 1–5%, tail-end up 1–3%), signaling expectations for weaker mining economics in the near term, but potential network-side relief ahead.
October 2025 Spot Hashprice & Its Constituents
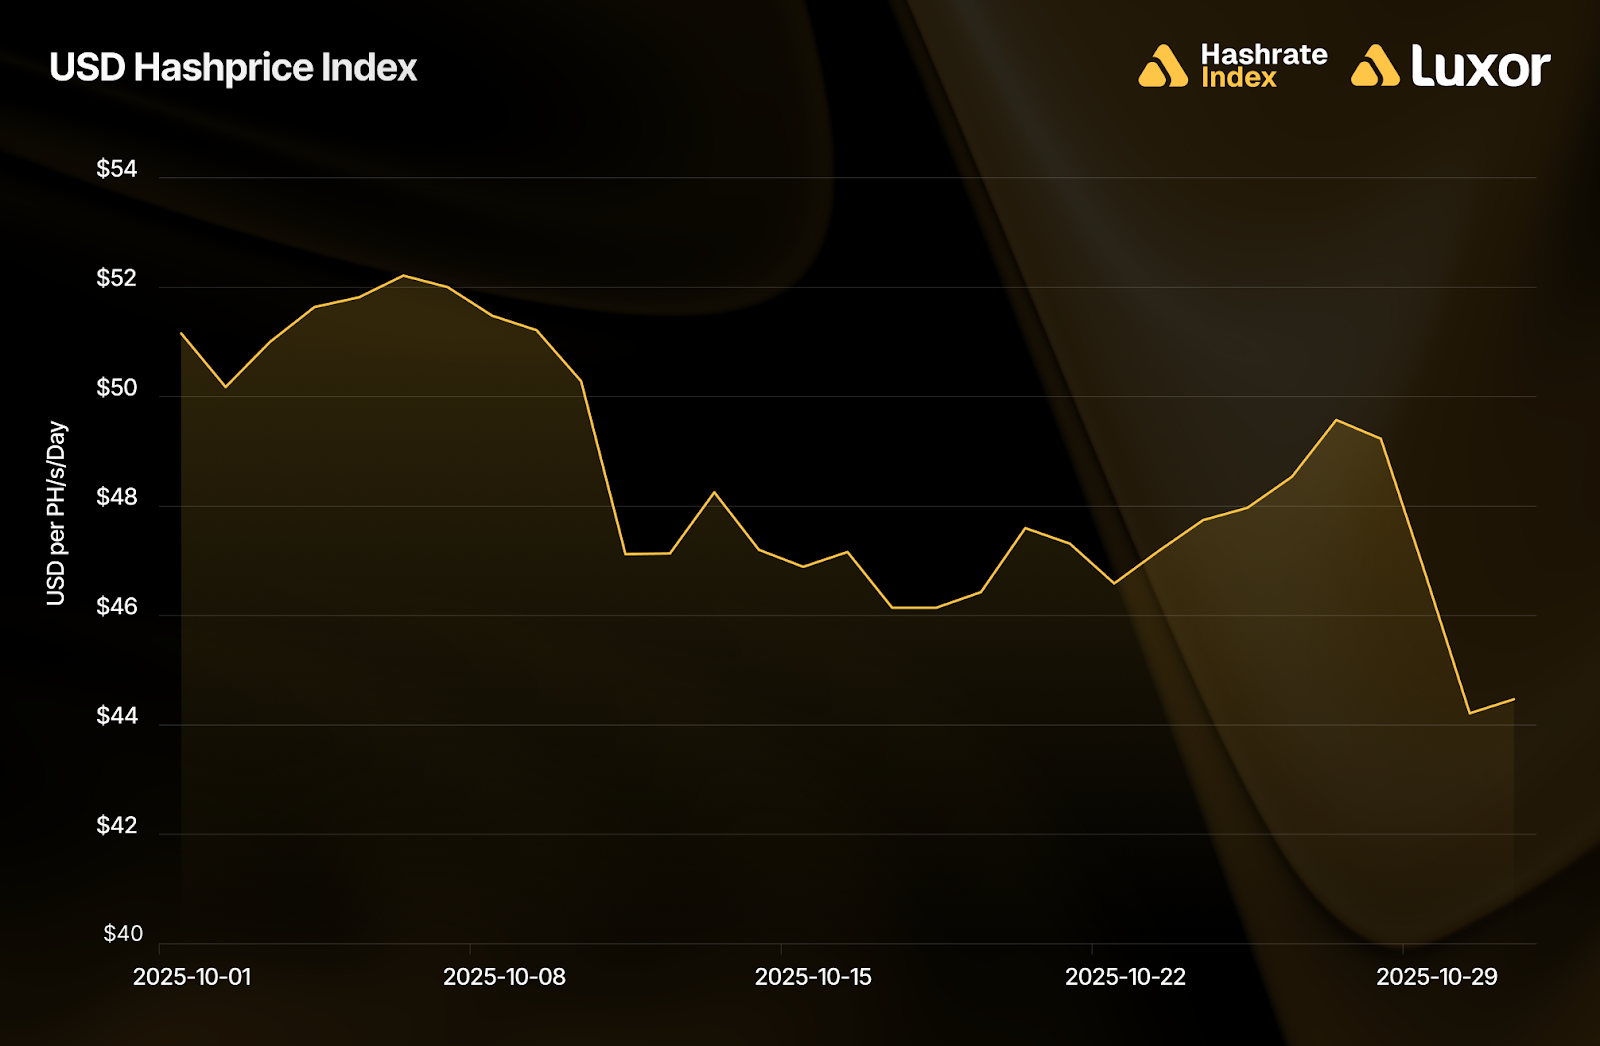
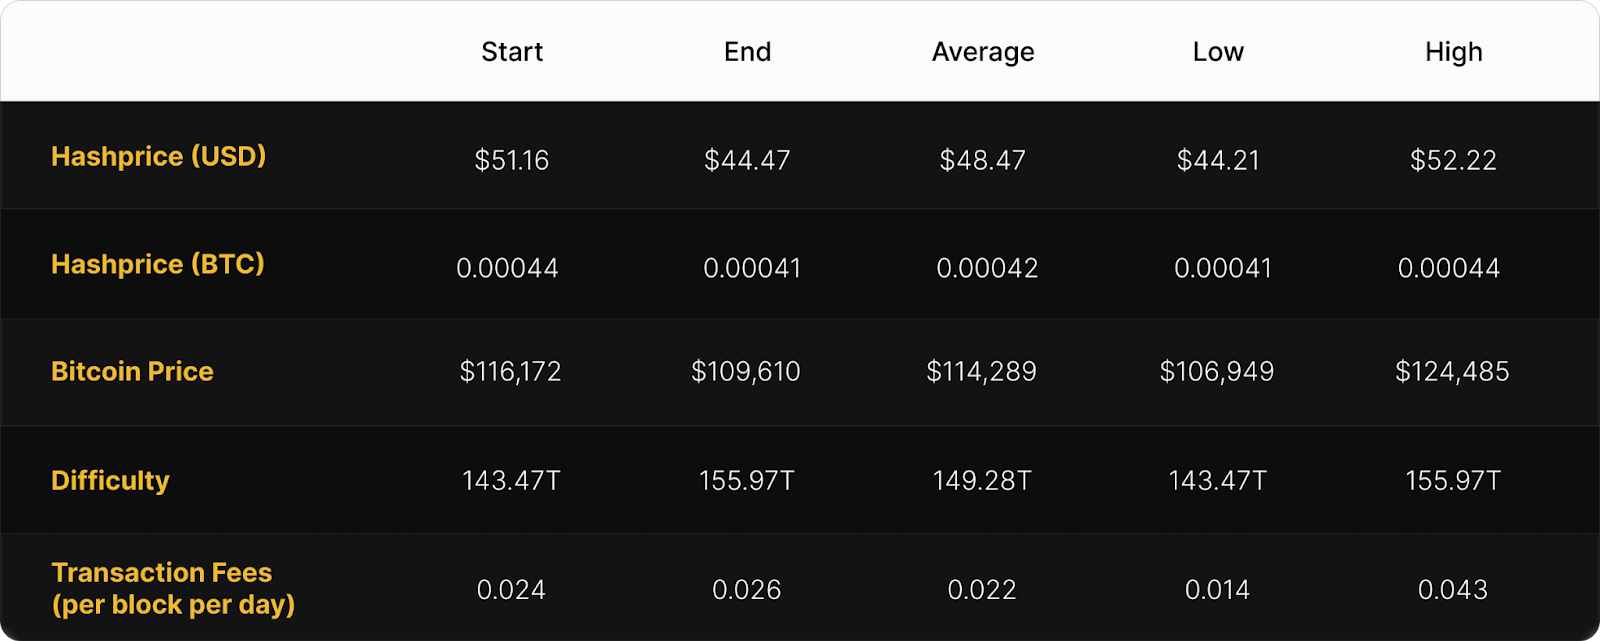
The downtrend in mining economics since late summer has been worsening, and October was no exception. USD-denominated hashprice averaged $48.47 (-6.9%), and BTC-denominated hashprice averaged 0.00042 BTC (-7.9%) per PH/s/Day. This was primarily fueled by an increase in monthly average network difficulty (+8.4%) to a new all-time high. On the other hand, bitcoin price action was slightly up (+1.1%), whereas transaction fees saw a meaningful decrease (-17.9%), still remaining at near all-time lows in BTC terms.
USD hashprice started October at $51.16 per PH/s/Day and trended up to $52.22 over the first week, before trailing down toward $44.47 by month-end. It ranged between $44.21 – $52.22 and came out to a monthly average of $48.47, a 6.9% decline month-over-month.
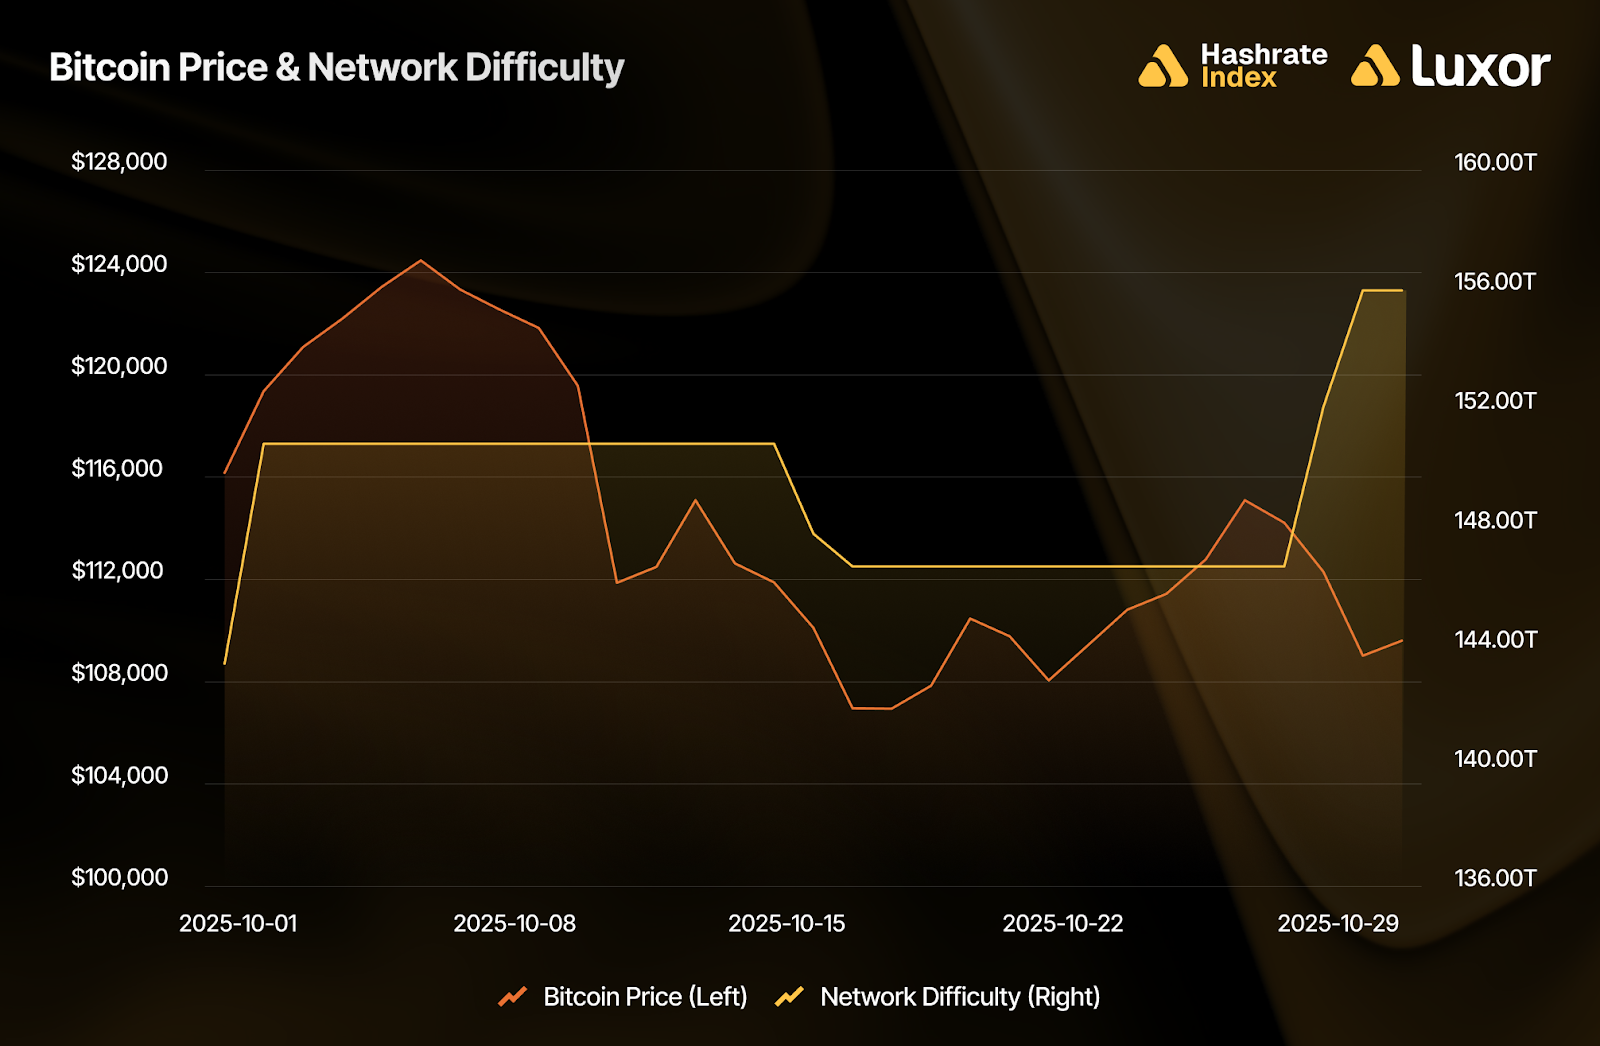
Average bitcoin price action was slightly up in October. Starting at $116,172, BTC climbed to a local peak of ~$124,485 on October 6, marking a new all-time high in “Uptober” fashion. However, this was short-lived as price action reversed down over the rest of the period, closing at $109,610. The average BTC price came in at $114,289, a 1.1% incline month-over-month.
Network difficulty continued to climb in October, breaking new ground. Following a positive adjustment on October 1 (+5.97%), difficulty increased to 150.84T, an all-time high at the time. A negative adjustment followed on October 16 (-2.73%), marking the first difficulty decrease since July 2025, before being met with another positive adjustment on October 29 (+6.31%), which increased difficulty to 155.97T, a new and current all-time high. The monthly average for difficulty experienced by operators came in at 149.28T (versus 135.75T in September) — an 8.4% increase, and the strongest monthly growth in average difficulty seen since November 2024 (+9.7%).
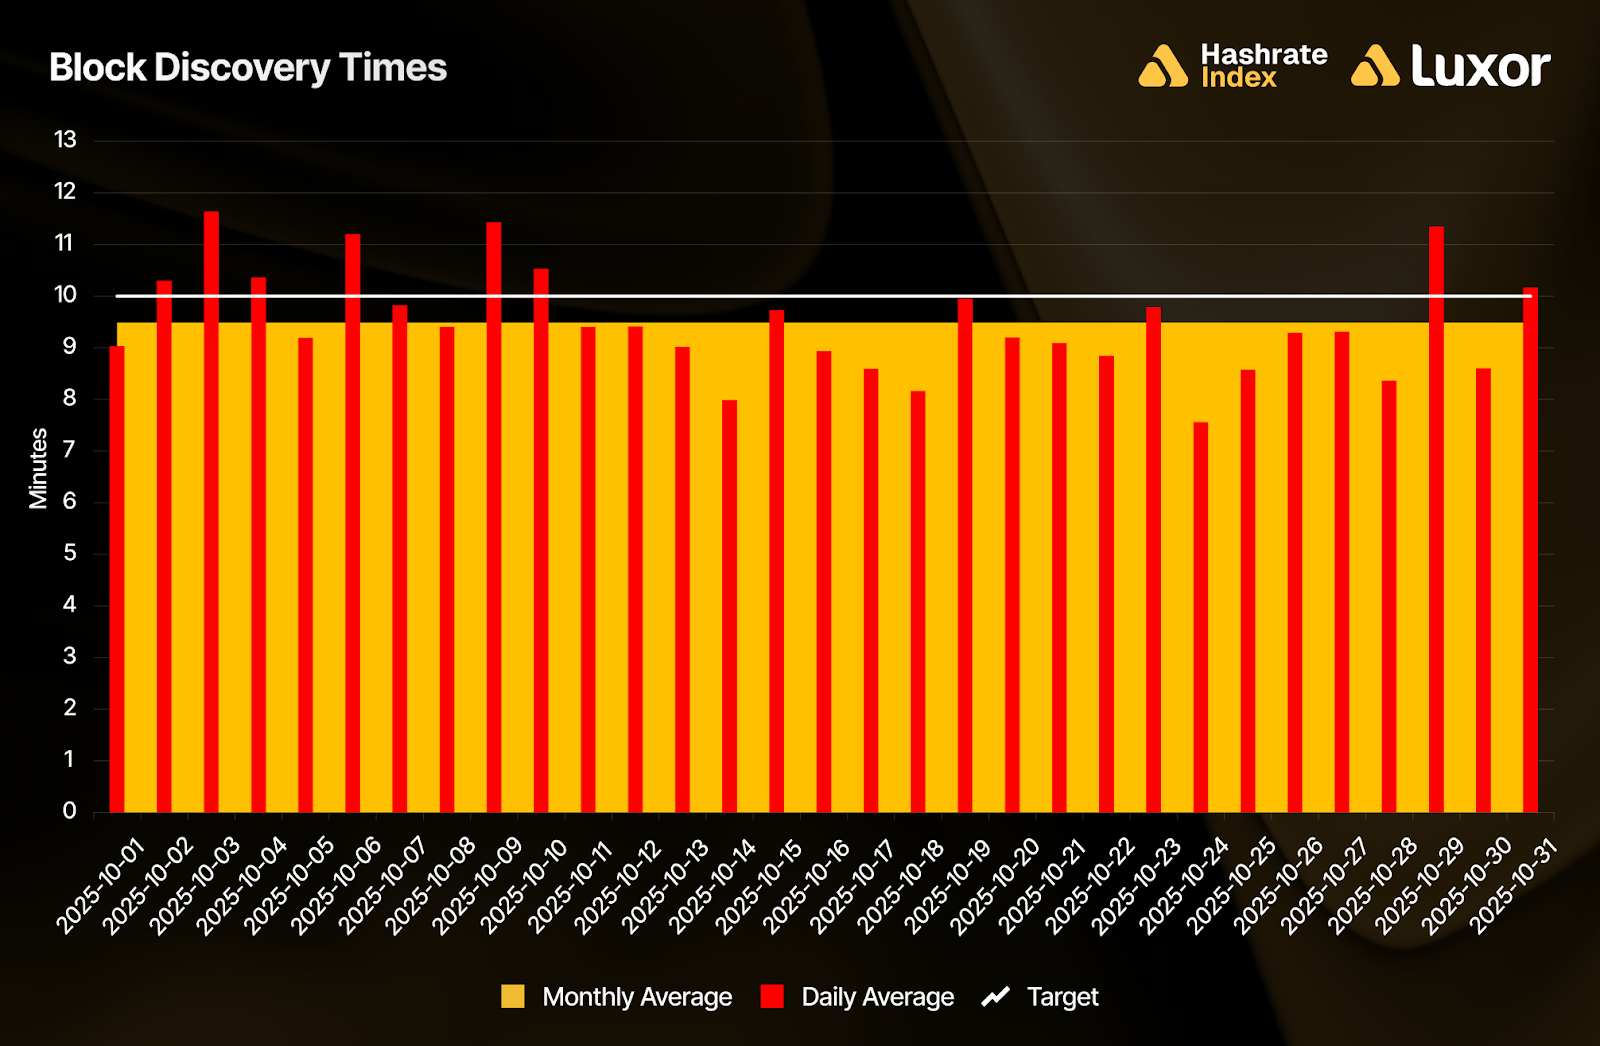
The positive difficulty adjustments were caused by quicker-than-target block times. 23 out of 31 days (74%) in October averaged block times below the 10-minute target, coming in at a monthly average of 9 minutes 30 seconds per block.
October’s fast blocks at 9m30s seconds implies that miners were running ~5.3% more hashrate than the network targeted. In other words: miners deployed machines, improved uptime & efficiency, and/or curtailed less, which triggered upward difficulty adjustments as aggregate SHA-256 computing power increased.
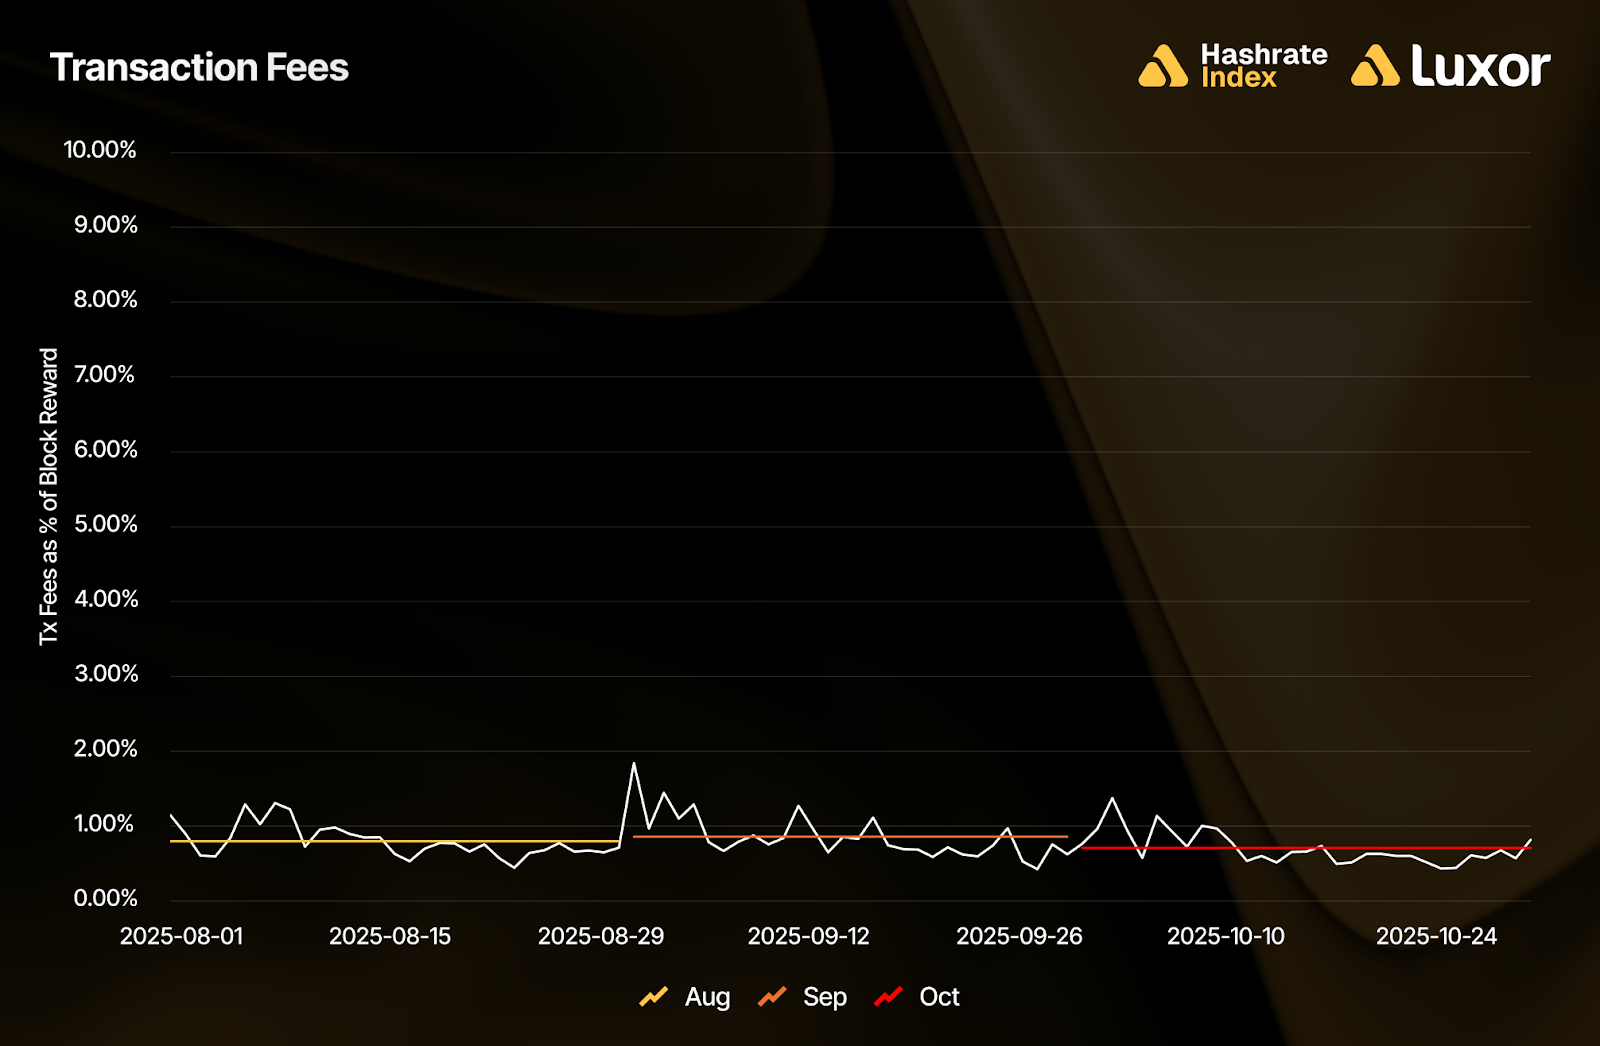
Transaction fees saw a further downturn in October. On a BTC-denominated basis, miners collected an average of 0.022 BTC (per block per day), a 17.9% decrease from September, and the lowest since February 2011. With a slight rise in bitcoin price action, the picture was more palatable on a USD-denominated basis: average fee collection came out to $2,573 (versus $3,052 in September), a 15.7% decrease. Overall, transaction fees constituted 0.71% of total block rewards, compared to 0.86% in the prior month.
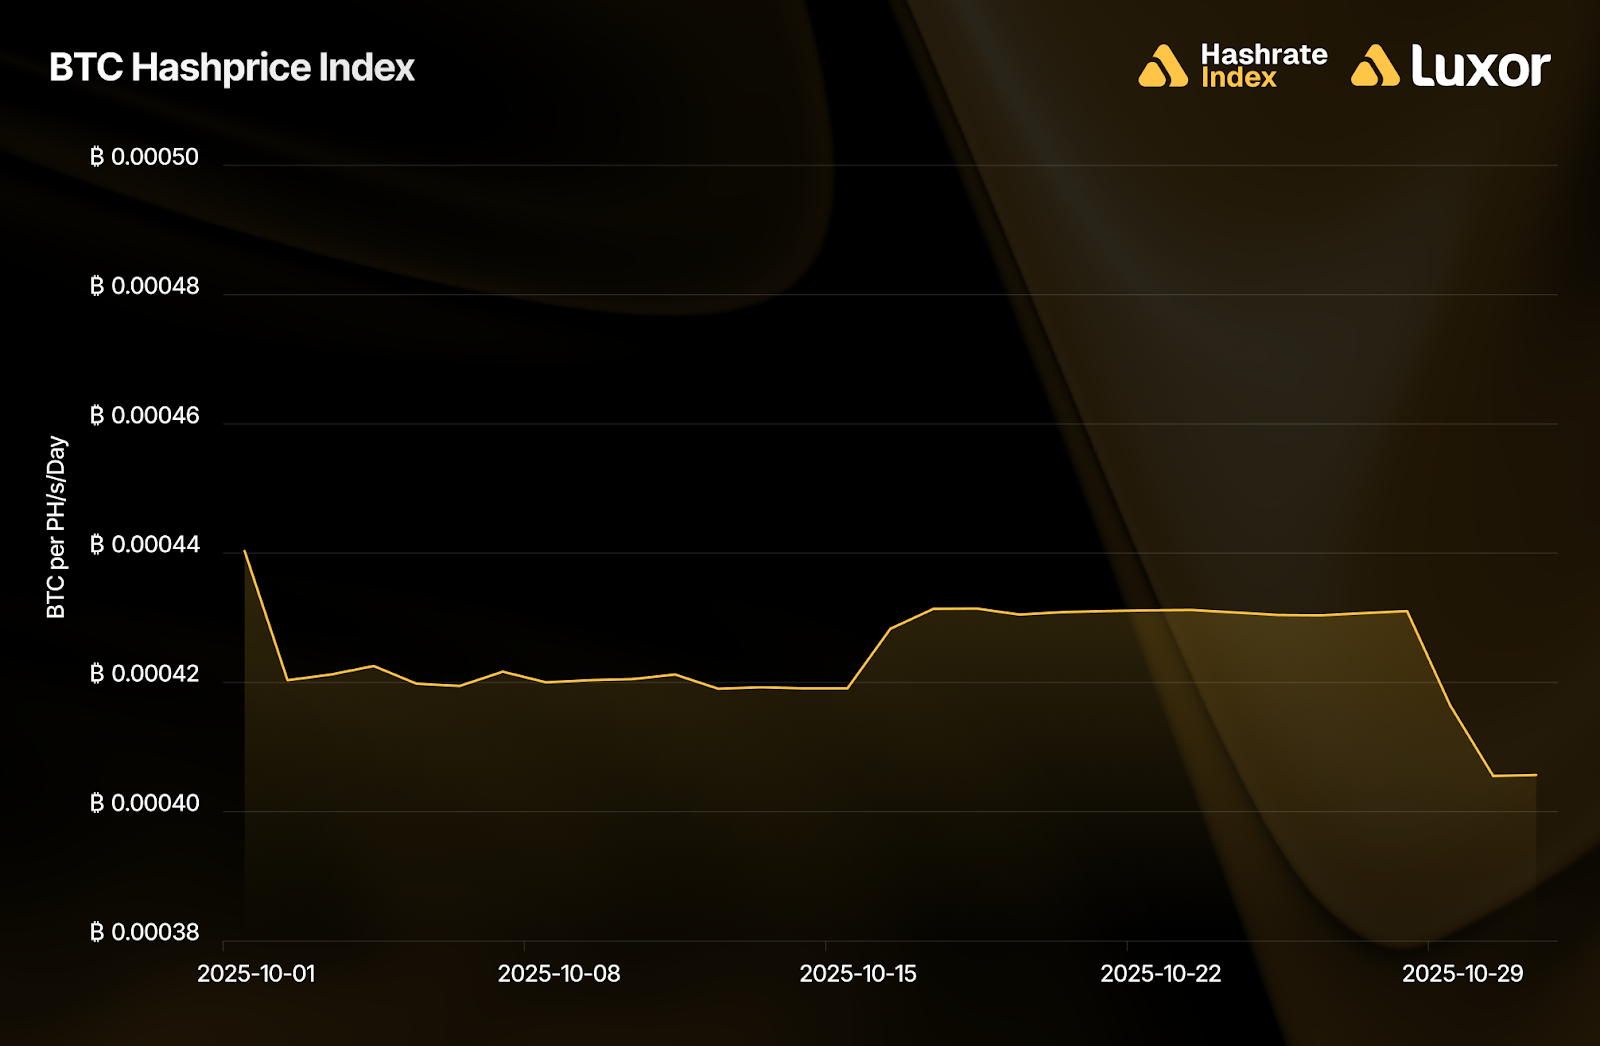
BTC-denominated hashprice mostly reflected network difficulty adjustments in October. It began at 0.00044 BTC per PH/s/Day and trailed down toward 0.00041 BTC following the two positive difficulty adjustments on October 1 and October 29. The negative adjustment on October 16 provided momentary relief, but overall BTC hashprice averaged 0.00042 BTC per PH/s/Day, declining 7.9% month-over-month.
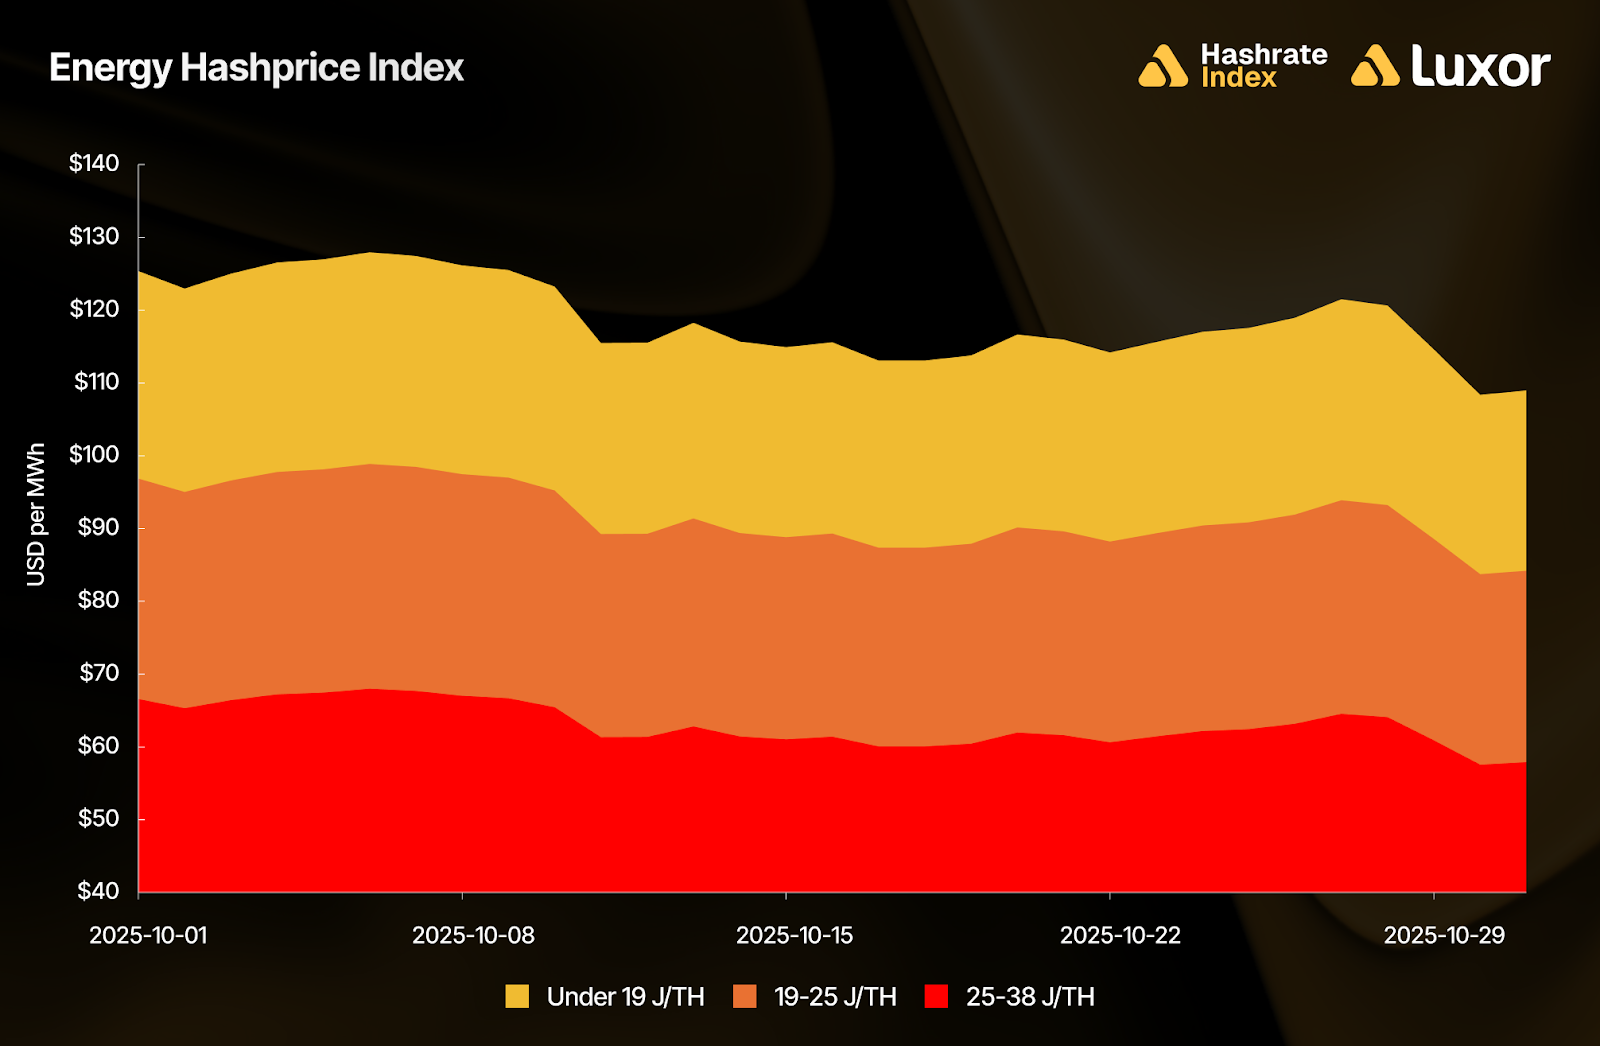
In October, operations with sub-19 J/TH fleets earned approximately $119 per MWh in mining revenues, whereas miners in the 19-25 J/TH tier earned $92 per MWh and the 25-38 J/TH tier earned $63 per MWh, respectively. Since new-generation fleets enable wider operating margins, there is a strong incentive for miners to continue deploying these machines from a compute revenue-per-watt perspective, which continues to result in network hashrate growth.
October 2025 Hashrate Market Activity
Our analysis of the October 2025 hashrate market focuses on two key points: how the October 2025 hashrate contract traded in previous months and how the forward curve shifted in October, based on pricing for forward hashrate during the month.
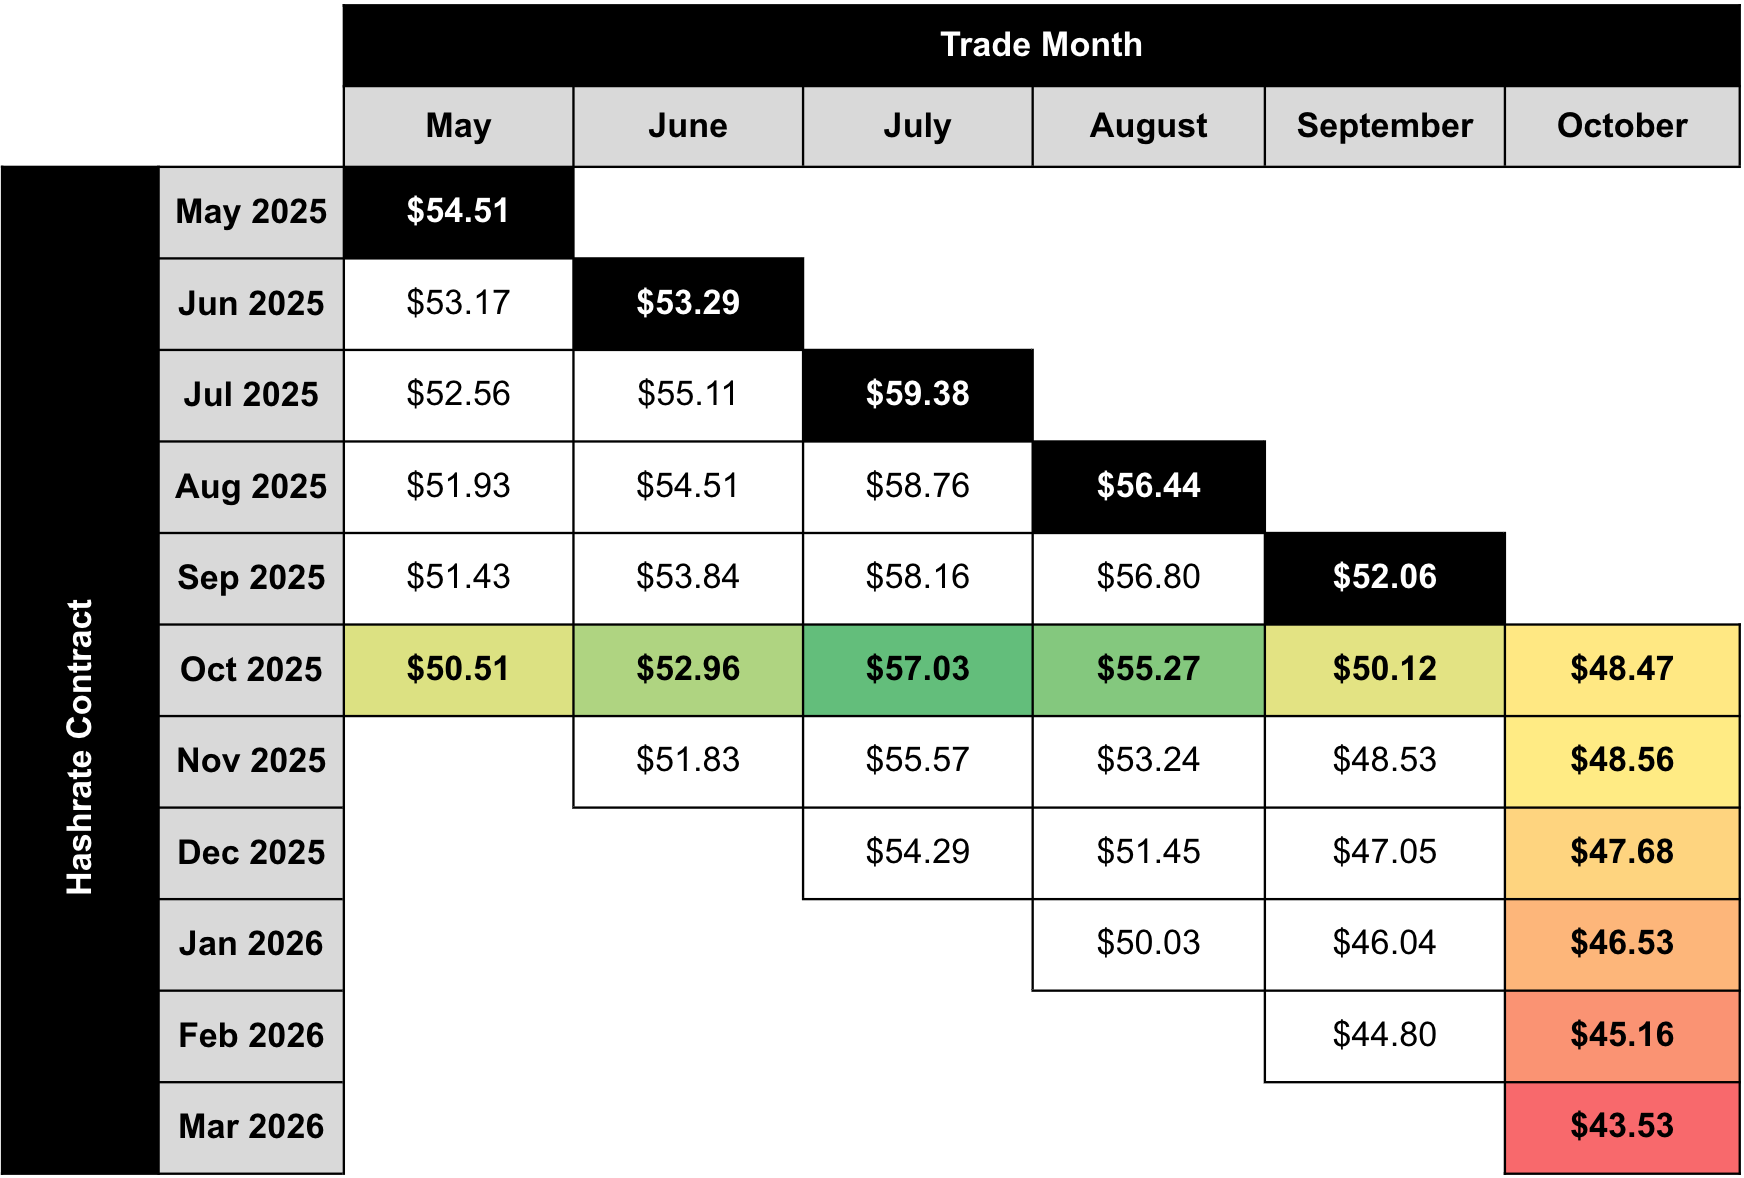
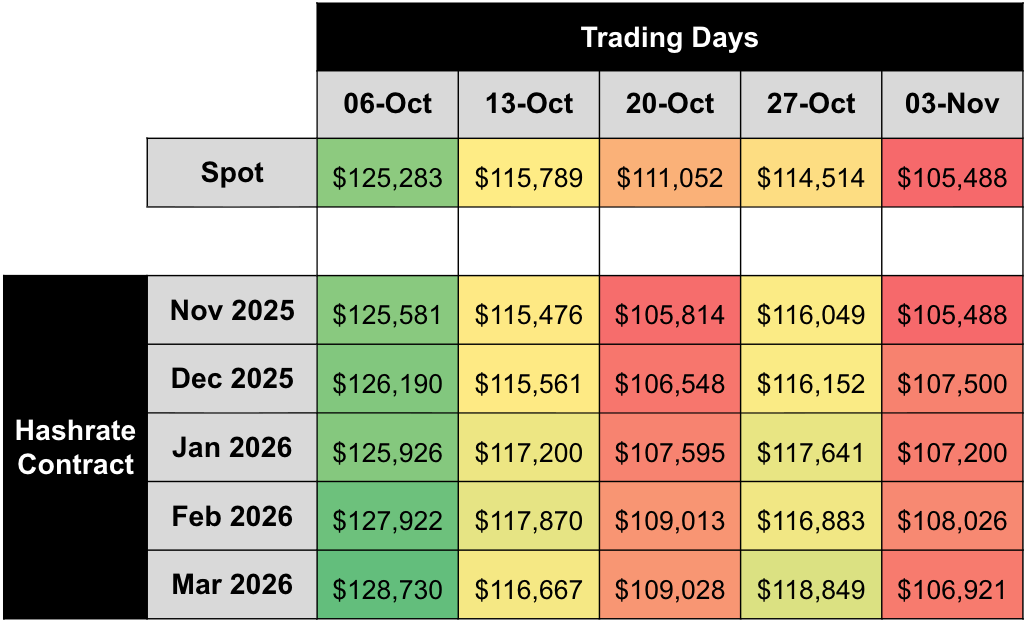
The two tables below show the evolution of Luxor’s USD and BTC denominated hashrate forward markets from May 2025 – October 2025. Rows represent specific monthly contracts, while columns represent each trading month. Cell values indicate the average monthly mid-market hashprice — except for the bold highlighted main diagonal — which shows actual spot hashprice settlement in each month.
This table summarizes both the trading history of the October 2025 USD contract (colored row) and the forward curve in October (colored column).
This table summarizes both the trading history of the October 2025 BTC contract (colored row) and the forward curve in October (colored column).
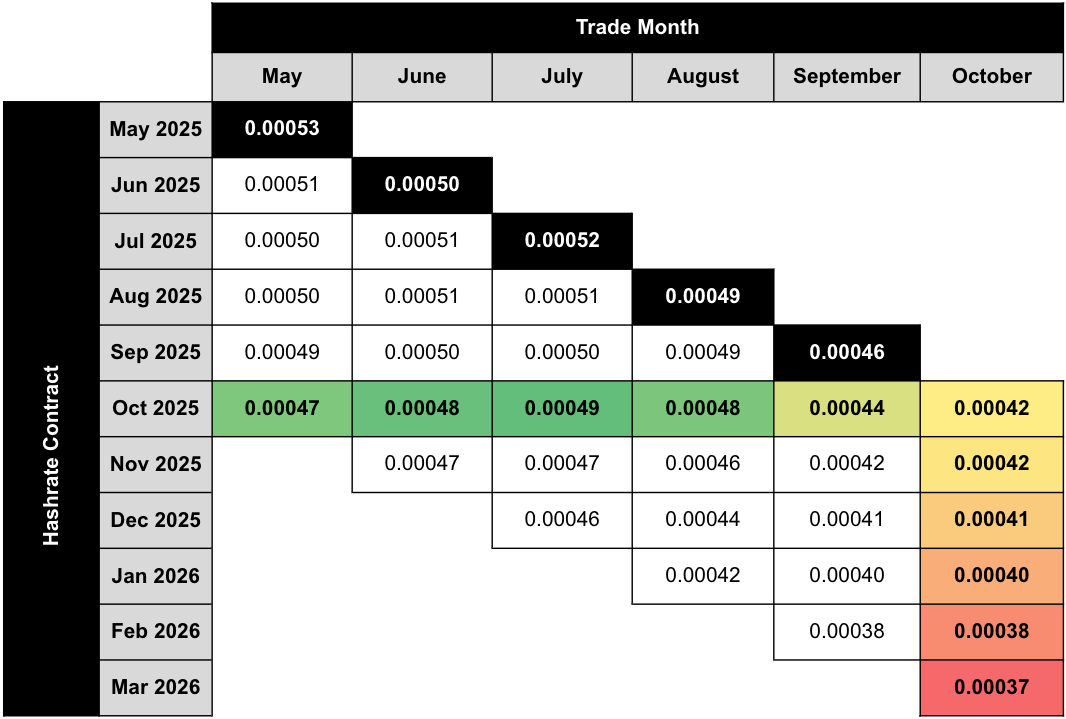
Note: all values (except for the bold highlighted main diagonal) shown in figures represent mid-market rates, the midpoint of the best bid and ask on Luxor's Non-Deliverable Hashrate Forward market. The bold highlighted main diagonal shows actual spot hashprice settlement in each month, measured by Luxor’s Bitcoin Hashprice Index.
The table below shows the type of market participants on the buy and sell side of Luxor’s deliverable (DF) and non-deliverable hashrate forward (NDF) market. In October, lenders were active on the buy side of the DF market, while public and private miners used the contract to sell forward, receive financing, and expand their fleet.
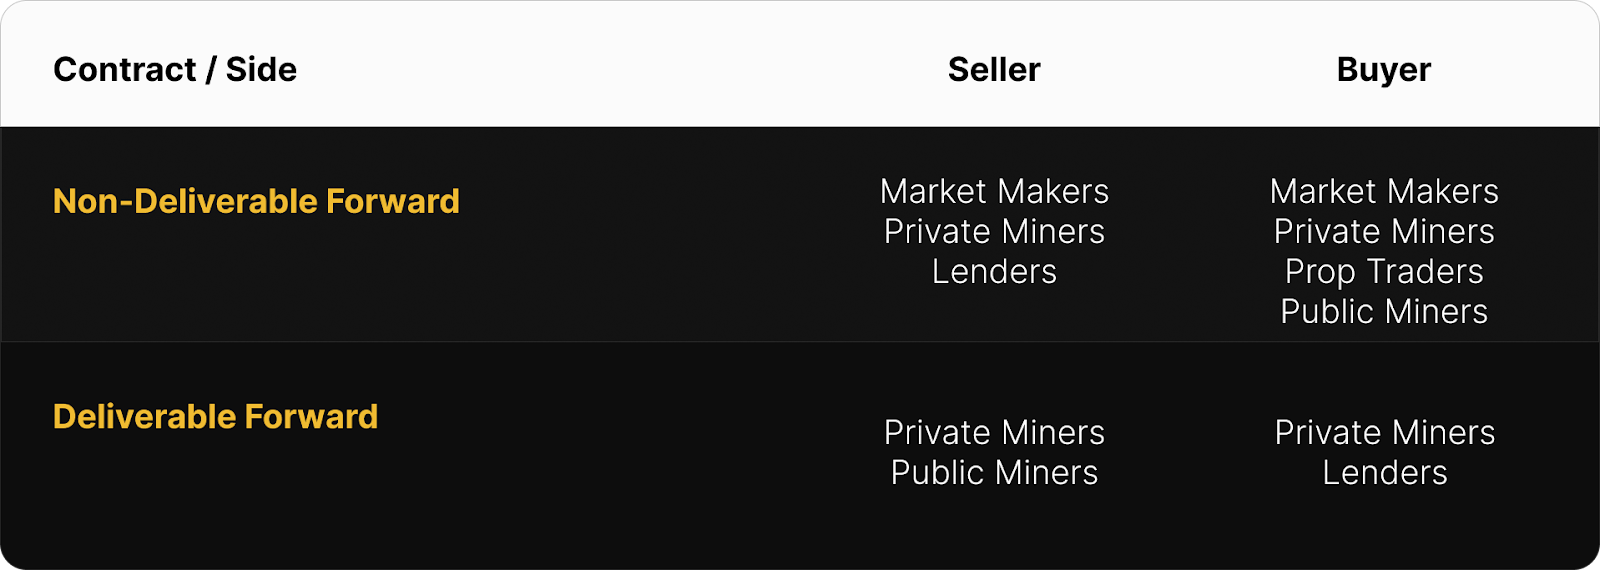
Since the DF involves upfront payment, it tends to trade at a discount to the NDF, compensating the buyer for the inherent credit risk. We see the discount of DF’s relative to NDF’s as the interest rate in hashrate-based lending markets. Buyers and sellers of the DF with upfront payment can use the NDF to lock-in a fixed yield (cost of capital) instead of having exposure to hashprice uncertainty.
This strategy was used by lenders (Buy DF & Sell NDF) to earn a BTC-denominated return and by miners (Sell DF & Buy NDF) to obtain non-dilutive financing. In October 2025, that yield (cost of capital) was in the 8–13% (annualized) range.
How October 2025 Hashrate Traded

In both USD and BTC terms, October 2025 favored sellers across the board. As hashprice fell through the month, forward sellers outperformed spot mining (FPPS) across all intervals. USD contracts cleared between $50.12–$57.03 per PH/s/Day versus a $48.47 settlement, while BTC contracts traded between 0.00044 BTC – 0.00047 BTC versus 0.00042 BTC spot.
The tables below summarize how a 1 EH mining operation would have performed by selling October 2025’s hashrate forward — one showing USD revenue outcomes, and the other showing total BTC production — compared to spot mining via FPPS.
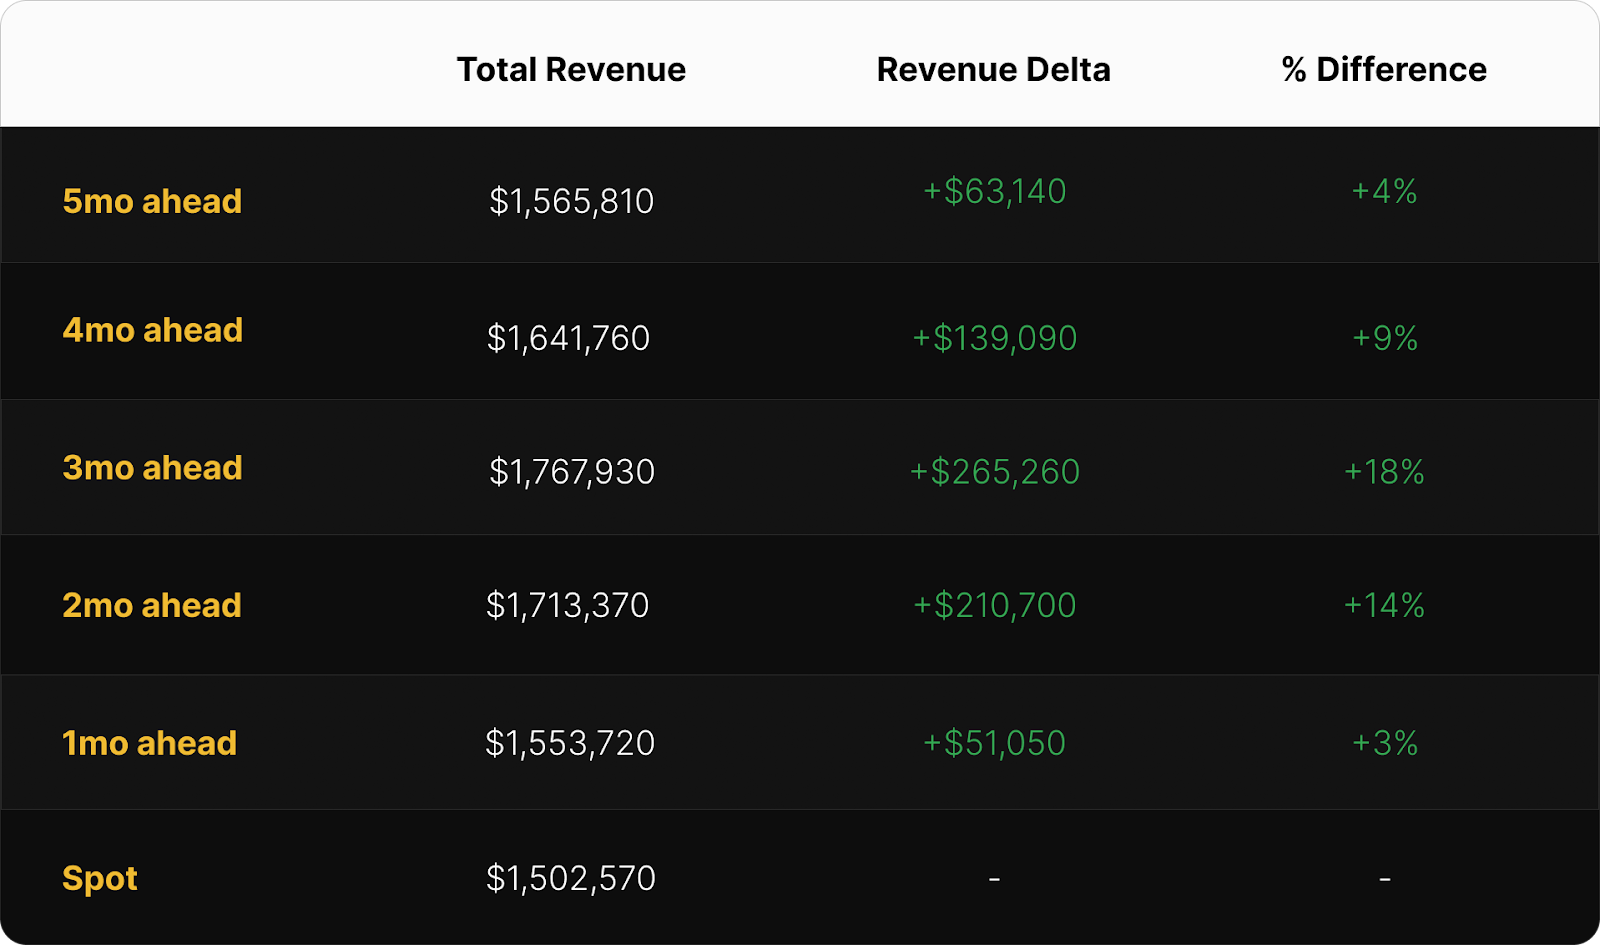
In USD terms, early forward sales (May–June) outperformed spot FPPS by 4–9%, while later hedges in August and September saw gains of 14% and 3%, respectively. The optimal trade for the USD-denominated October 2025 contract was to sell 3-months forward during July (+18%), which would have locked in a hashprice of $57.03 per PH/s/Day.
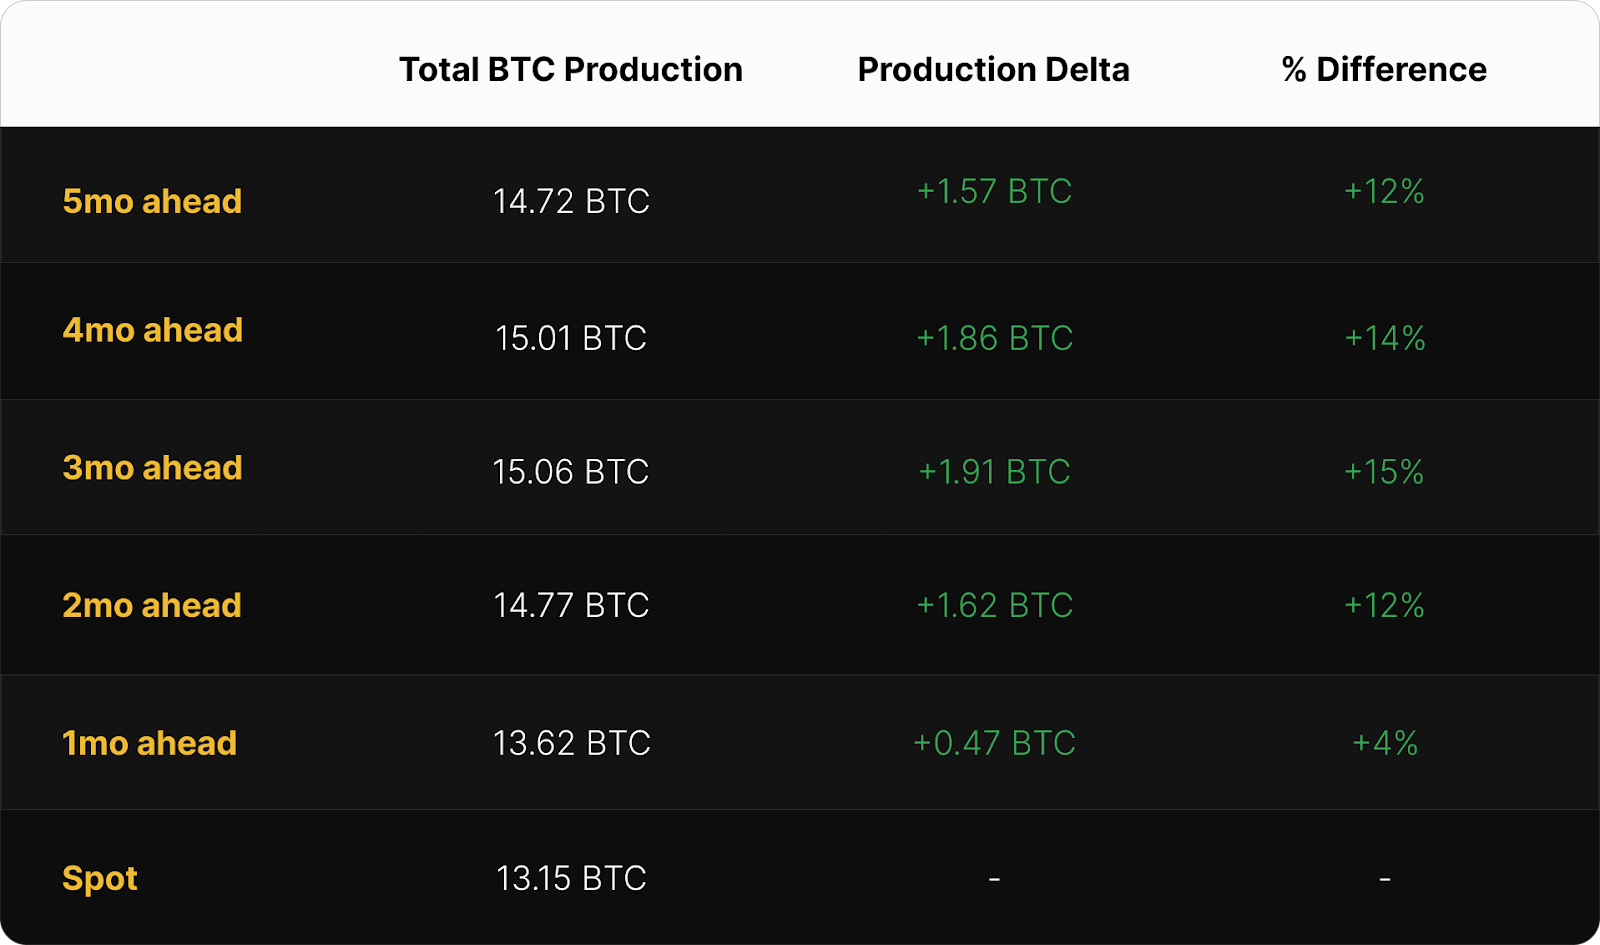
On the BTC-denominated side, sellers again came out ahead. Miners who sold October hashrate two or more months in advance earned over 12% more BTC than spot FPPS miners, with July’s three-month forward sales leading at +15%. Even one-month sellers outperformed FPPS by about 4%. Those who used upfront payouts even received immediate, non-dilutive capital in exchange for a fixed commitment to deliver hashrate over time.
Zooming out, the following chart shows the performance for a range of rolling hedge strategies relative to spot FPPS mining, segmented by contract denomination and hedge horizon over the past year, from October 2024 – October 2025:
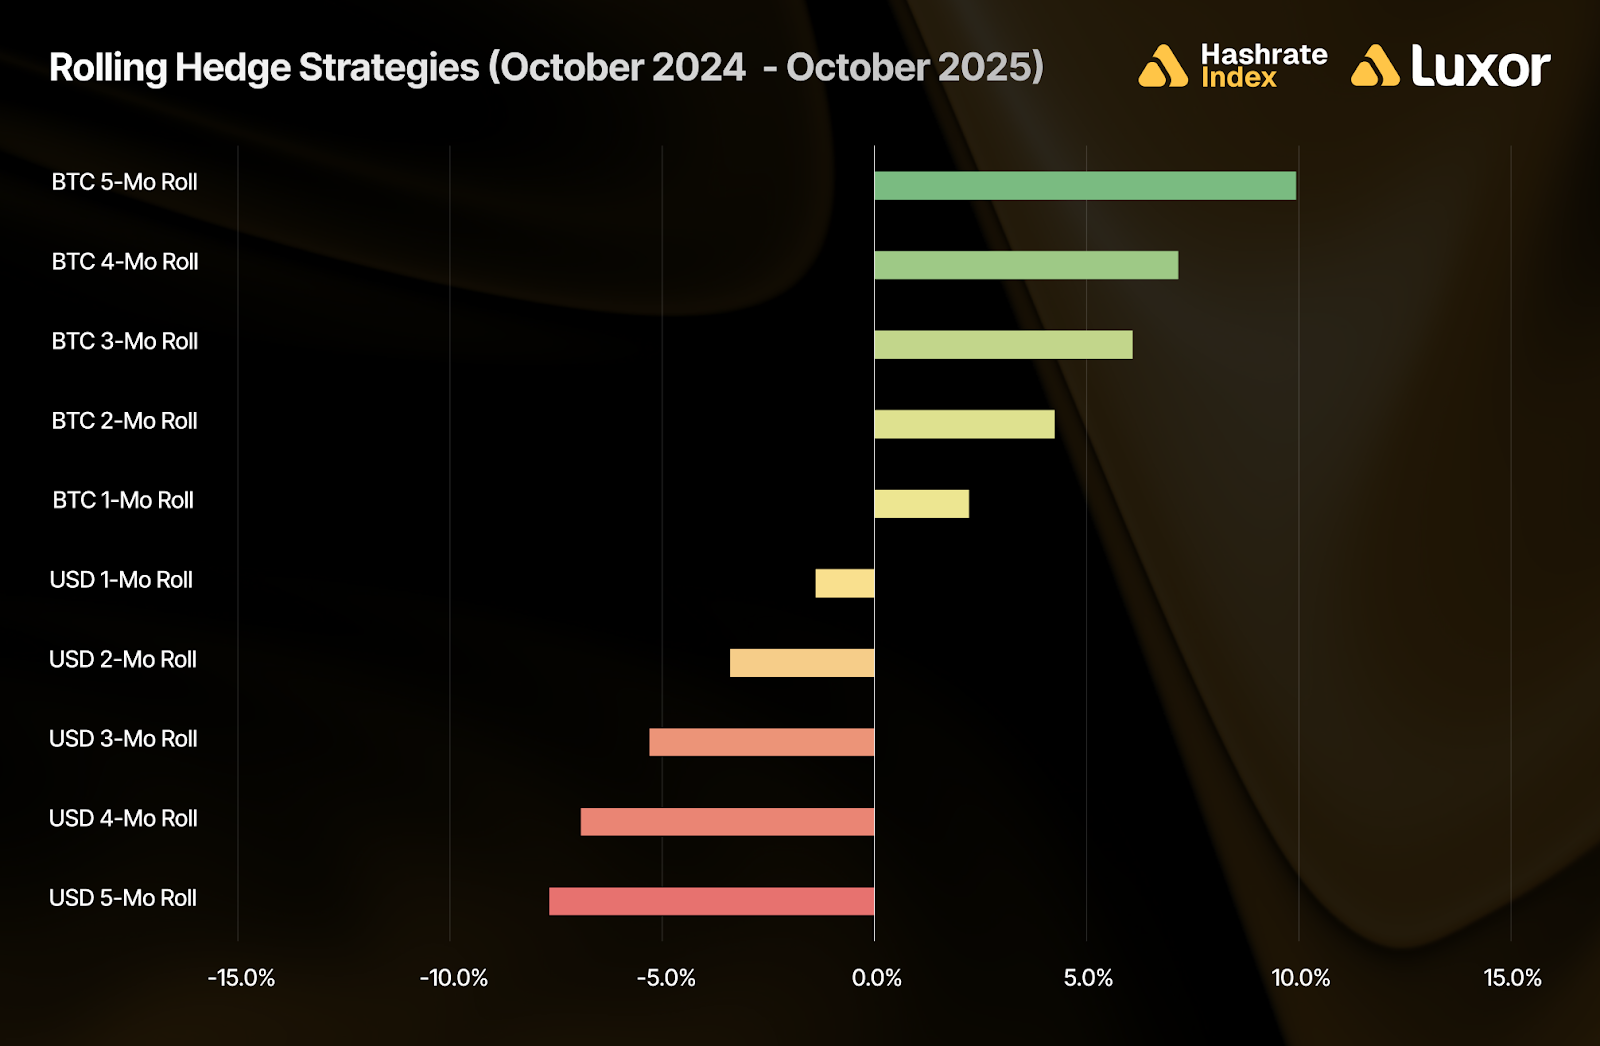
This comparison reveals that rolling BTC-denominated hedging strategies outperformed between October 2024 and October 2025, with the strongest results coming from 5-month (+9.9%) and 4-month forward sales (+7.2%). These longer-duration contracts benefited from being priced ahead of rising network difficulty and low fee environments, while still maintaining bitcoin price exposure. In contrast, USD-denominated hedging underperformed spot FPPS by an average of -4.9% because of rising bitcoin price action.
Miners who locked in fixed BTC pool payouts between October 2024 and October 2025 were better insulated from the hashprice decline driven by difficulty increases and weak transaction fee activity. Those who used upfront payouts even went a step further by front-loading revenue for non-dilutive growth.
Note: these figures are strictly for demonstration purposes and exclude fees and bid/ask spreads associated with entering into hashrate forward contracts.
A second caveat: although selling forward proved to be favorable during timeframes shown above, it is critical to recognize that hedging is typically a cost of business rather than a revenue generation method. Hedgers willingly pay a price to buy certainty and obtain more predictable cash flows, which increases valuation, reduces cost of capital, and ultimately attracts investments.
How Future Hashrate Traded in October 2025
The two tables below summarize the evolution of hashrate forward markets during October 2025, for the subsequent five months from November 2025 – March 2026. Rows represent specific monthly hashrate contracts, while columns represent specific trading days. Cell values indicate the average daily mid-market price, except for spot prices.

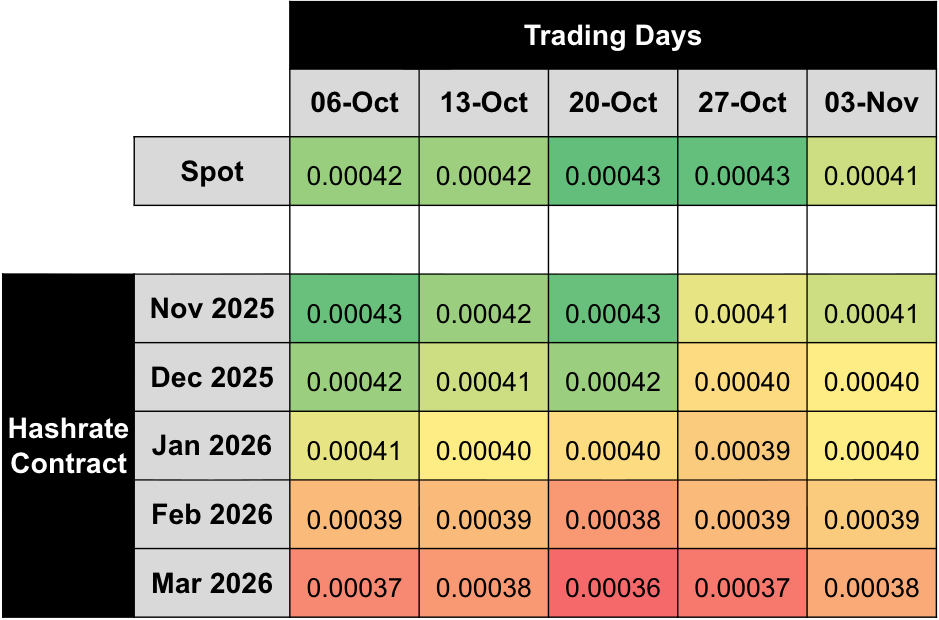
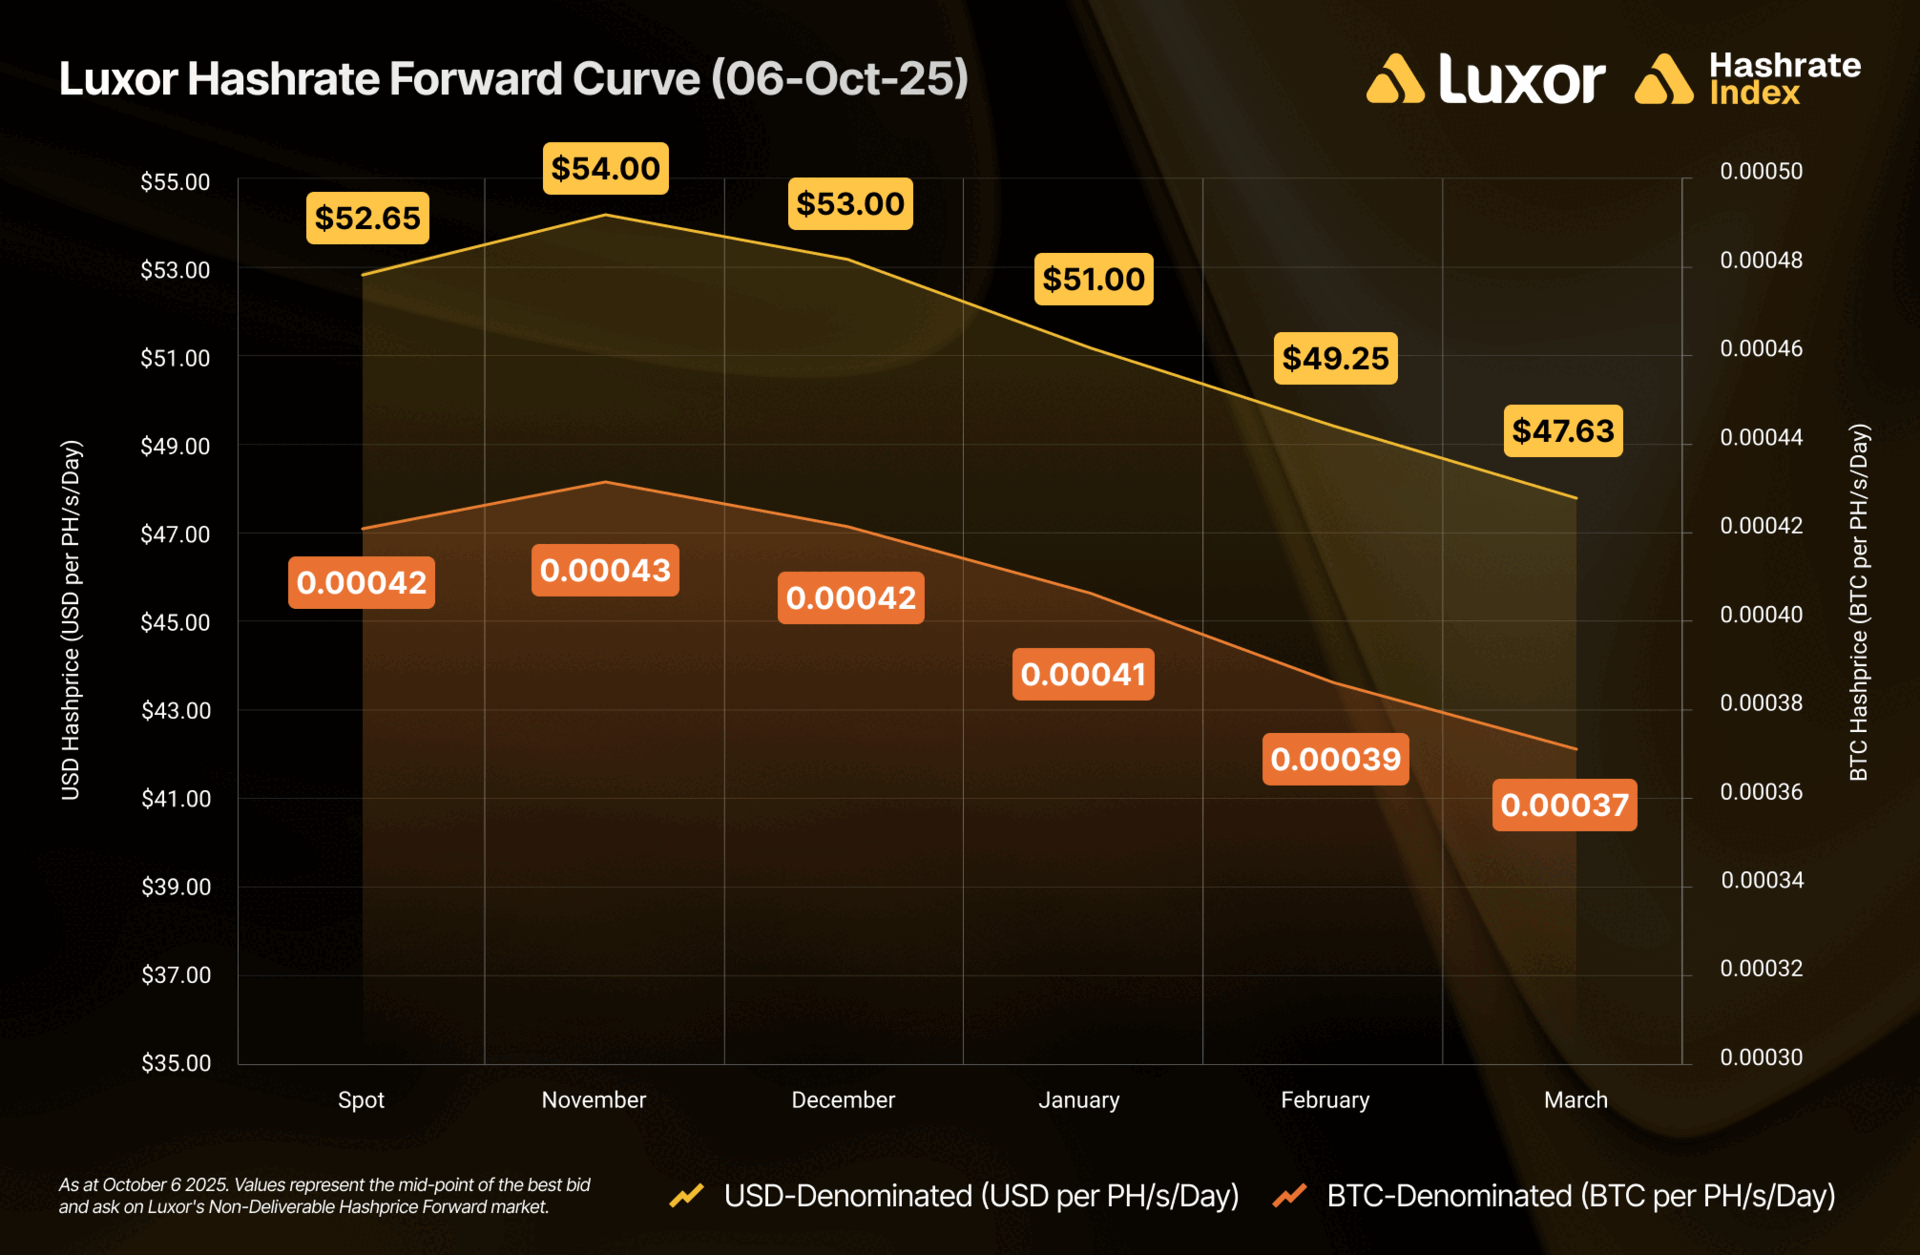
Between October 6 and November 3, USD-denominated forwards for November 2025 – March 2026 fell 14–20% alongside spot hashprice. BTC contracts moved differently: front-end (November 2025 – January 2026) slipped 1–5%, while tail-end contracts (February 206 – March 2026) rose 1–3%. This implies expectations of weaker near-term USD revenues but some relief on the network side (i.e., slower difficulty growth and/or higher transaction fees). All contracts traded in backwardation, with the front month briefly in contango early in the period.
By dividing USD contract hashprice values with BTC contract hashprice values, we can back out implied bitcoin price expectations expressed by the forward hashrate market. Throughout October, implied bitcoin price expectations traded mostly in contango and fell 15–17%, reflecting bullish sentiment overall, but a reassessment of near-term price action in spot BTC markets.
If we make an assumption around transaction fees, we can also calculate changes in implied network difficulty and hashrate expectations expressed by the forward hashrate market. In the two tables below, we assume a 0.022 BTC per block transaction fee collection on October 6 and a 0.020 BTC per block on November 3, respectively:
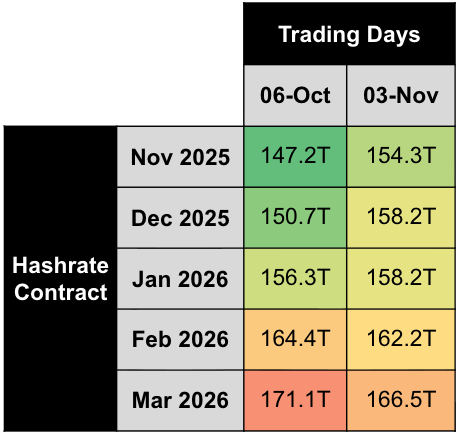
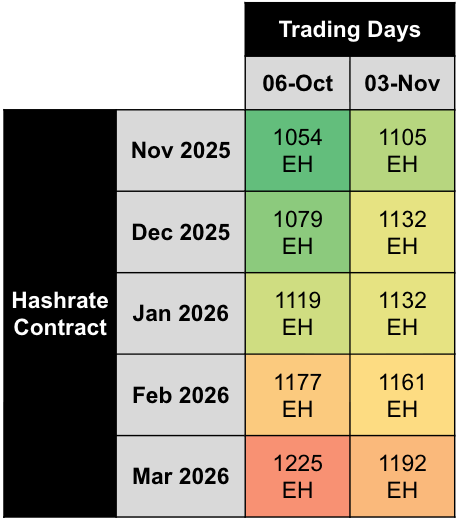
Note: figures assume 0.022 BTC per block transaction fee collection on October 6 and 0.020 BTC per block on November 3, 2025.
Based on this simple analysis, we estimate that future hashrate expectations were mixed during the month of October, rising by ~1–5% for the November 2025 – January 2026 contracts, but falling by ~1–3% for the February 2026 – March 2026 contracts.
Concluding Thoughts and Looking Ahead
October 29’s positive difficulty adjustment (+6.31%) sent network difficulty to a new and current all-time high of 155.87T. Since then, USD hashprice has trended down back to the low $40’s per PH/s/Day. With network hashrate (30D-SMA) currently standing at 1,120 EH/s, we anticipate growth to continue, but potentially slow in the coming months.
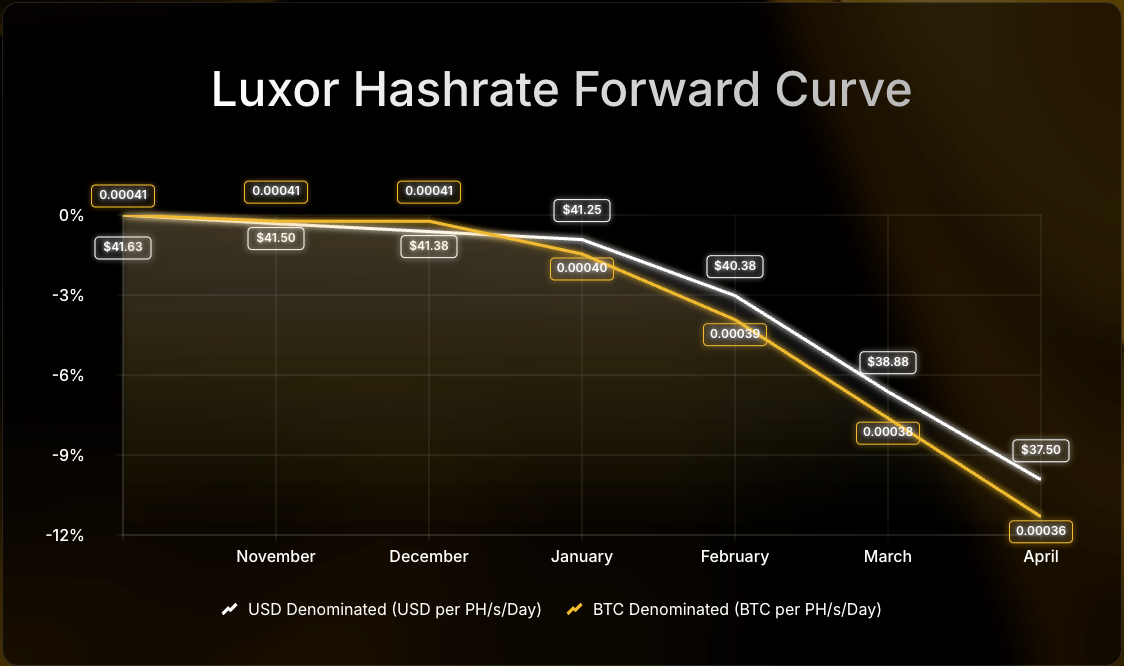
Looking forward, Luxor’s Hashrate Forward Market is pricing in an average hashprice of $40.15 or 0.00039 BTC per PH/s/Day over the next six months. Sellers can currently secure this hashprice while buyers have the opportunity to lock in the same hashcost through April 2026.
If you’d like to learn more about Luxor’s Bitcoin mining derivatives, please reach out to [email protected] or visit https://www.luxor.tech/derivatives.
About Luxor Technology Corporation
Luxor delivers hardware, software, and financial services that power the global compute and energy industry. Its product suite spans Bitcoin Mining Pools, ASIC Firmware, Hardware trading, Hashrate Derivatives, Energy services, and a bitcoin mining data platform, Hashrate Index.
Disclaimer
This content is for informational purposes only, you should not construe any such information or other material as legal, investment, financial, or other advice. Nothing contained in our content constitutes a solicitation, recommendation, endorsement, or offer by Luxor or any of Luxor’s employees to buy or sell any derivatives or other financial instruments in this or in any other jurisdiction in which such solicitation or offer would be unlawful under the derivatives laws of such jurisdiction.
There are risks associated with trading derivatives. Trading in derivatives involves risk of loss, loss of principal is possible.


Hashrate Index Newsletter
Join the newsletter to receive the latest updates in your inbox.


