
Luxor Hashrate Lookback Series – August 2025
August 2025’s hashrate and hashprice trends, forward market participation, trading activity and contract performance.
Luxor’s Monthly Lookback Series is a deep dive into Bitcoin hashrate market activity. In this post, we cover August 2025’s hashrate market and hashprice trends, forward market participation, trading activity and contract performance.
Summary
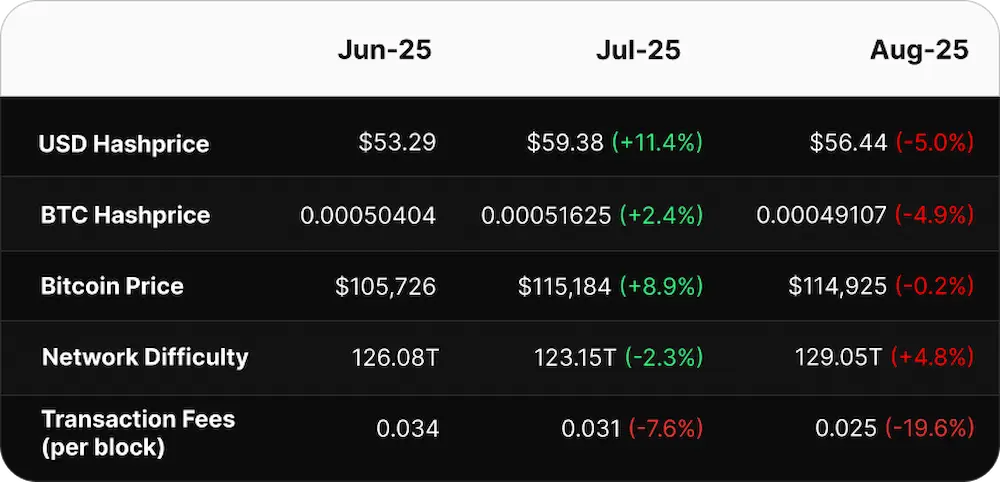
- Hashprice Cools Off: After July’s rebound, mining economics weakened in August as USD-denominated hashprice fell -5.0% to an average of $56.44 per PH/s/day.
- Bitcoin Flatlines: BTC began the month at $114,830, briefly rallied to ~$120,815, then slid down to close at $108,813. The monthly average of $114,925 marked little change from July.
- Difficulty at Record Highs: Network difficulty resumed its climb, increasing +4.8% to a new all-time high of 129.70T. Average block times of 9 minutes 18 seconds implied miners were running ~7.6% more hashrate than the network’s target.
- Fees Fall Further: In BTC terms, transaction fees fell to their lowest level since November 2011 with miners earning just 0.025 BTC per block per day. In USD terms, fees came in at ~$2,904 per block per day, the lowest level since January 2023.
- Hashrate Hedging: BTC-denominated hedging outperformed spot FPPS mining. Sellers who locked in BTC-denominated forward sales earlier in the year captured up to +12.5% additional BTC production, while USD-denominated hedges underperformed by an average of -2.9%.
August 2025 Spot Hashprice & Its Constituents
Following a rebound in July, mining economics experienced a downtrend in August. This was primarily fueled by an increase in monthly average network difficulty (+4.8%), with additional burn from a significant decline in transaction fees (-19.6%). Meanwhile, bitcoin price action was flat. Overall, USD-denominated hashprice averaged $56.44 (-5.0%), and BTC-denominated hashprice averaged 0.00049 BTC (-4.9%) per PH/s/day.
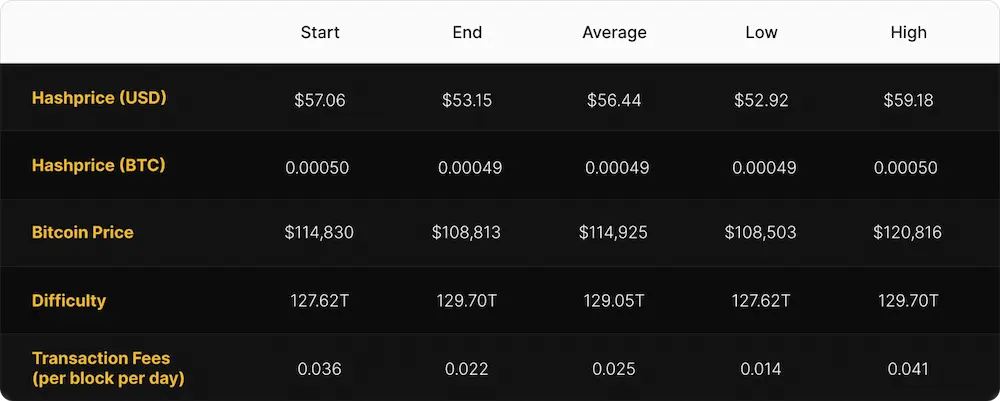
USD hashprice started the month at $57.06 per PH/s/day and rallied to a local peak of $59.18 on August 13, before settling back to $53.15 by month-end. This trend coincided with bitcoin price action. Overall, USD hashprice ranged between $52.92 – $59.18 and came out to a monthly average of $56.44, a 5.0% decline month-over-month.
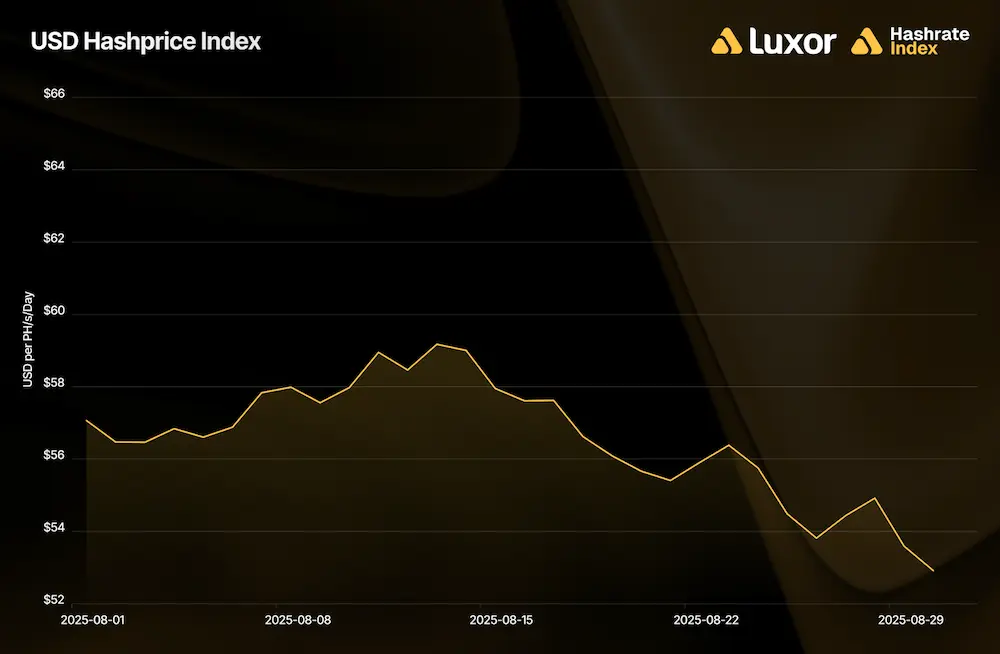
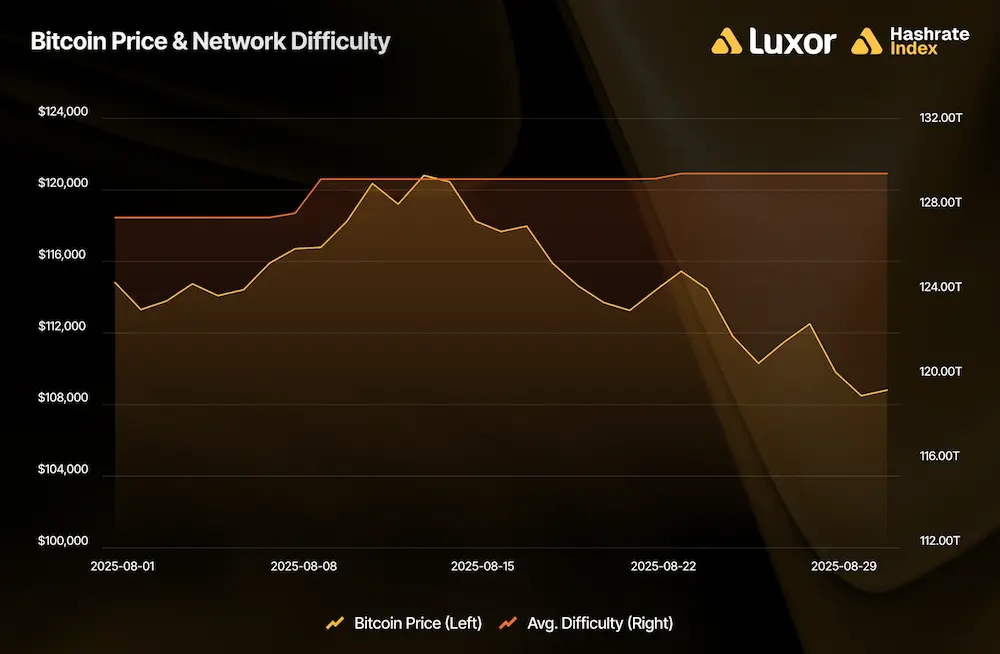
Average bitcoin price action was flat month-over-month in August. Starting at $114,830, BTC climbed steadily to a local peak of ~$120,815 on August 13, before gradually declining over the second half of the month to close off at $108,813. Overall, the monthly average BTC price was $114,925.
In July, the network’s monthly average difficulty had declined (-2.3%) for the first time since last year. This trend normalized in August as network difficulty increased (+4.8%) to 129.70T following two positive adjustments on August 8 (+1.42%) and August 22 (+0.20%) — a new all-time high. Overall, the monthly average network difficulty experienced by operators came in at 129.05T versus July's 123.15T.
The positive difficulty adjustments were caused by quicker-than-target block times in August. 24 out of 31 days (77%) in August averaged block times below the 10-minute target, with an overall average of 9 minutes 18 seconds (9.297 minutes) for the month.
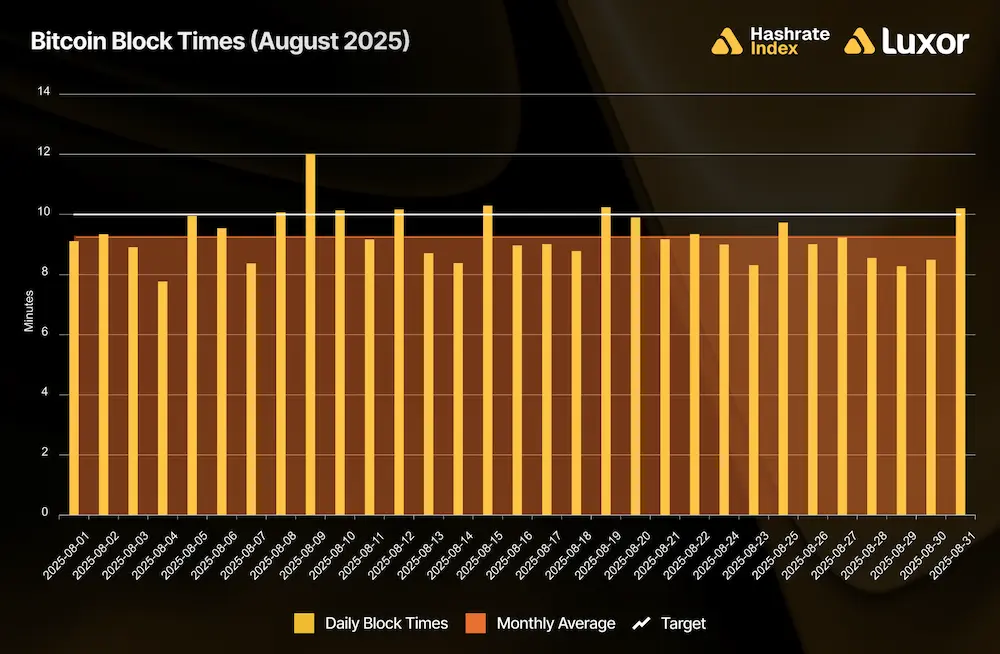
August’s block production at 9.297 minutes per block implies miners were running ~7.6% more hashrate than the network targeted. In other words: miners added machines, improved uptime & efficiency, and/or curtailed less, which triggered upward difficulty adjustments as total compute power increased.
Over the summer, one of the most important drivers of difficulty and hashrate has been ERCOT’s Four Coincidence Peaks (4CP) program. 4CP measures a large industrial customer’s demand during the grid’s four highest-load hours across June, July, August, and September — typically late afternoons on the hottest weekdays. The benchmark for these intervals is known as the high-water mark, representing the highest observed system load each month. The higher a customer’s load during those intervals, the more they pay in transmission charges the following year. To avoid these penalties, many large miners in ERCOT curtail during potential 4CP hours. With an estimated 17% of global hashrate located in Texas, the impact is significant: full curtailment during high-risk hours can represent ~6–7% of the global network going offline during a 4CP month.
But curtailment can cut both ways. On days when grid demand runs well below the monthly 4CP high-water mark, miners often stay online (or even overclock) to maximize revenue. The chart below illustrates this dynamic:
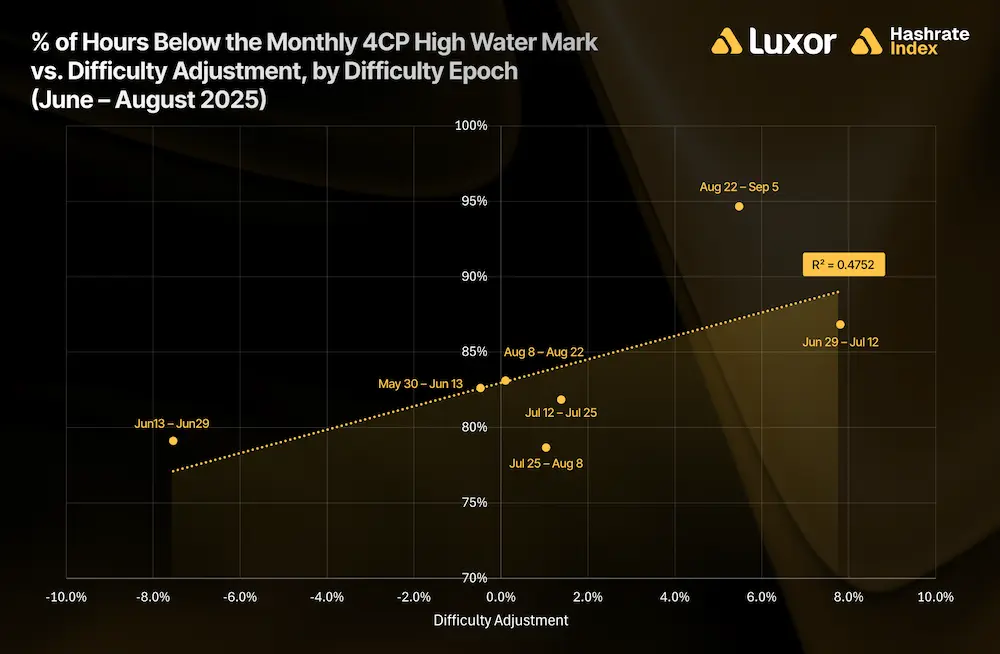
Between June – August 2025, we estimate 4CP conditions explained nearly half of the variation in difficulty adjustments (R² ≈ 0.48). The more hours ≥4% below the rolling monthly 4CP high-water mark, the higher the subsequent difficulty adjustment was. In other words, the more time the grid spent well below the 4CP high-water mark, the more miners stayed online and depressed hashprice.
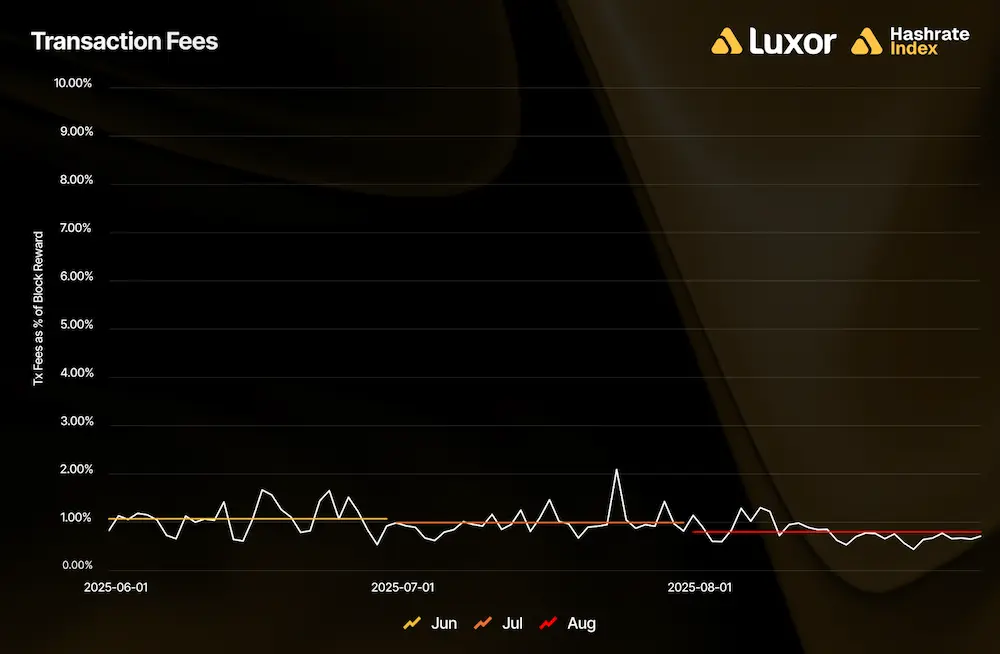
Transaction fees continued to go lower in August. During the month, fees picked up in the first week but gradually cooled off over the rest of the period. However, this was not enough to make any contribution to the overall pot. On a BTC-denominated basis, miners collected an average of 0.025 BTC (per block per day), a 19.6% decline from July and the lowest since November 2011. With flat bitcoin price action, the picture was essentially the same on a USD-denominated basis: average fee collection came out to $2,904, a 19.9% decline versus $3,626 in July and the lowest since January 2013.
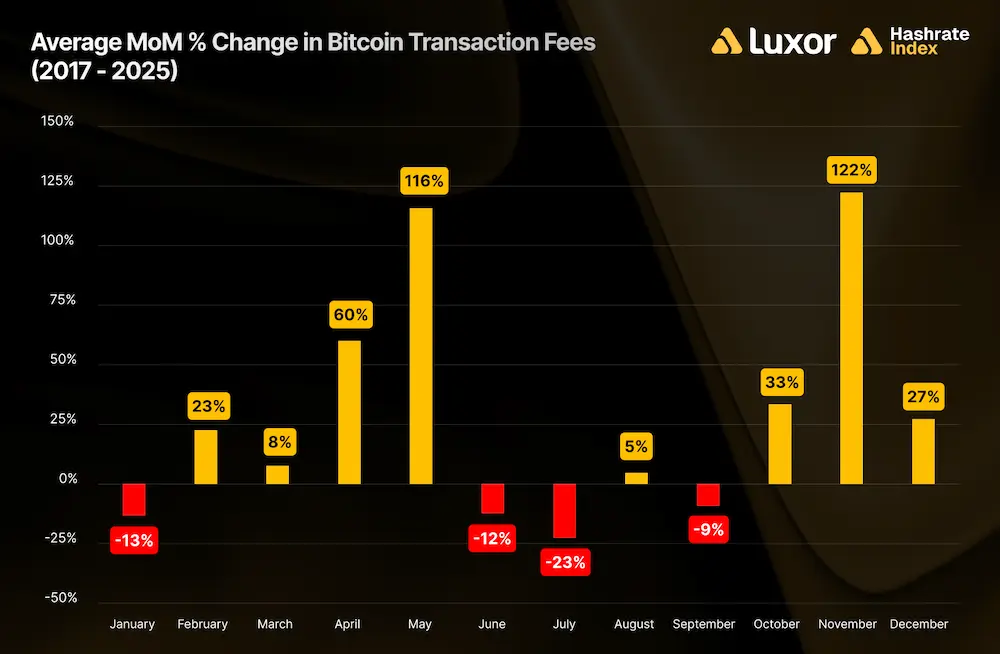
Looking beyond August, a longer-term seasonal pattern emerges in Bitcoin transaction fees. Historical data from 2017–2025 shows that transaction fees tend to expand most strongly in spring (April–May) and again in Q4 (October–December), with May and November averaging triple-digit percentage increases month-over-month. By contrast, summer months (June–September) often contract, with July and September consistently marking the weakest points of the year. This recurring rhythm suggests that while fees are ultimately driven by blockspace demand, they have historically exhibited the seasonal tendency to peak during bull runs and cool during quieter summer months.
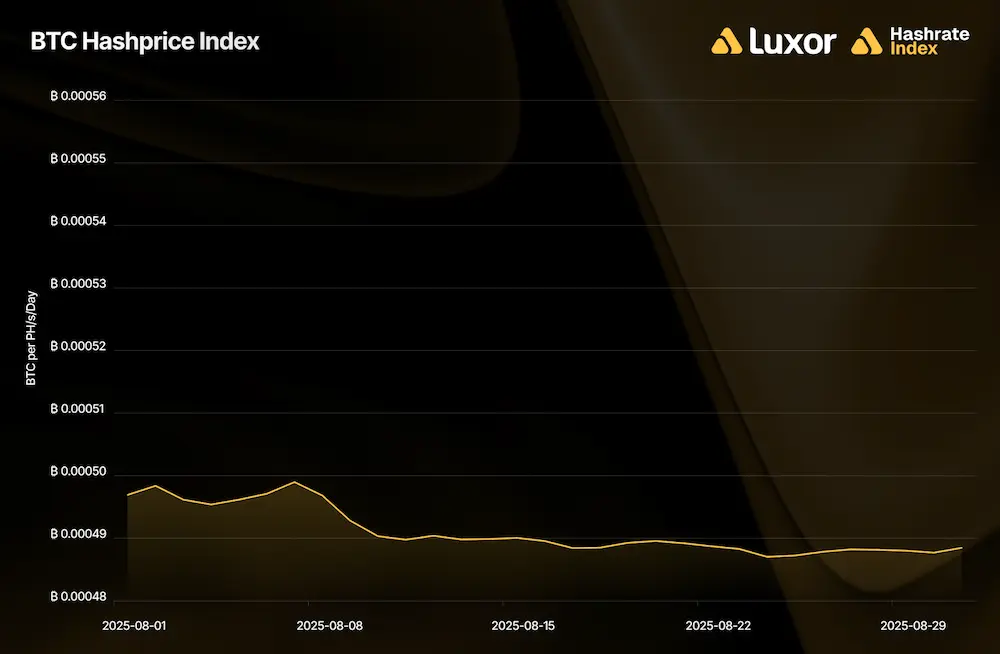
With muted transaction fees, BTC-denominated hashprice mostly reflected network difficulty adjustments in August. It began at 0.00050 BTC per PH/s/day and dipped to 0.00049 BTC following the two positive difficulty adjustments on August 8 and August 22. Overall, BTC hashprice averaged 0.00049 BTC per PH/s/day, declining 4.9% month-over-month.
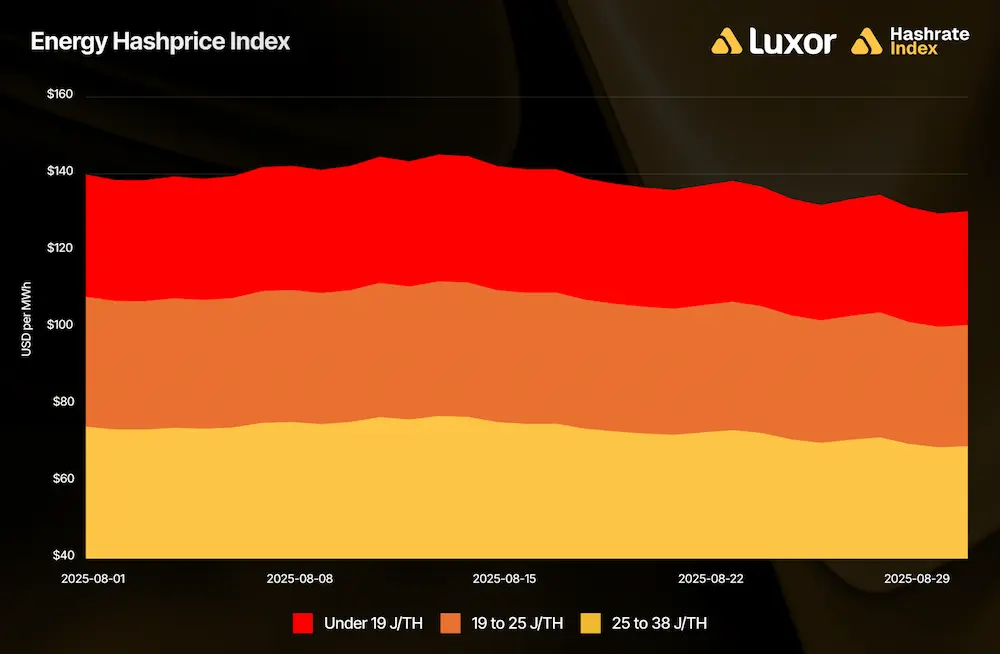
In August, operations with sub-19 J/TH fleets earned approximately $146 per MWh in mining revenues, whereas miners in the 19-25 J/TH and 25-38 J/TH efficiency tiers earned around $112 and $77 per MWh, respectively.
August 2025 Hashrate Market Activity
Our analysis of the August 2025 hashrate market focuses on two key points: how the August 2025 hashrate contract traded in previous months and how the forward curve shifted in August, based on pricing for forward hashrate during the month.
The two tables below show the evolution of Luxor’s USD and BTC denominated hashrate forward markets from March 2025 – August 2025. Rows represent specific monthly contracts, while columns represent each trading month. Cell values indicate the average monthly mid-market price — except for the bold highlighted main diagonal — which shows actual spot hashprice settlement in each month.
This table summarizes both the trading history of the August 2025 contract (colored row) and the forward curve in August (colored column).
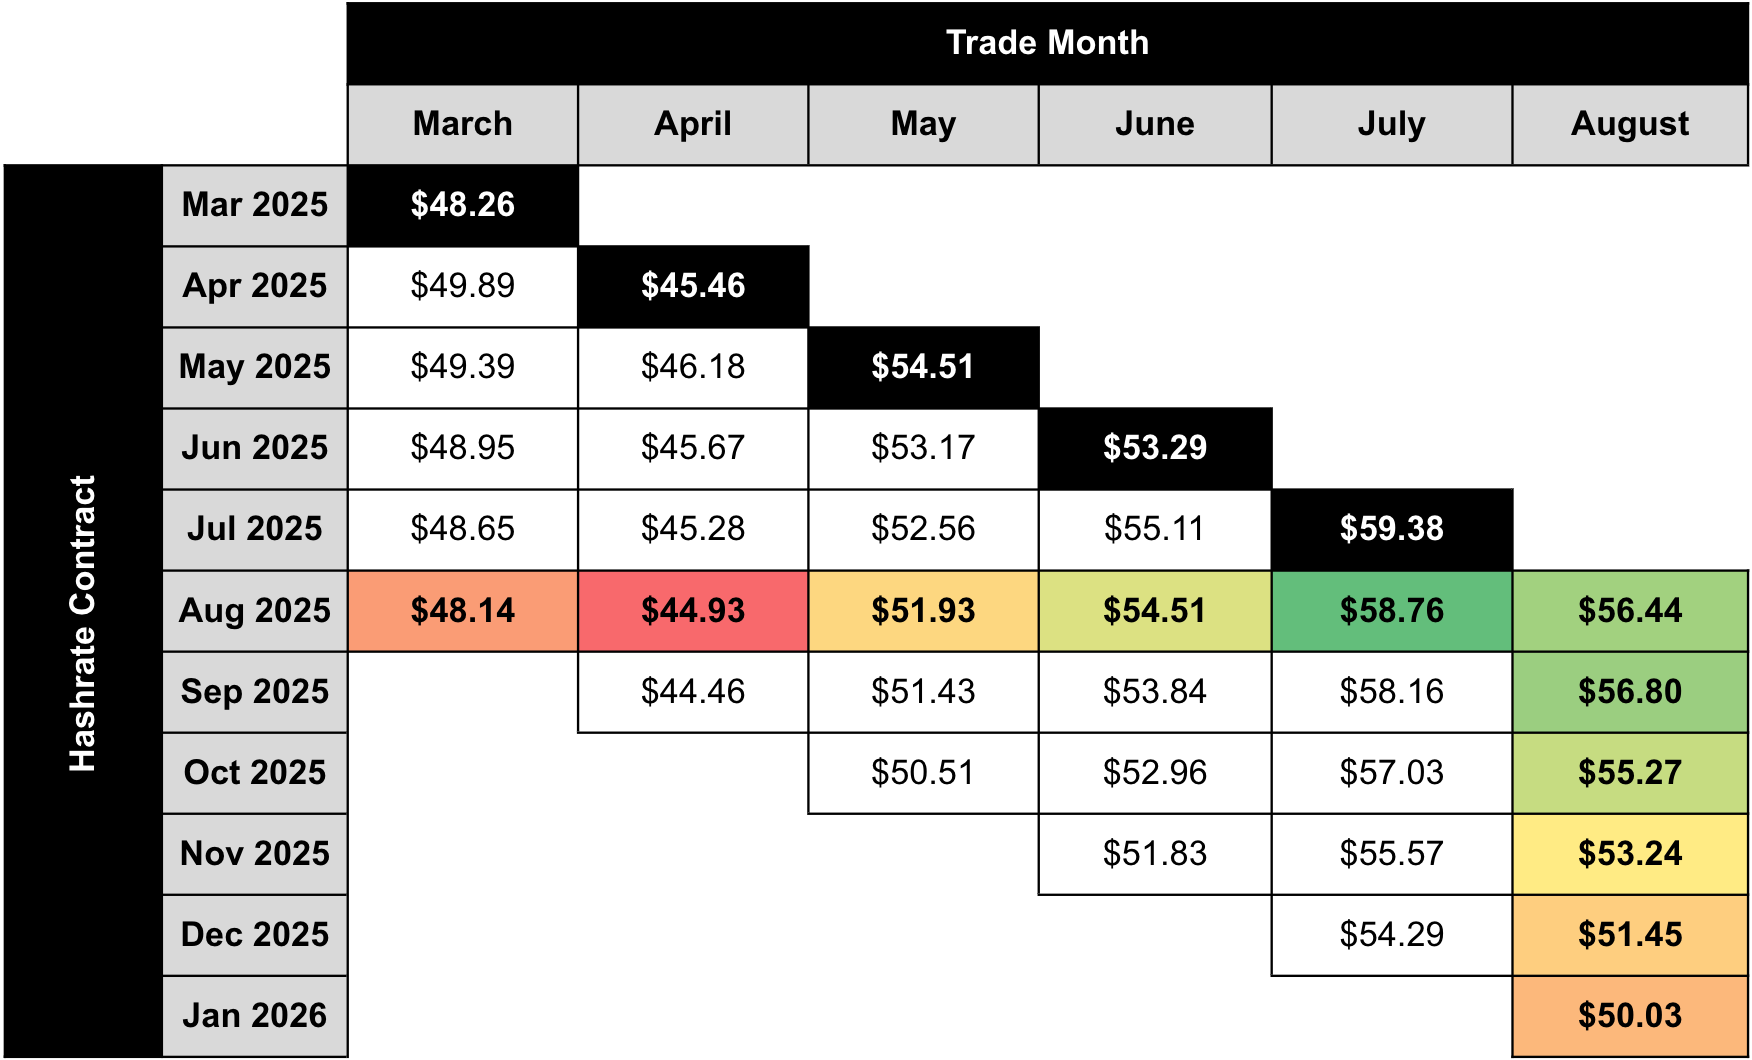
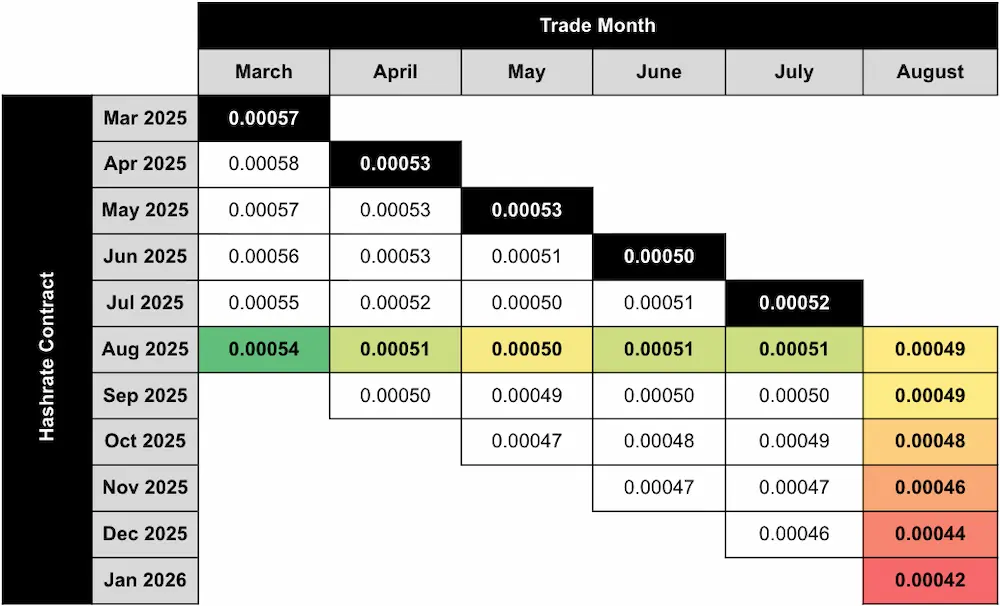
Note: all values shown in figures represent the midpoint of the best bid and ask on Luxor's Non-Deliverable Hashrate Forward market.
The table below shows the type of market participants on the buy and sell side of Luxor’s deliverable (DF) and non-deliverable hashrate forward (NDF) market. In August lenders were active on the buy side of the DF market, while public and private miners used the contract to sell forward, receive financing, and expand their fleet.
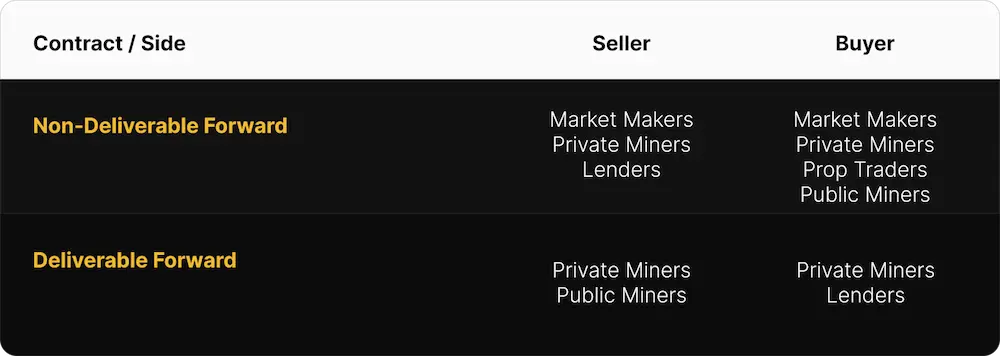
Since the DF involves upfront payment, it tends to trade at a discount to the NDF (compensating the buyer for the inherent credit risk). We see the discount of DF’s relative to NDF’s as the interest rate in hashrate-based lending markets. Buyers and sellers of the DF with upfront payment can use the NDF to lock-in a fixed yield (cost of capital) instead of having exposure to hashprice uncertainty.
This strategy was used by lenders (i.e., Buy DF & Sell NDF) to earn a BTC-denominated return and by miners (i.e., Sell DF & Buy NDF) to obtain non-dilutive financing. In August 2025, that yield (cost of capital) was in the 8-13% (annualized) range.
How August 2025 Hashrate Traded
In USD terms, the August 2025 contract was a win for most buyers, except for very late entrants (1-month out). The best strategy for miners and traders was to buy USD-denominated hashrate, locking in a fixed hashcost between March – July. As the hashrate market rallied, participants who entered earliest (in March or April during market declines) saw the highest gains, with the August contract’s hashprice reaching $58.76 per PH/s/day in July — well above their fixed hashcosts of $44.93 – $48.14 per PH/s/day.
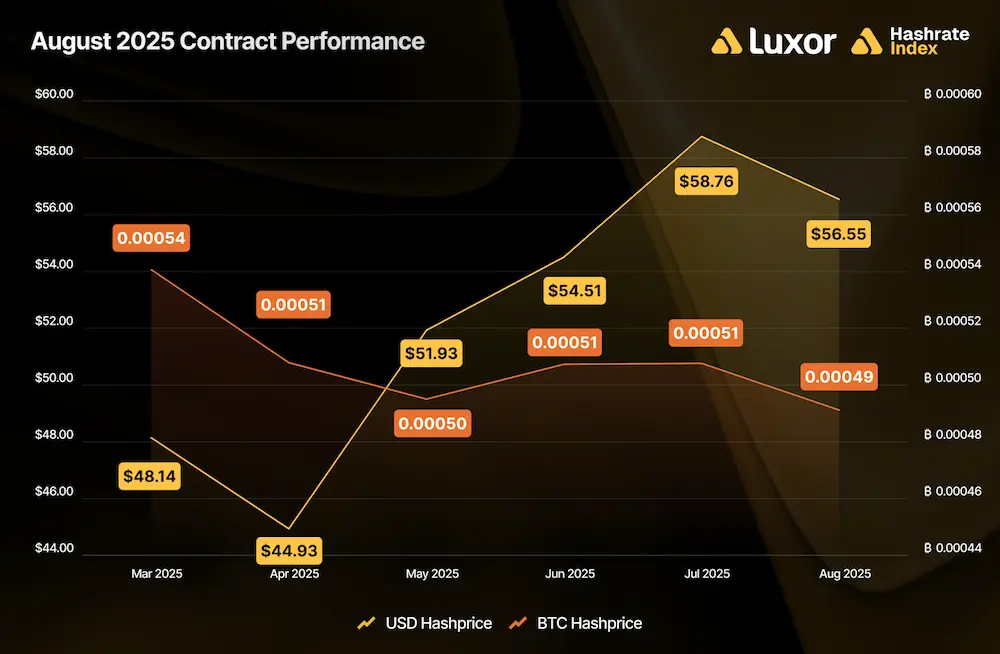
On the BTC-settled side, sellers came out ahead across the board. Early forward sales (March – April) outperformed spot FPPS by 3-10%, while later hedges (between May – June) saw modest gains of ~1-3%. The best performance for BTC-denominated sellers was marked by a 5-month forward sale in March, which would have earned an additional 10% in BTC production by locking in fixed pool payouts at 0.00054 BTC per PH/s/day, compared to spot FPPS rates at 0.00049 BTC throughout August. Those who used upfront payouts even received immediate, non-dilutive capital in exchange for a fixed commitment to deliver hashrate over time.
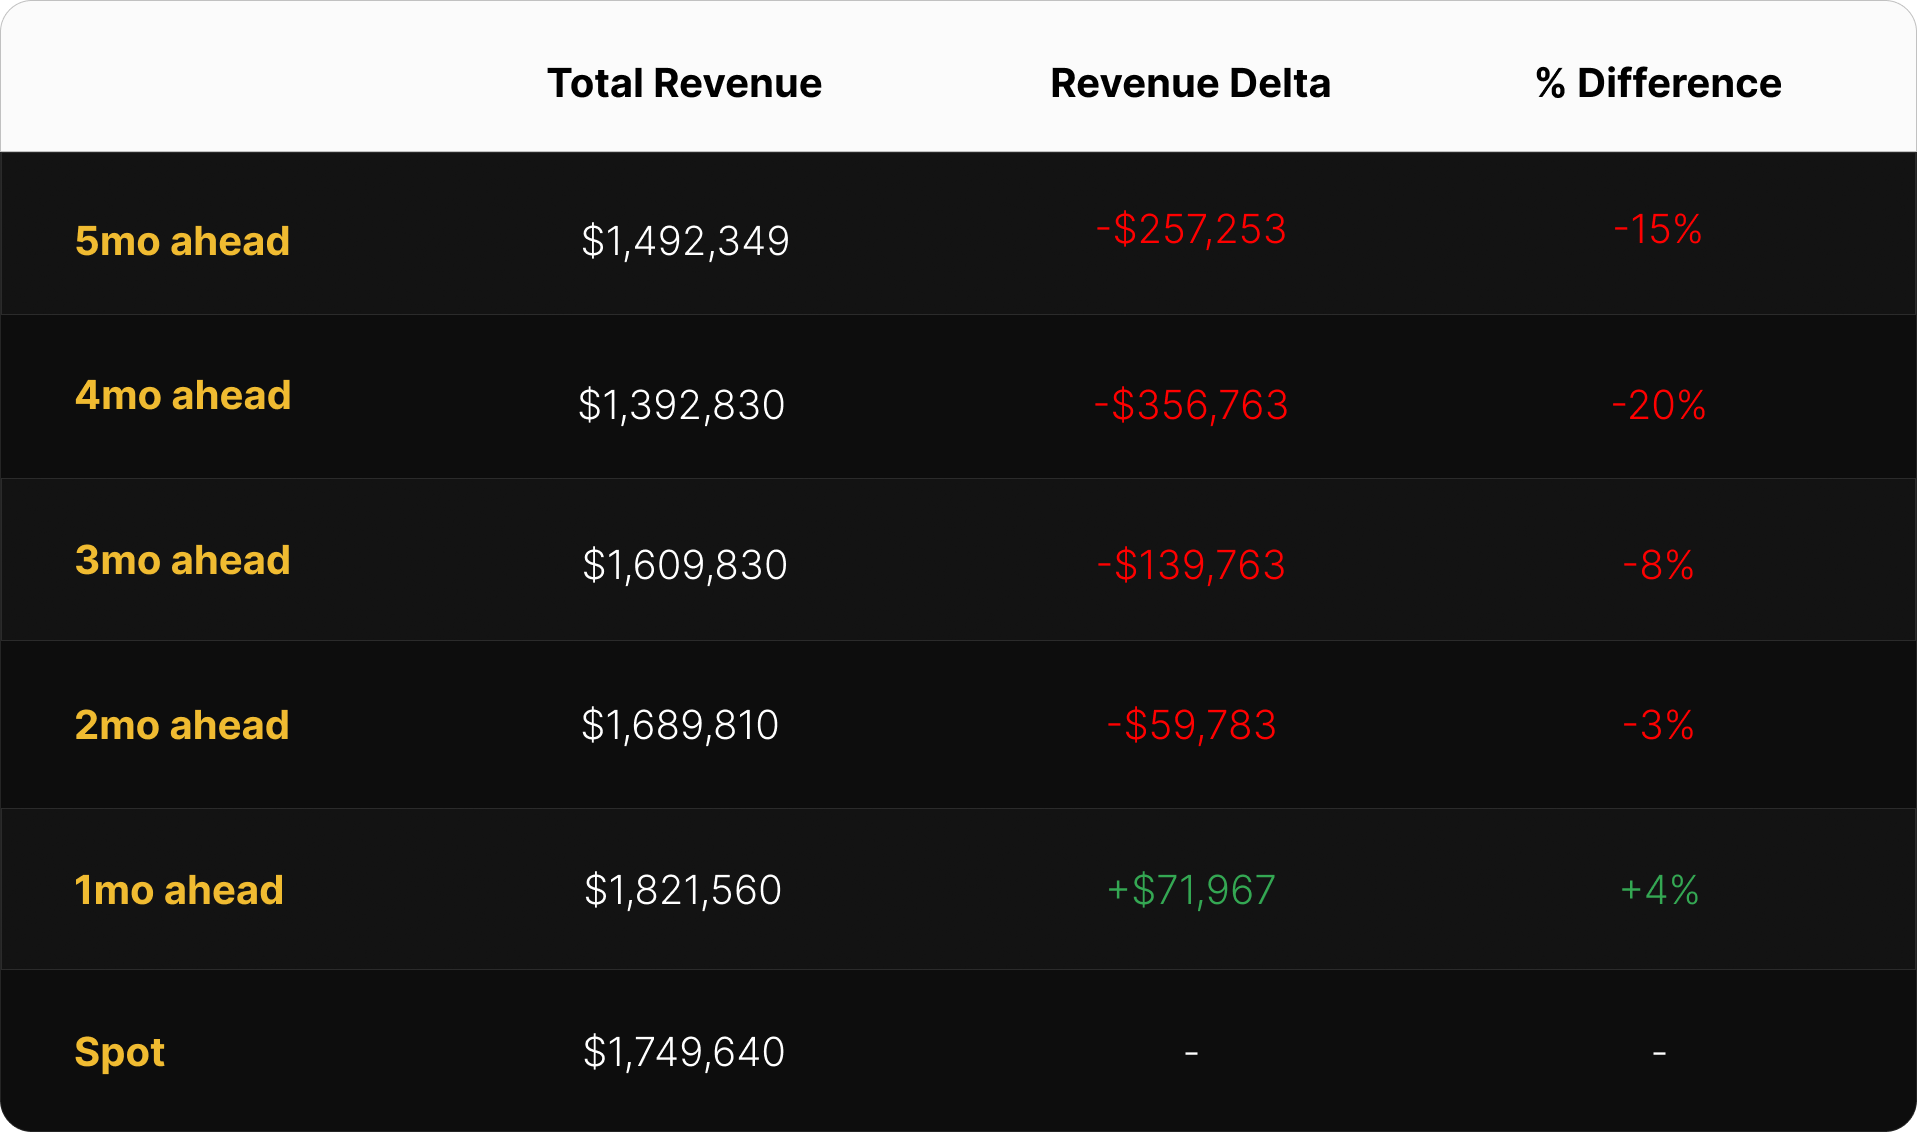
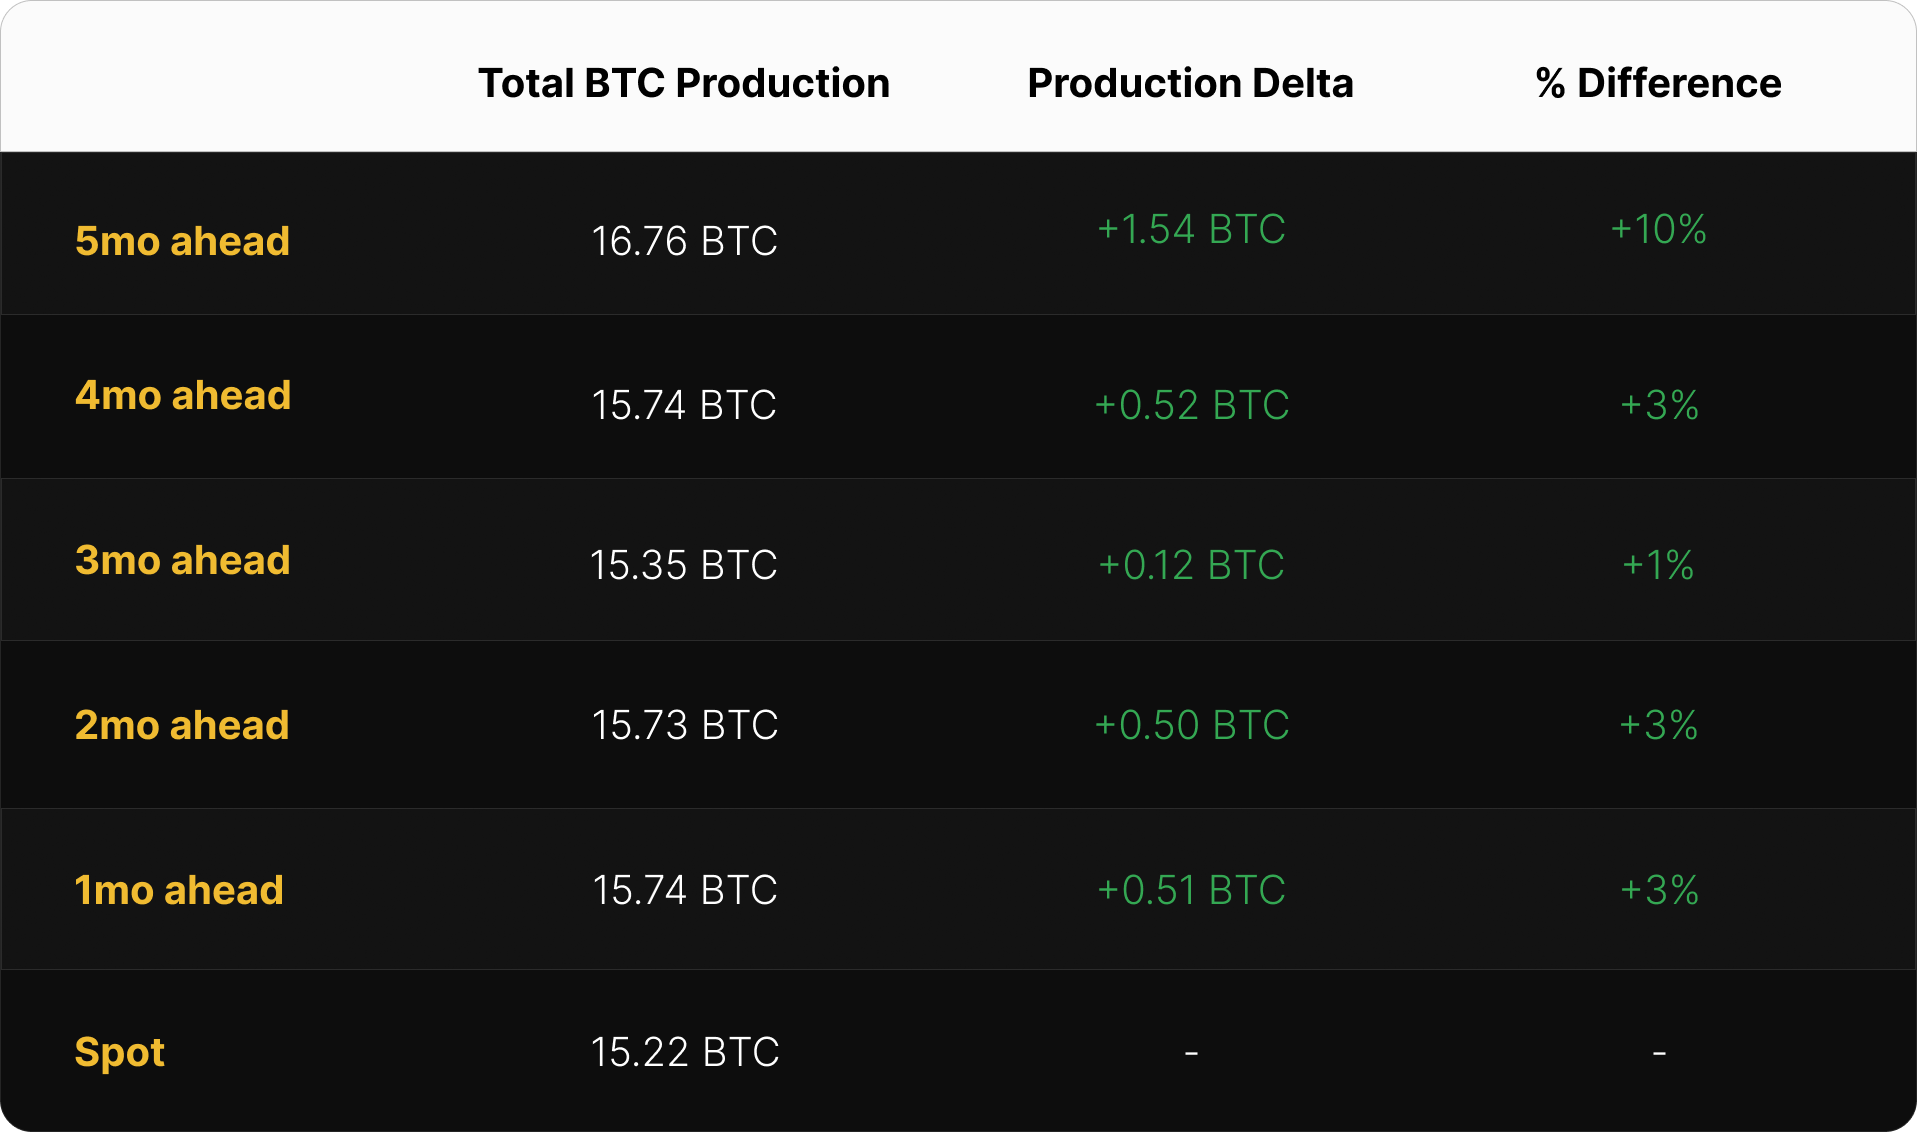
The tables below summarize how a 1 EH mining operation would have performed by selling August 2025 hashrate forward — one showing USD revenue outcomes, the other showing total bitcoin production — compared to spot mining via FPPS.
Zooming out, the following chart reveals how different rolling hedge strategies performed relative to spot FPPS mining, segmented by contract denomination and hedge horizon over the past year, from August 2024 – August 2025:
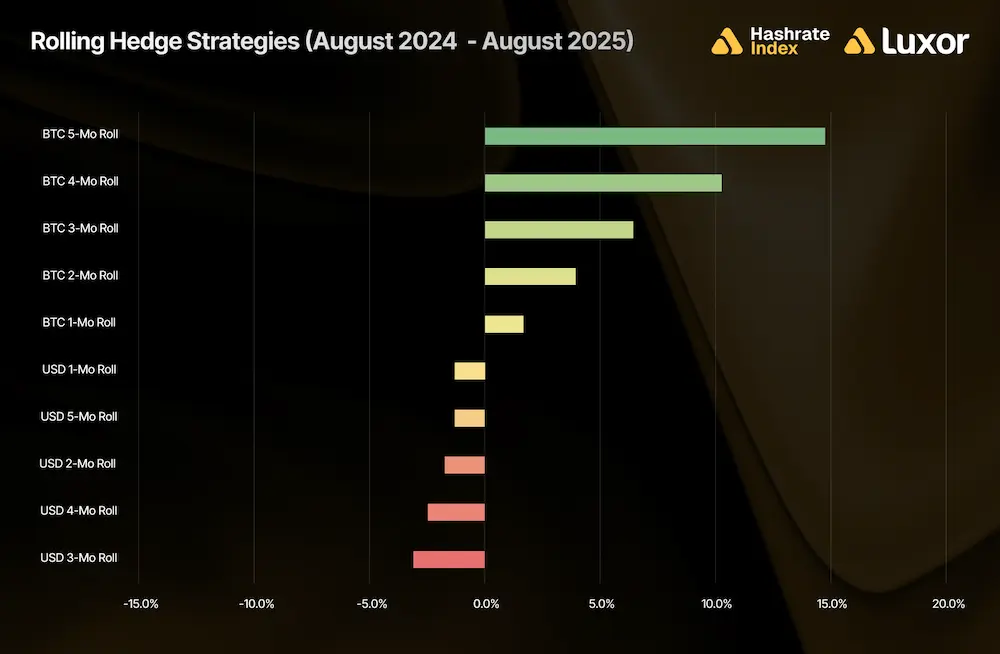
This comparison reveals that rolling BTC-denominated hedging strategies outperformed between August 2024 and August 2025, with the strongest results coming from 5-month (+12.5%) and 4-month forward sales (+9.2)%. These longer-duration contracts benefited from being priced ahead of rising network difficulty and low fee environments, while still maintaining bitcoin price exposure. In contrast, USD-denominated hedging underperformed spot FPPS by an average of -2.9% because of high bitcoin prices.
Miners who locked in fixed pool payouts between August 2024 and August 2025 were better insulated from the hashprice decline driven by difficulty increases and weak fee activity. Those who used upfront payouts even went a step further by front-loading revenue.
Note: these figures are strictly for demonstration purposes and exclude fees and bid/ask spreads associated with entering into hashrate forward contracts.
A second caveat: although selling forward proved to be favorable during timeframes shown above, it is critical to recognize that hedging is typically a cost of business rather than a revenue generation method. Hedgers willingly pay a price to buy certainty and obtain more predictable cash flows, which increases valuation, reduces cost of capital, and ultimately attracts investments.
How Future Hashrate Traded in August 2025
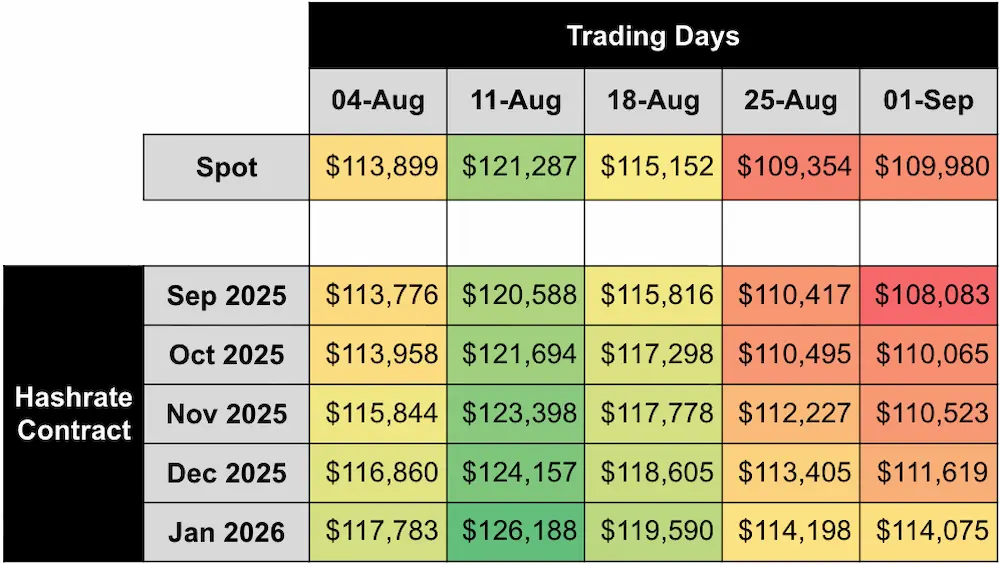
The two tables below summarize the evolution of hashrate forward markets during August 2025, for the subsequent five months from September 2025 – January 2026. Rows represent specific monthly hashrate contracts, while columns represent specific trading days. Cell values indicate the average daily mid-market price, except for spot prices.
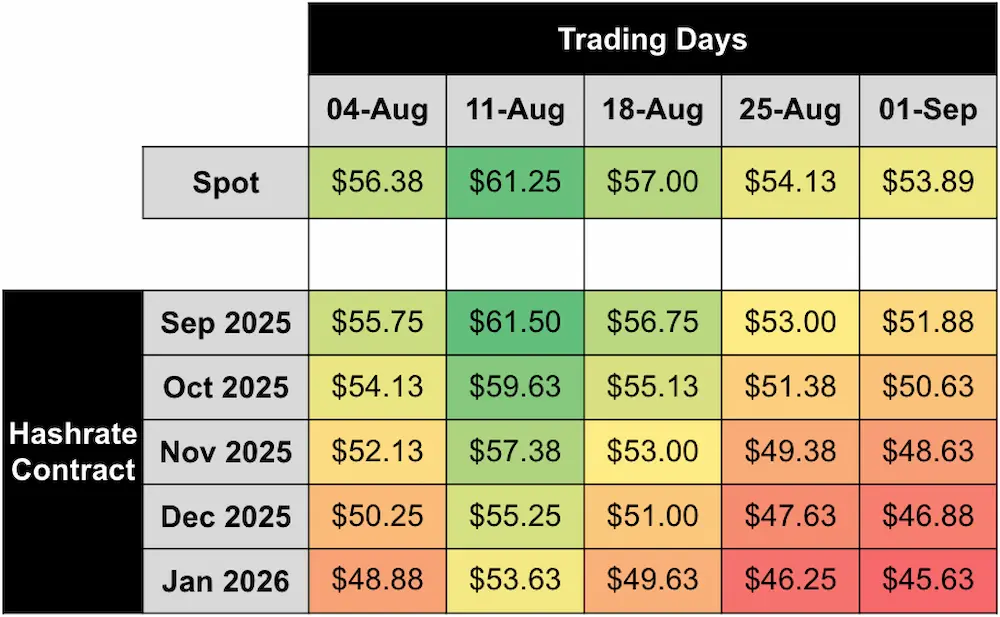
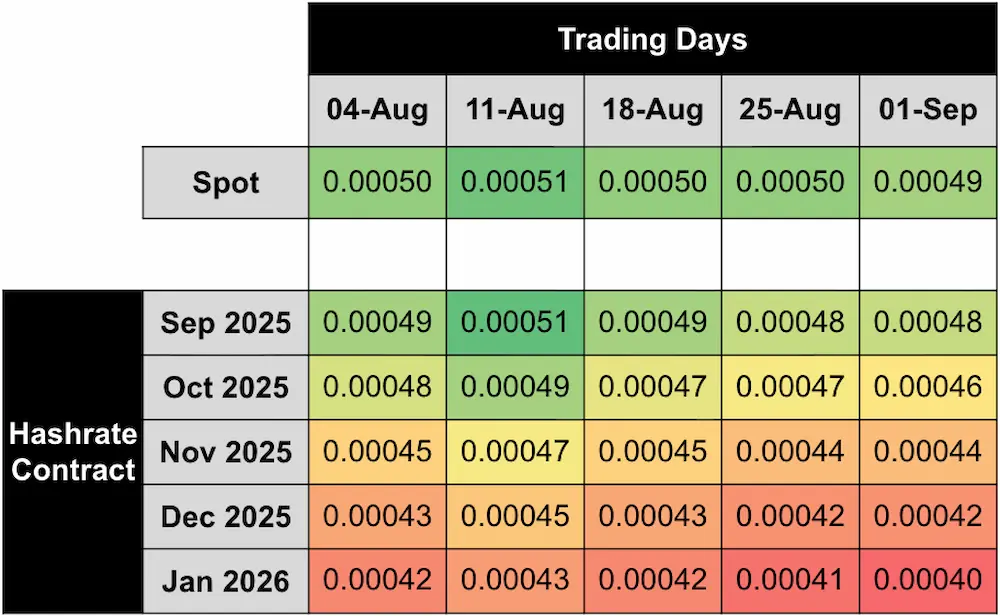
Between August 4 and September 1, September 2025 to January 2026 USD-denominated hashrate forward contracts fell 6–7% as bitcoin price declined and spot USD hashprice followed. Similarly, BTC-settled contracts fell 2–4%, reflecting the BTC hashprice dip driven by weak transaction fees and all-time high network difficulty. Nearly all monthly contracts traded in backwardation throughout the period, although the front-end September contracts showed a slight contango on August 11.
By dividing USD contract values with BTC contract values, we can use the two contracts to back out implied bitcoin price expectations expressed by the forward market. Throughout August implied bitcoin price expectations traded mostly in contango but fell 3–5%, mirroring price action in spot hashrate markets.
If we make an assumption around transaction fees, we can also calculate the changes in implied difficulty and network hashrate expectations expressed by the forward market. In the tables below, we assume a 0.025 BTC per block transaction fee collection on August 4 and September 1, respectively:
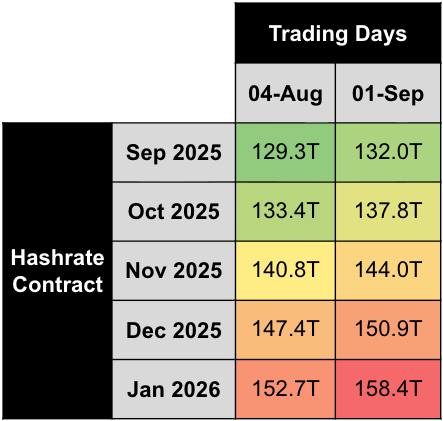
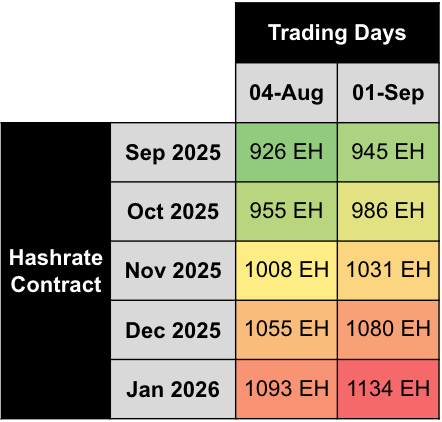
Note: figures assume 0.025 BTC per block transaction fee collection on August 4 and September 1, 2025.
Based on this simplified analysis, we estimate that future hashrate expectations grew slightly during the month of August, rising in the 2–4% range for the September 2025 – January 2026 contracts.
Concluding Thoughts and Looking Ahead
On September 2, Bitcoin’s 7-day Simple Moving Average (SMA) for network hashrate crossed the unprecedented threshold of 1 ZH/s (one zettahash per second) — equivalent to one sextillion (10²¹) hashes every second. This milestone underscores the relentless growth of Bitcoin’s security and the ongoing industrialization of mining. From terahash machines barely a decade ago to today’s zettahash-scale network, the pace of advancement highlights both the rapid hardware innovation of ASIC manufacturers and the massive capital investment flowing into mining infrastructure worldwide. For miners, 1 ZH/s is a reminder that competitive pressures will only intensify, making efficiency, scale, and financial discipline more important than ever.
From a hashprice perspective, however, 1 ZH will only be fully “priced in” once network difficulty climbs to 139.7T — the level at which today’s zettahash-scale hashrate becomes the baseline assumption for future block production.
In the coming months, we anticipate network hashrate growth to continue as Texan miners emerge from this summer’s 4CP program. By strategically curtailing during peak hours, miners can significantly reduce next year’s annual transmission costs, but they must remain nimble as program features evolve. With the future of 4CP uncertain and subject to regulatory change, how transmission costs are allocated and how miners engage with the Texas power market may be reshaped. 4CP also acts like holding a ball under water: while in effect, it suppresses hashrate, but once released at the end of September, hashrate ‘pops up’ as curtailed rigs return online. Forward hashrate market participants are already pricing in this rebound.
As Bitcoin miners become increasingly sophisticated power market participants, their ability to manage energy costs becomes a competitive edge. If you are interested in learning more about mining and energy, check out our recently launched series: Energy Markets for Bitcoin Miners.
In the first post of this series, we explored how Bitcoin miners manage market exposure through spot and fixed-price power contracts. These hedging profiles offer different trade-offs: spot provides flexibility, while fixed-price power introduces cost certainty and the potential to monetize volatility through grid resale.
In the second post, we dug into a more advanced strategy: fixed-price power contracts overlaid with financial instruments, specifically short call options on power and fixed Bitcoin mining pool payouts. Together, these tools allow miners to lock-in and grow stable operating margins.
In the third post, we analyzed how flexible miners earn revenue by supporting the grid — and why structure matters.
In the final post, we examined colocation and off-grid mining models: how they work, the economics behind them, and how hybrid structures can blend the benefits of independence with the optionality of grid access.
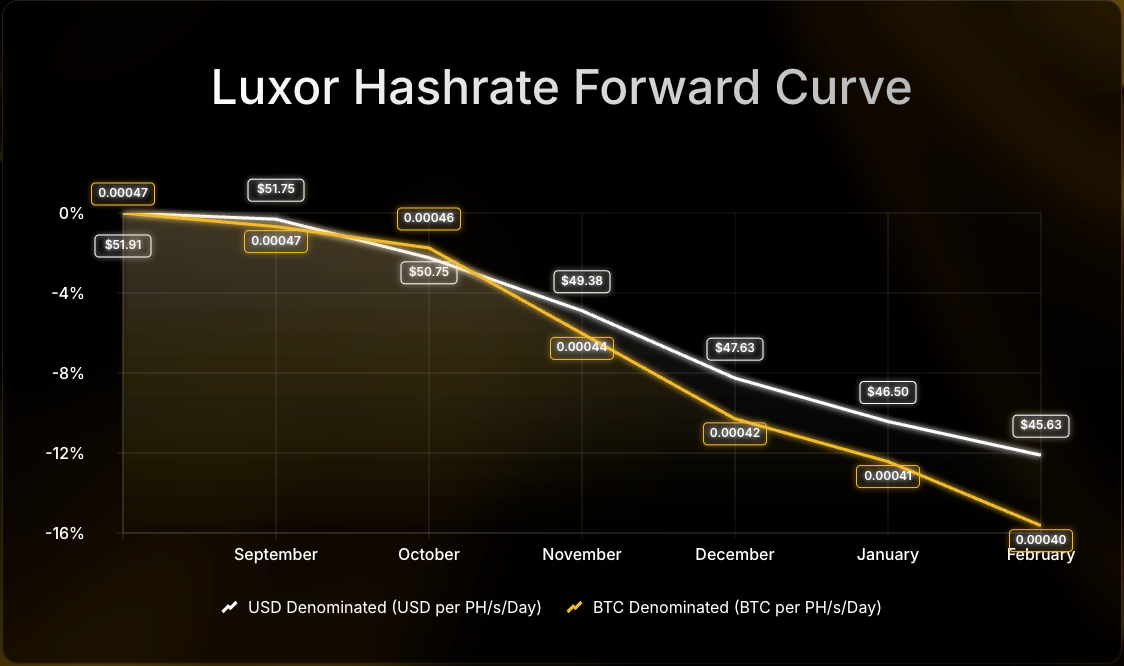
Looking forward, Luxor’s Hashrate Forward Market is pricing in an average hashprice of $48.61 or 0.00043 BTC per PH/s/day over the next six months. Sellers can currently secure this hashprice while buyers have the opportunity to lock in the same hashcost through to February 2026.
If you’d like to learn more about Luxor’s Bitcoin mining derivatives, please reach out to [email protected] or visit https://www.luxor.tech/derivatives.
Disclaimer
This content is for informational purposes only, you should not construe any such information or other material as legal, investment, financial, or other advice. Nothing contained in our content constitutes a solicitation, recommendation, endorsement, or offer by Luxor or any of Luxor’s employees to buy or sell any derivatives or other financial instruments in this or in any other jurisdiction in which such solicitation or offer would be unlawful under the derivatives laws of such jurisdiction.
There are risks associated with trading derivatives. Trading in derivatives involves risk of loss, loss of principal is possible.


Hashrate Index Newsletter
Join the newsletter to receive the latest updates in your inbox.


