Bitcoin Mining Difficulty Forecasting 101: Report
We've devised a new method for forecasting mining difficulty. Learn more in our latest report.
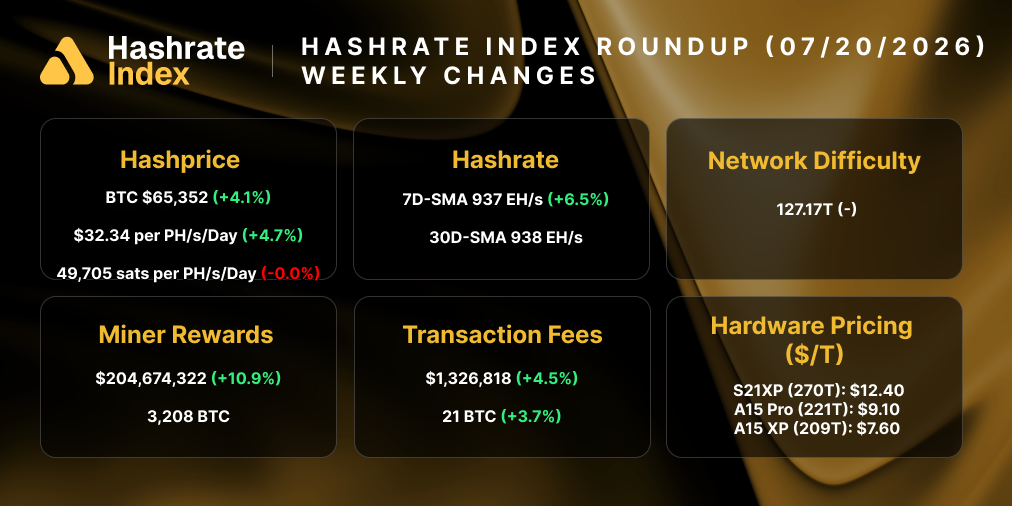
Bitcoin’s network difficulty is at an all time high. This has Bitcoin miners, hosting providers, lenders, financiers, and hashrate forward traders all wondering what comes next. Will Bitcoin’s price keep up with hashrate and difficulty growth? Can investors with Bitcoin mining exposure use difficulty trends to plan for the future?
To tackle these questions, we're pleased to introduce our latest report: "Forecasting Bitcoin Difficulty: Difficulty Forecasting 101 for Bitcoin Miners, Hosters, Lenders, and Hashrate Traders."
The report addresses the questions we presented above to help market participants navigate and anticipate volatility for Bitcoin's difficulty and hashprice. You can download the report below.
In addition to giving a run-down on how Bitcoin's difficulty affects Bitcoin mining profitability and how miners can plan around difficulty changes, the report also introduces:
- A new time series forecasting method for upcoming difficulty adjustments which improves overall performance relative to the constant block time method, particularly at the beginning of the epoch.
- Updated hashrate supply and demand model projections and sensitivity tables, which will be made available to Hashrate Index Premium subscribers and refined on a quarterly basis. (Please reach out to [email protected] if you are interested in subscribing to quarterly updates of Luxor’s hashprice, hashrate and difficulty models and forecasts).
And for the rest of today's newsletter, a synopsis of some of the report's highlights:
How Has Network Difficulty Behaved Historically?
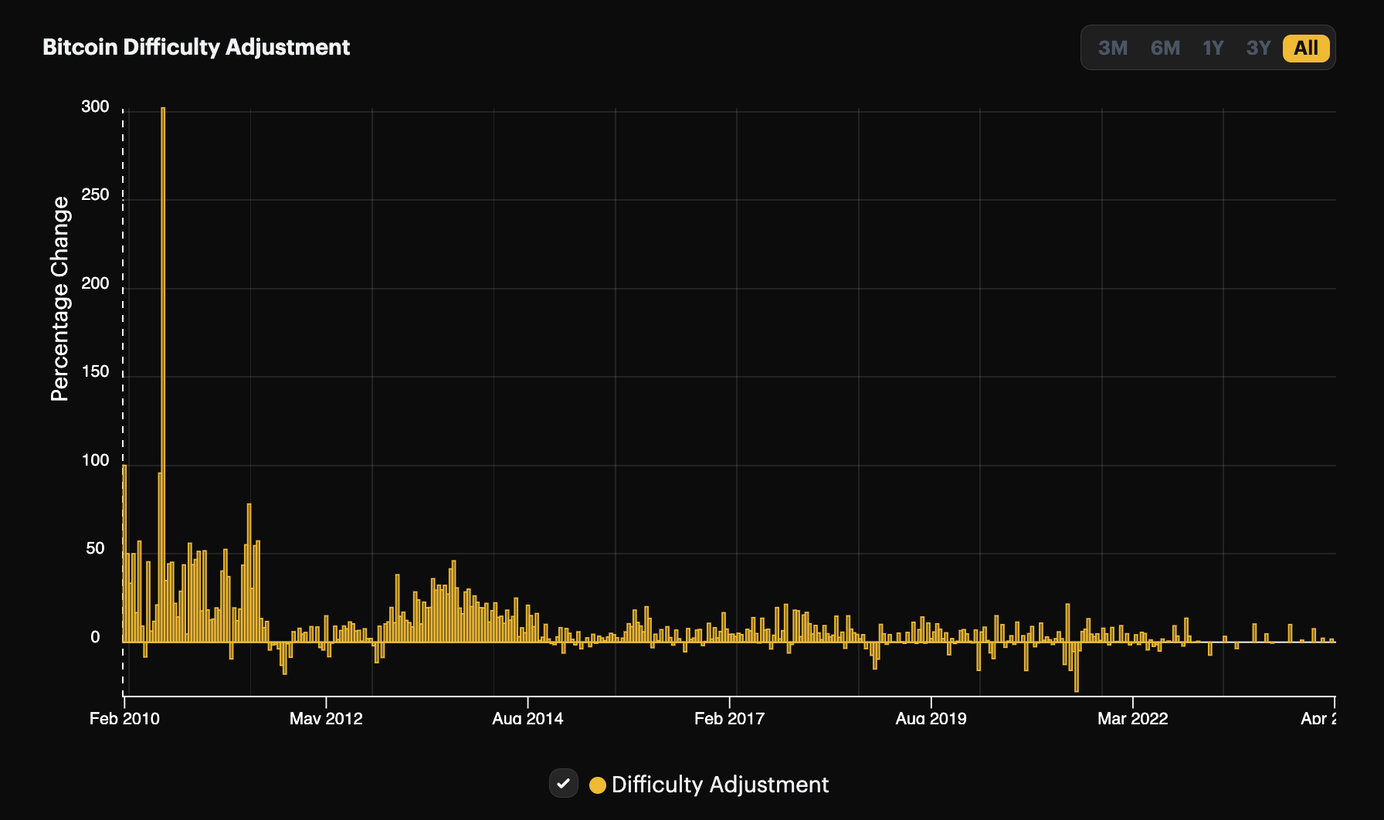
Since Bitcoin’s inception, network difficulty has grown from 1 to 48.71 trillion. This means it is 48.71 trillion times harder to mine a Bitcoin block today than when mining first began in 2009 – a compound increase of 20.64% per month.
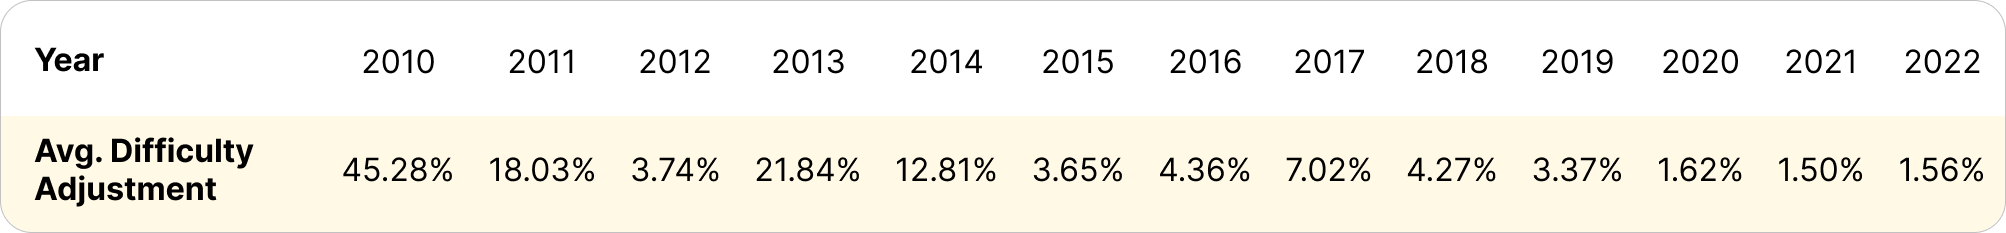
Large decreases in Bitcoin’s mining difficulty sometimes follow political and policy decisions (e.g., China's mining ban), which in turn can lead to larger increases in difficulty once hashrate relocates and comes back online. The most dramatic increases in network hashrate have coincided with the adoption of new, more energy efficient mining hardware (e.g., when GPUs replaced CPUs and when ASICs replaced GPUs/FPGAs). Bitcoin price changes can also significantly impact difficulty changes as hashrate supply comes online to capture excess margins.
How Can We Forecast Network Difficulty?
There are three basic approaches to forecasting, which we can employed in a number of ways to estimate future network difficulty:
- Qualitative techniques
- Time series analysis and projections
- Causal models
We describe each of these approaches and provide examples for how they can be employed to forecast Bitcoin network difficulty in the report.
Luxor's "Dual Epoch Method" for Forecasting Difficulty Adjustments
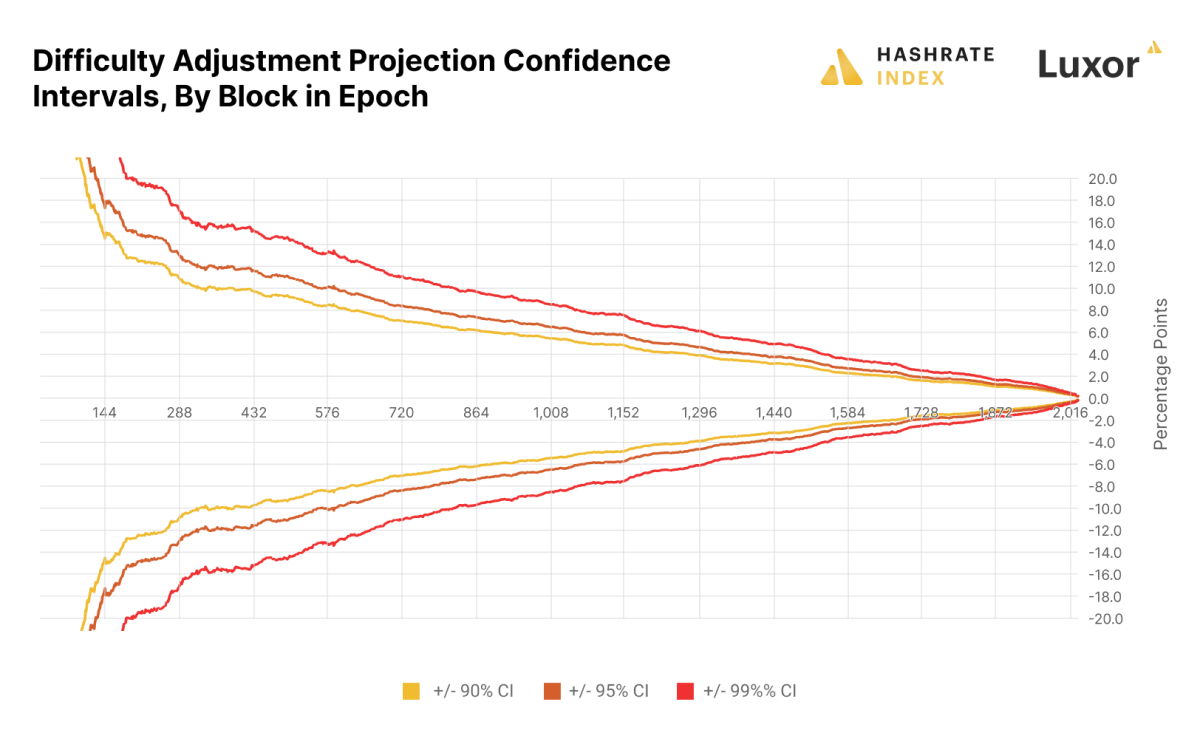
For this report, we developed a new time series forecasting method for upcoming difficulty adjustments, which improves accuracy at the beginning of the epoch compared to the constant block time method. We call this the succinctly named rolling 2,015 block, square root weighted, epoch adjusted block time method (or just “rolling block method,” “adjusted block time method,” or “dual epoch method”).
This new method improves upon the constant block time method early in the epoch by including block times from the previous 2,015 blocks, instead of just the blocks from the current epoch, which can skew forecasts early in the epoch for lack of data points. To account for the change in network difficulty between epochs, block times in the previous epoch are adjusted by the previous adjustment. And finally, we weight the average block times of the current epoch with the square of the proportion through the epoch. This final step is to diminish the impact of block times from the previous epoch as the current epoch progresses since these values do not actually determine the upcoming adjustment.
In the chart above, we can see through confidence intervals that the new method performed better than the old model at the beginning of the epoch up to block 650, but it performed slightly more poorly thereafter.
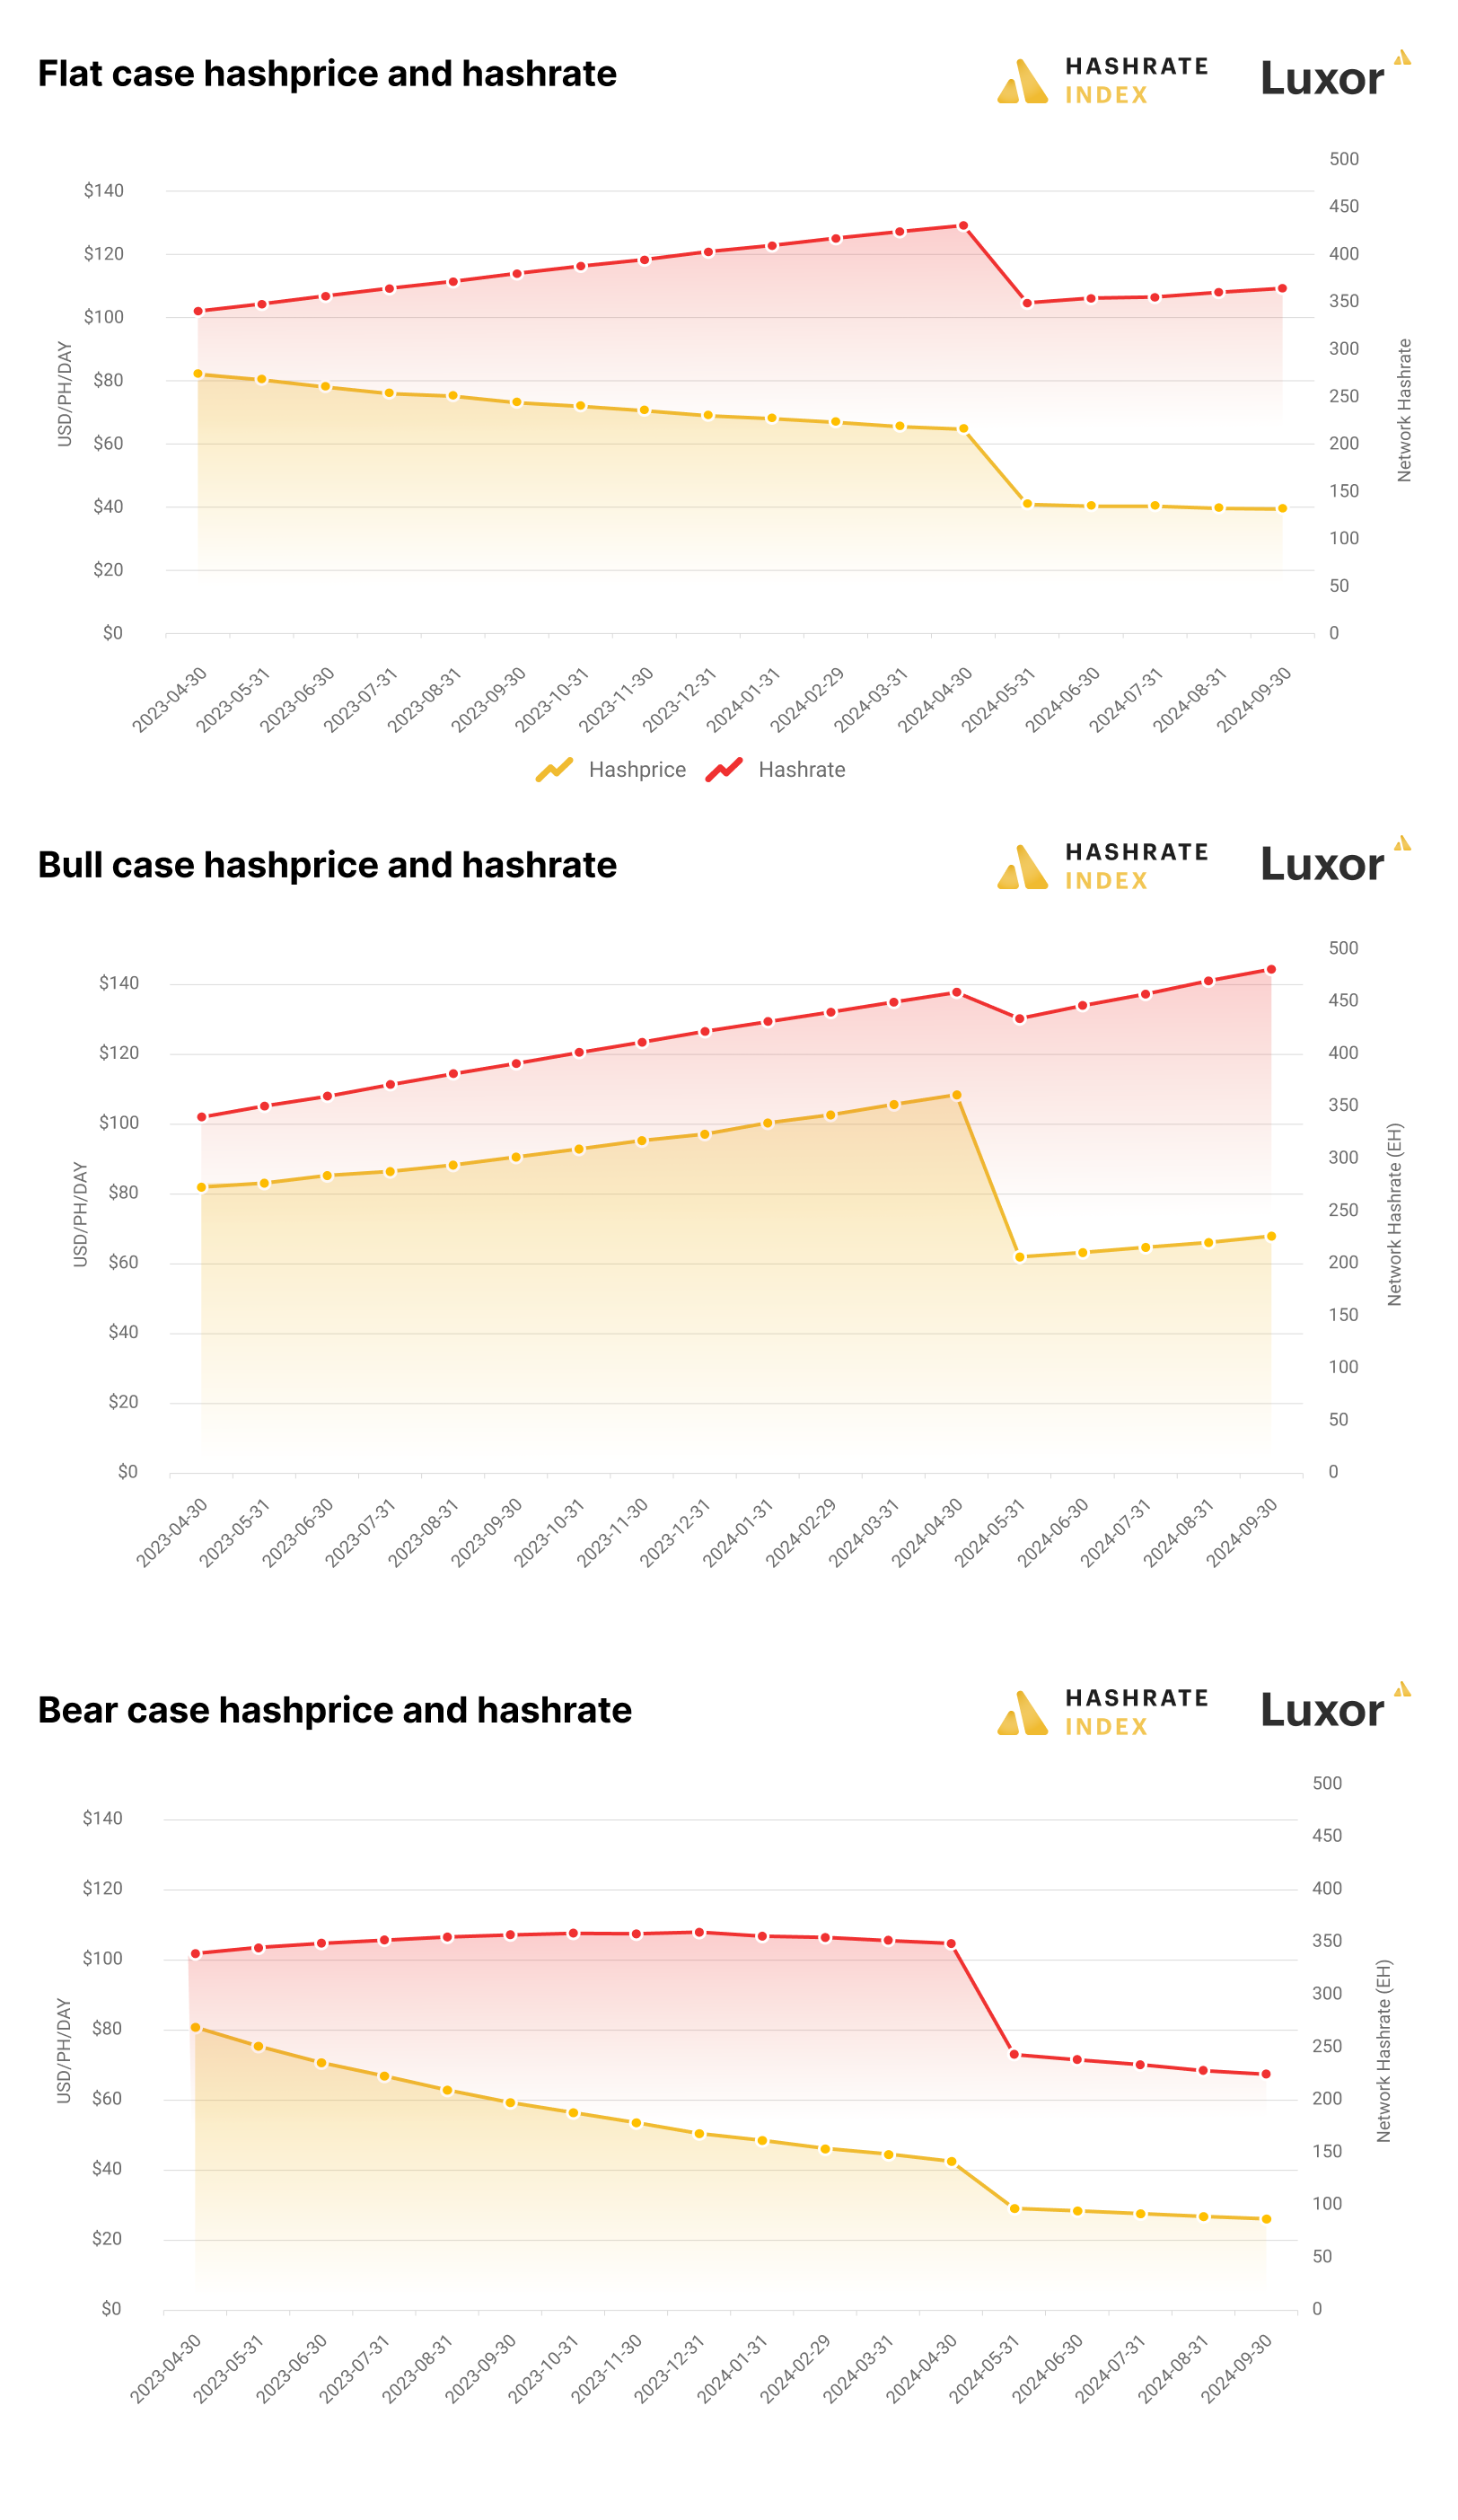
Our model takes Bitcoin price, transaction fees, and block subsidy as inputs on the demand side, and internal data on ASIC production estimates and operating cost distributions across the industry on the supply side. Using these input, the model produces an equilibrium hashrate, difficulty, and hashprice for 18 month periods. The model structure reflects reality; hashrate, difficulty and hashprice are endogenous to the system, not exogenous determinants of one another. We can conduct sensitivity analysis with the model across all inputs as well. For example, we can forecast an equilibrium hashrate, difficulty, and hashprice across a range of Bitcoin prices.
The charts below present projections from our updated hashrate supply and demand model. It provides estimates for flat, bull, and bear Bitcoin price scenarios.
Hashrate, Difficulty, and Hashprice Projection Updates for Hashrate Index Premium Users
Hashrate is an emerging asset class and digital commodity market. Hashrate market participants like Bitcoin miners, hosters, lenders, investors, and traders need access to the rigorous economic analysis and data available in other commodity markets.
As such, and due to positive feedback we received on version 1 of our hashrate supply and demand model, Luxor has decided to dedicate resources to continually refining and improving our hashprice, hashrate, and difficulty models and forecasts, which will be available to Hashrate Index Premium customers on a quarterly basis.
Hashrate Index Premium customers will receive the following in PDF and Excel format:
- 18-month flat, bull, and bear BTC price scenario projections
- Full Bitcoin price sensitivity tables (i.e., an equilibrium hashrate, difficulty and hashprice will be provided across all probable Bitcoin prices).
- A detailed description of assumptions, which will be continually refined and improved.
To learn more abou the model and see how it could help with planning mining operations and hedging hashprice volatility, you can download the full report at the top of the article. Please reach out to [email protected] if you are interested in subscribing to quarterly updates to Luxor’s hashprice, hashrate, and difficulty models and forecasts.


Hashrate Index Newsletter
Join the newsletter to receive the latest updates in your inbox.


