Hashrate Index Q1-2023 Report: From Ramen to Ribeye (or at Least a Decent Sirloin)
Q1-2023 delivered many welcomed surprises to Bitcoin miners.
Hashrate Index's Q1 report is here!
Last quarter hit the mining sector like a slap in the face or a splash of ice cold water – but in a good way.
Bitcoin's sudden rise over the quarter shocked the industry back to life, and as margins improved, Bitcoin's hashrate surged, public Bitcoin miners bounced back from the brink, and miners with average power/hosting costs in the US rose back above breakeven costs.
We cover all of that and much, much more in our Q1-2023 report, which you can download below:
And if you're in a rush and want to read it all later, here's a sampling of some of our findings.
Hashprice rises from all-time lows
The collapse of FTX and the contagion it caused put bitcoin on life-support at the end of last year – and with it, much of the Bitcoin mining industry.
Bleak as the new year looked at the outset, the lowest day for hashprice on a USD basis in Q1 was January 1. It was only up from there as a 70% rise resuscitated Bitcoin’s price over the quarter, and along with it, hashprice.
Hashprice rose 31% over the course of Q1-2023 thanks to Bitcoin’s price appreciation.
This rally gave miners some financial cushion, especially those with middle-of-the-road power costs.
At the turn of the new year, for example, an S19j Pro’s breakeven power cost was $0.0812/kWh; by the end of last quarter, the breakeven was $0.10/kWh. Not exactly lavish margins, but it’s welcomed breathing room for miners who were underwater at the end of last year.
As ever, the profitability boost means more hardware came online last quarter than miners otherwise would have deployed with a lower hashprice. The 35% increase in Bitcoin’s hashrate fed Bitcoin’s mining difficulty, which swelled 31.6% over Q1 to an all-time high. In turn, this growth shrank BTC hashprice 23.2% over Q1-2023.
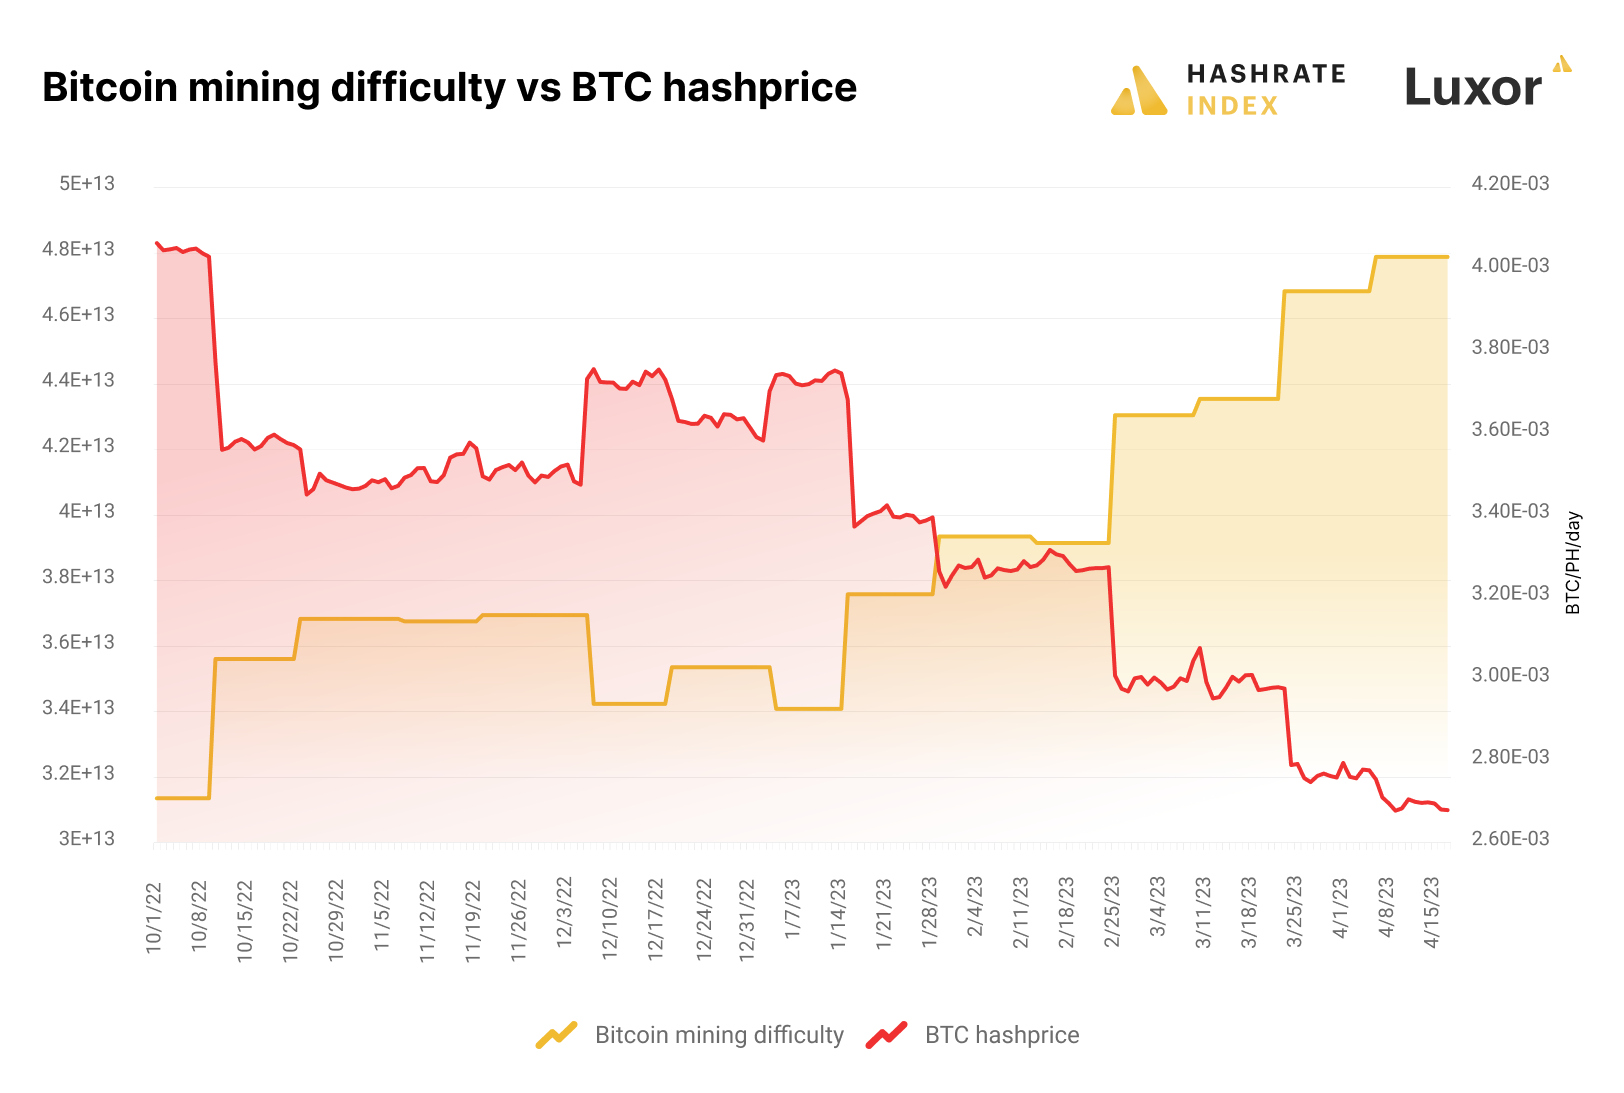
The average USD hashprice over Q1 was $73.08/PH/day, versus $65.47/PH/day in Q4-2022 and $123.88/PH/day over 2022. So quarter-over-quarter, average hashprice saw a much-needed bump, but relative to the whole of 2022 (a bear market year), hashprice is still down bad.
If Bitcoin keeps running, then this could offset the inevitable hashrate/difficulty growth and keep hashprice above $80/PH/day.
Read on in the report for detailed hashprice/hashrate forecasting
Average hosting cost per state and province stabilize
As hosting providers become more transparent and networks open up, it’s becoming increasingly easier for miners to geographically distribute hashrate. Hosting marketplaces, like Compass and Blockware, as well as directory/referral sites, like Luxor’s ASIC Trading Desk and Hashbranch, have opened up retail access to bitcoin mining hosts all over the world.
In the US and Canada, hosting prices are stabilizing and, in some regions, coming down after rising with energy costs in 2022. And contrary to Q4-2022, the average hosting cost for every state is below the current breakeven cost for an Antminer S19j Pro.
The halving is nearly a year out, and a looming question is whether or not these average hosting rates will be viable in a 3.125 BTC block subsidy world. We address this question in further detail in the report.
Public miners are no longer on life support
During the final quarter of 2022, when bitcoin stayed depressed in the $16k and $20k territory, most public miners barely generated cash flows from their bitcoin production. The combination of minimal recurring cash flows and millions of dollars in monthly debt payments led to Core Scientific’s bankruptcy and nearly killed several others. If the bitcoin price fell below $15k for an extended period in Q1, many more of these companies would certainly be bankrupt now.
Luckily, in typical fashion, Bitcoin made a last minute upward move, saving several public miners from their seemingly inevitable bankruptcy. The bitcoin price’s 79% increase led to a phenomenal rise in the public miners’ revenues, although ever-increasing difficulty levels somewhat dampened the effect of the price increase.
The chart above shows the estimated direct margin of the public miners in Q4 2022 and now. If you wonder, the direct margin is the difference between the bitcoin price and the direct cost of producing one bitcoin. This metric is useful for estimating cash flows from bitcoin production. For example, Riot’s 50% direct margin at the current bitcoin price of $30k means the company pockets $15k of cash flow per bitcoin produced, after paying for electricity and other direct production expenses. Last month, Riot produced 695 bitcoin, corresponding to a cash flow from operations of approximately $10.4 million at the current $30k bitcoin price.
Meanwhile, in Q4 2022, Riot’s direct margin was only 39%, while the average bitcoin price during the quarter was only $18k, giving Riot a cash flow per bitcoin of $7k. In December, Riot mined 659 bitcoin, corresponding to a cash flow of $4.6 million - less than half of what they make currently.
Other companies with high direct margins include Iris Energy and Bitfarms. Although the direct margins have significantly improved in 2023, they are still a long way from the 80% levels that were common in late 2021 and early 2022. Still, at the current margins, most public miners generate sufficient cash flows to service debts and have now climbed out of the life support territory.
Interestingly, Marathon had a slightly negative direct margin in Q4 2022. Now it is an estimated 15% - not something to brag about, but still enough to keep the lights on. Marathon struggled deploying its hashrate efficiently in 2022 but has had a great start to 2023. More on that in the next section.
With improving cash flows, it should all else equal be easier for these companies to service their debts. But how much debt do they have relative to equity? Read on in the report to find out!
Public miners are expanding hashrate despite the bear market
We all know the story. The public miners took advantage of the frothy stock market in late 2021 and early 2022 and raised a massive amount of money that they spent on ASICs which they planned to deploy over the remainder of 2022.
Fast forward to December 2022, and it became evident that many of these companies had overestimated their ability to plug in ASICs, as their deployment had taken much longer than expected.
The slow deployment was mainly caused by slower than expected buildout of mining infrastructure in North America. Much of this infrastructure is now coming online, and the public miners significantly ramped up their deployments in the first quarter of 2023.
Source: Production updates
As you can see on the chart above, all public miners have grown their self-mining hashrate so far in 2023, albeit some faster than others. The biggest deployers are Marathon and Cipher Mining.
Marathon, the biggest underperformer in 2022 in terms of hashrate deployment, seems to have finally figured out a thing or two. The self-proclaimed capital light miner grew its hashrate from 7 to 11.5 EH in Q1 2023. If Marathon keeps up this 5.5 EH quarterly hashrate growth, it could reach its 23 EH goal by the second half of this year.
Cipher Mining’s hashrate growth during the first quarter of 2023 was also impressive. With 5.7 EH plugged in, this new Texas mega miner has now joined the big boys club. Unlike most public miners, Cipher has been good at following its expansion plans.
In total, the public miners grew their hashrate by 21% from 69 to 83 EH in Q1 2023. Meanwhile, the global hashrate soared by 36% from 255 to 346 EH. More on where this hashrate could be coming from (as well as opther public miner stats, like share of global BTC production) in the report.
Inscriptions boost transaction fees for Bitcoin miners
The inscriptions craze has undoubtedly been a good a thing for Bitcoin miners.
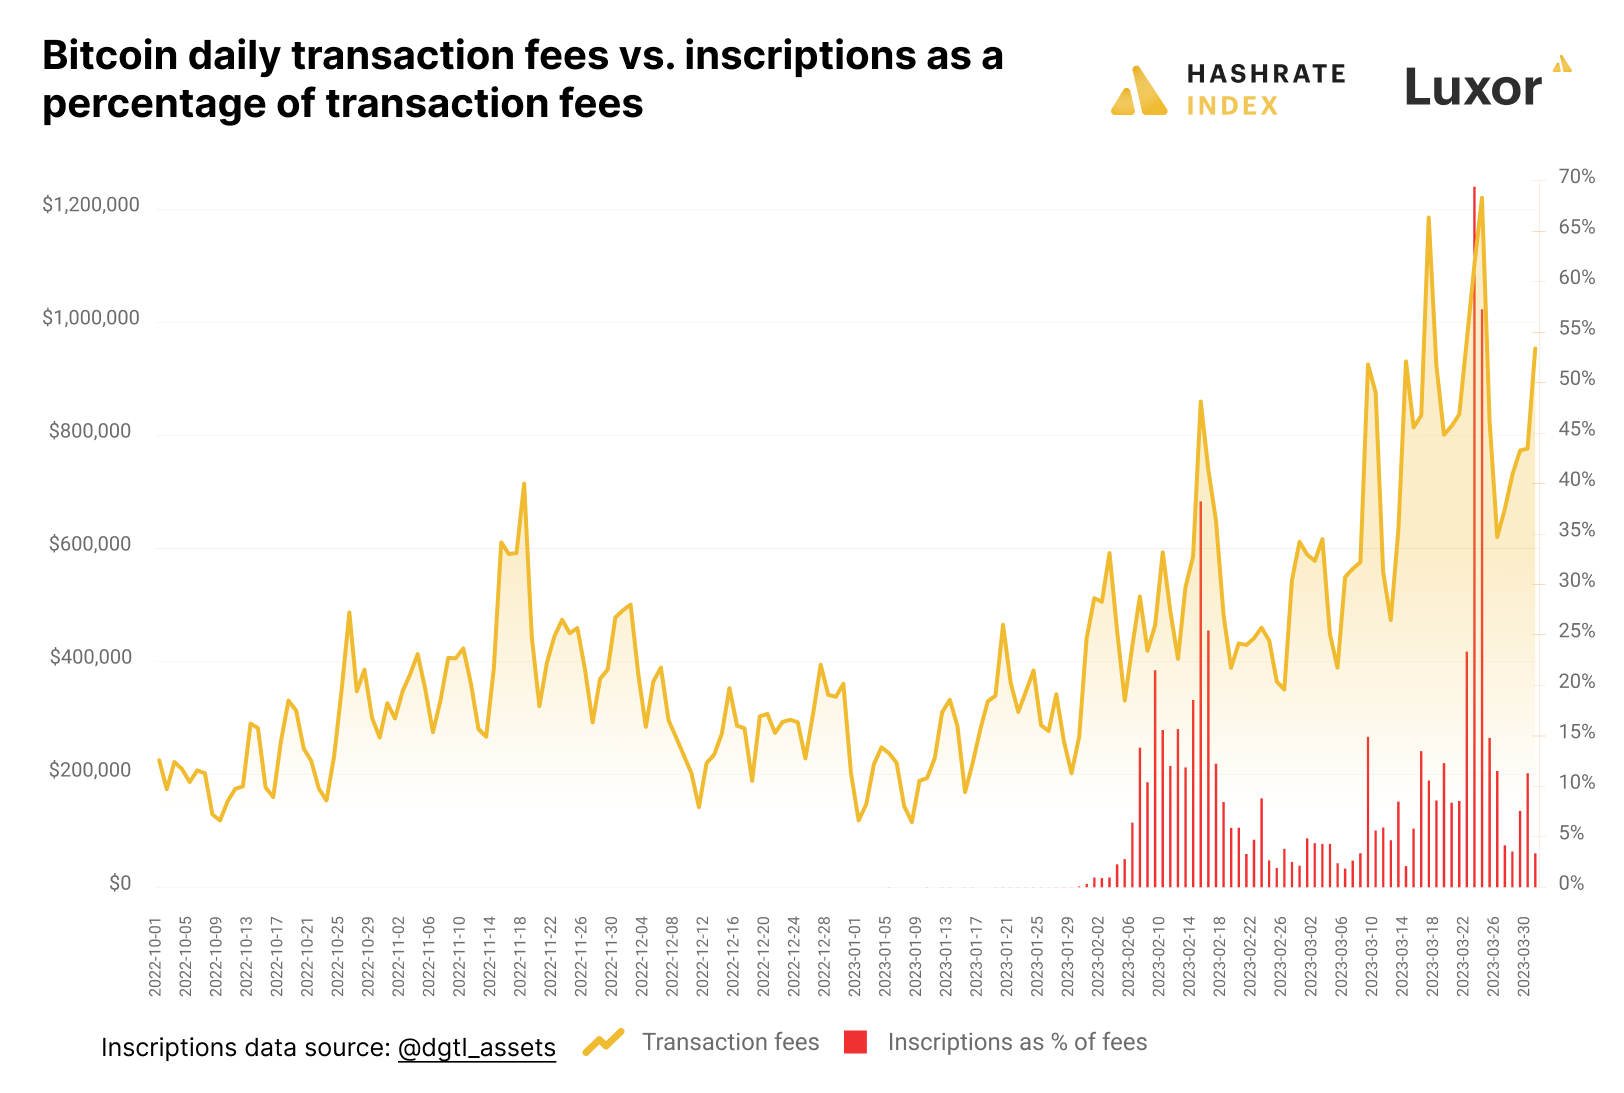
Per a Dune Analytics dashboard from dgtl_assets, inscription transactions netted miners 150.32 BTC worth $3,731,429 in Q1. All transaction fees in Q1 paid miners 1904.69 BTC worth $45,808,197, so inscriptions represented 7.9% of all transaction volume in Q1.
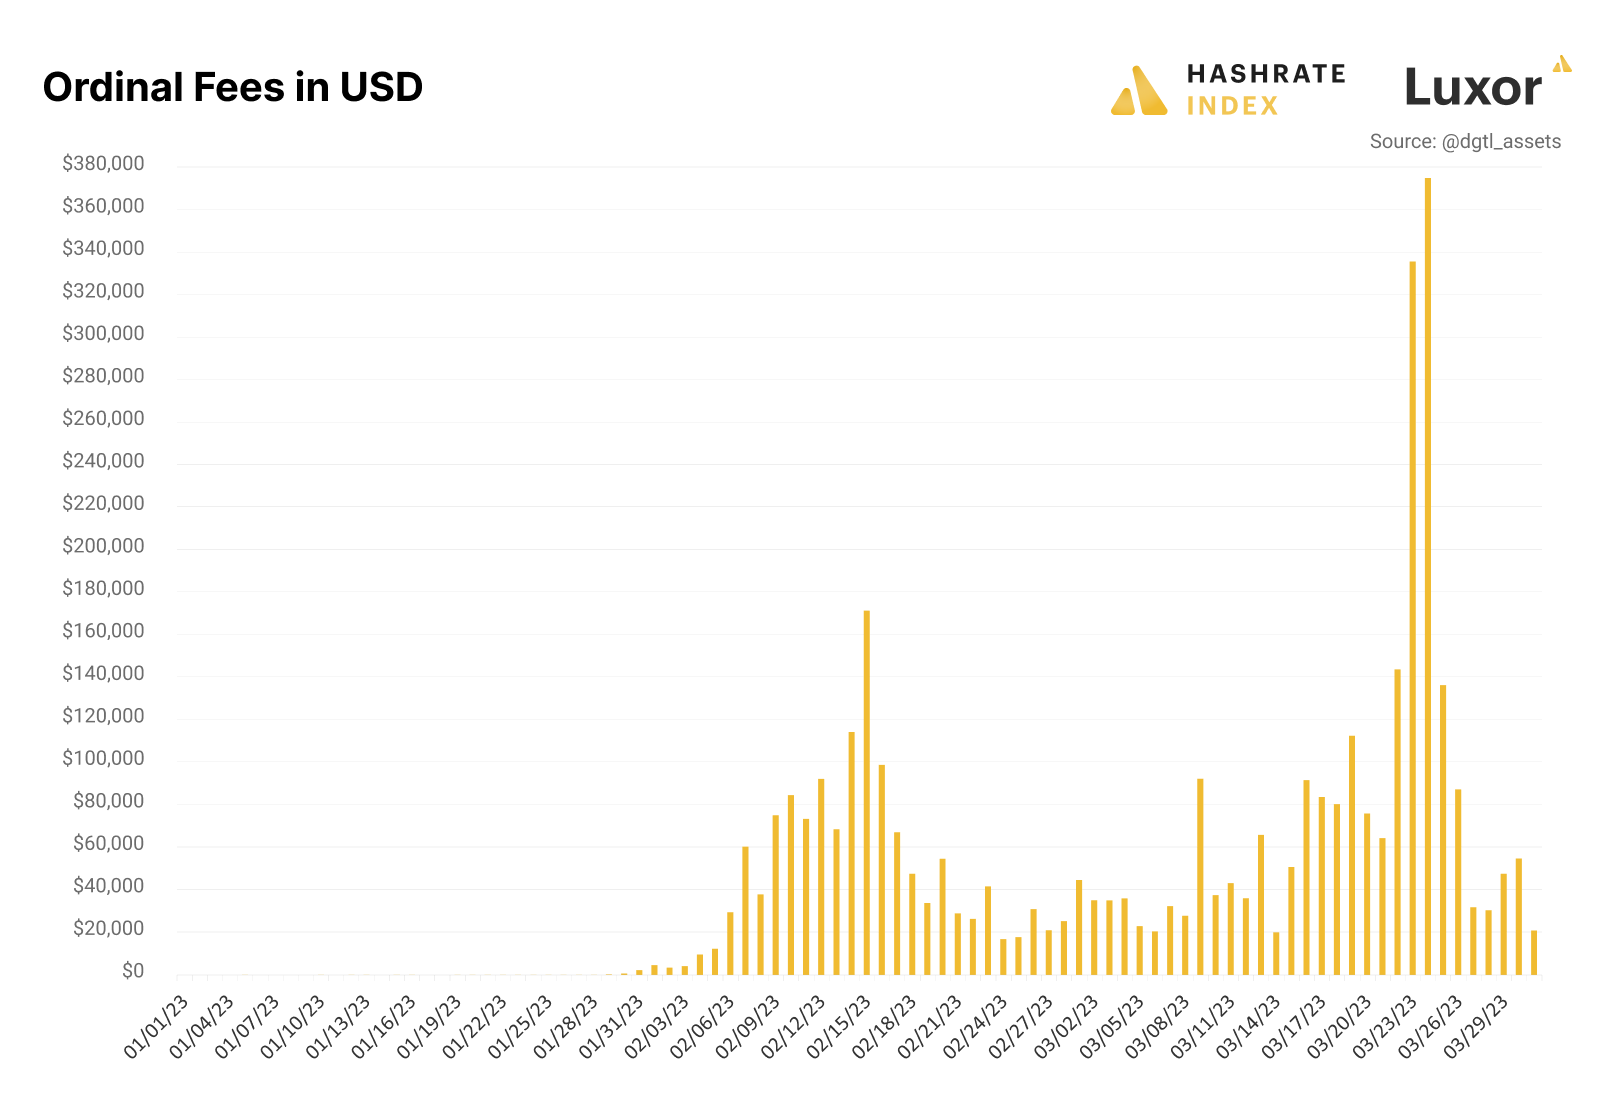
Even on days when both transaction and inscription volume were not high, inscriptions set a floor for transaction fees and kept them higher than they otherwise would be. Case in point, Q1’s average for transaction fees as a share of block rewards was 2.30%, versus 2.02% in Q4-2022 -- a 13.8% increase.
Download the full report to see the full analysis for each of the above sections and more!
Happy hashing, and have a great week!
Hashrate Index Newsletter
Join the newsletter to receive the latest updates in your inbox.


